AIOps Use Cases: 9 Practical Examples for IT and Network Teams
Published
- aiops use cases
- aiops examples
- aiops benefits
- aiops in networking

AIOps applies machine learning to IT operations data so your team can cut alert noise, find root causes faster, predict problems and automate routine fixes. The strongest use cases are the ones where operators drown in data: alert correlation, incident triage, root cause analysis, capacity planning and approved self-healing. This guide walks through nine of them, shows what each looks like in a network environment, and explains what you need in place before you start.
TL;DR
- AIOps collects telemetry, detects abnormal behavior, correlates events, points to likely root causes and automates selected remediation.
- The highest-value use cases are alert noise reduction, root cause analysis, predictive outage detection, ticket triage and capacity planning.
- In networking, AIOps works best when it sees every site, device and client in one data model, not in separate tools.
- Start with clean data, defined automation boundaries and human approval for high-impact changes.
- Benefits show up as lower mean time to detect (MTTD) and mean time to resolve (MTTR), plus fewer tickets that engineers have to read twice.
Table of Contents
- What AIOps does in IT operations
- Nine AIOps use cases that work in practice
- AIOps use cases at a glance
- AIOps in networking
- Benefits you can measure
- What to put in place before you start
- Perspective
- See what a unified AIOps platform costs
- FAQ
- Sources
What AIOps does in IT operations
AIOps stands for artificial intelligence for IT operations. TechTarget describes it as the use of big-data analytics, machine learning and AI to automate and improve IT operations. In practice, a platform does five jobs in sequence:
- Collect logs, events, configuration data, incidents, performance metrics and network traffic.
- Detect abnormal behavior using anomaly detection, pattern detection and predictive analytics.
- Correlate related events so a hundred alerts become one incident.
- Diagnose by suggesting where the problem started.
- Act by routing the incident to the right person or running an approved remediation workflow.
The first four steps reduce the time your team spends looking. The fifth reduces the time your team spends doing. Most organizations adopt them in that order, and that order is also the sensible way to read the use cases below.
Nine AIOps use cases that work in practice
1. Alert noise reduction
This is the use case most teams start with, because the pain is immediate. A single failed uplink can trigger alerts from every device behind it. AIOps groups alerts that share attributes such as service, host or region into one incident and suppresses low-value or flapping alerts. PagerDuty lists noise reduction by grouping alerts as a core AIOps capability, alongside event correlation, anomaly detection and triage.
Network example: a branch router loses its WAN link. Instead of 40 alerts for unreachable switches, access points and printers, the platform opens one incident for the router and marks the downstream devices as affected.
We cover the operational side of this in more depth in our guide to cutting alert fatigue.

2. Event correlation and pattern recognition
Correlation goes further than grouping. It connects events from different sources that look unrelated: a firmware change, a spike in latency and a burst of user complaints. When the platform knows how devices connect, correlation uses topology as well as timing, which makes the grouping far more reliable.
Network example: packet loss on one site coincides with a switch configuration change made an hour earlier. The correlated incident shows both events on one timeline.
3. Automated root cause analysis
Root cause analysis is where AIOps saves the most engineer time. Google Cloud explains that AIOps can correlate data such as database logs, server metrics and network latency to identify the cause of a performance bottleneck. The engineer starts from a ranked hypothesis rather than a blank screen.
Network example: users report slow application access at three sites. The platform finds that all three share the same upstream circuit and shows the latency climbing on that circuit only.
Our AI-powered infrastructure troubleshooting guide walks through how this diagnostic flow looks day to day.
4. Anomaly detection
Static thresholds fail in two ways: they fire too often on busy days and miss slow degradation. Anomaly detection learns what normal looks like for each device, link and time of day, then flags deviations. It also separates real issues from false alarms, which TechTarget names as a central benefit of analyzing operational data this way.
Network example: a switch port shows a steady rise in error counts that never crosses a fixed threshold. A learned baseline flags it weeks before users notice dropped frames.
5. Predictive outage detection
Predictive analytics flags potential failures, such as memory leaks or degrading response times, before they affect users. Red Hat describes predictive analytics as using historical data, statistical modeling, data-mining techniques and machine learning to anticipate issues before they occur.
Prediction is never a promise. It gives you a window to act during planned hours instead of during an outage. The more history and the more consistent the data, the better the signal.
Network example: a firewall's CPU climbs a little higher after every weekly traffic peak. The platform projects when it will saturate and opens a ticket with the trend attached.
6. Intelligent ticket triage and enrichment
Tickets are where operations data meets people. AIOps can classify tickets, set priority, route them to the right queue and attach the relevant context: affected device, recent changes, related incidents. Lenovo notes that AIOps can recommend actions, route incidents, collect diagnostics and escalate when needed.
For MSPs, duplicates are a real cost. When ten clients' devices behind one provider outage each raise a ticket, a topology-aware platform can merge them. See how that works in our post on AI ticket deduplication for MSPs and in how AI triage changes network outage handling.
7. Capacity planning and rightsizing
Historical metrics show which links, storage volumes and cloud resources run hot and which sit idle. AIOps forecasts resource needs from that history so you can add capacity before it is urgent and trim over-provisioned services before they keep costing money.
Network example: bandwidth use at a retail site grows 5% per quarter. The forecast shows when the circuit will become a bottleneck, so you can order an upgrade on your schedule.
8. Automated remediation and self-healing
Once a fix is well understood, it can be automated. Google Cloud lists triggered workflows such as restarting services, scaling resources or rolling back a problematic deployment. The level of automation should match the incident, the action required and the controls you define.
A practical rule: automate actions that are reversible, well understood and low-risk, such as restarting a hung service or clearing a stuck interface. Keep human approval for changes that can affect many users or sites.
9. Knowledge capture and incident summaries
Generative AI adds a layer on top of classic AIOps. Red Hat says it can synthesize and summarize operational data, write incident summaries and suggest fixes to speed remediation. For a network team, this means a new engineer can read what happened at a site last month without searching through chat logs and old tickets.
Documentation that stays linked to live data is what makes this work. Our overview of real-world examples of AI in IT management shows several of these patterns in operation.
AIOps use cases at a glance
| Use case | What it replaces | Typical first metric to watch |
|---|---|---|
| Alert noise reduction | Manual alert sorting | Alerts per incident |
| Event correlation | Cross-tool timeline building | Time to build an incident view |
| Root cause analysis | Trial-and-error troubleshooting | MTTR |
| Anomaly detection | Static thresholds | Issues found before users report |
| Predictive outage detection | Reactive firefighting | Unplanned outages |
| Ticket triage | Manual routing and prioritizing | Time to first response |
| Capacity planning | Spreadsheet forecasts | Emergency upgrades |
| Automated remediation | Repeated manual fixes | Tickets closed without escalation |
| Knowledge capture | Tribal knowledge | Onboarding time |
AIOps in networking
Networks are a natural fit for AIOps. They produce steady telemetry, they have a clear structure of devices and links, and a single fault can cascade across dozens of dependent systems. Three things make network use cases different from general IT use cases.

Topology matters. A server alert means little without knowing what depends on it. In networking, the connection map is the context. A platform that models devices, links, sites and clients as a graph can tell a root cause from a symptom much more reliably than one that only reads time-stamped events.
Distribution multiplies noise. A multi-site enterprise or an MSP with many clients has the same failure types repeating across hundreds of locations. AIOps spots a pattern at one site and checks whether it appears elsewhere.
Visibility gaps are physical. Cloud and SaaS data arrives through APIs. Local network data often needs a presence on site. That is why we built Vergepoints, edge devices that give the platform direct visibility into the local network.
For a longer look at where network operations are heading, read our piece on 2026 trends reshaping network operations with AI and the AINetOps playbook.
Benefits you can measure
AIOps benefits are easiest to defend when tied to operating metrics your team already tracks. IBM frames the goal as stronger end-to-end resilience, reducing both MTTD and MTTR. Beyond those two, track these:
- Alert volume per incident: shows whether correlation is working.
- Ticket reopen and duplicate rates: show whether triage and deduplication are working.
- Escalation rate: shows whether diagnostics and enrichment give tier 1 enough to resolve.
- Planned versus unplanned work: shows whether predictive use cases are shifting effort to scheduled hours.
Baseline each metric for 30 days before you switch features on. Without a baseline, you cannot show the change. Our IT operations efficiency guide and the guide to AI in service efficiency cover how to set these up.
What to put in place before you start
AIOps output is only as good as its input. Lenovo's guidance for enterprise adoption centers on reliable operational data, integration with existing monitoring and IT service workflows, defined automation boundaries and human approval for higher-impact changes. It also recommends verifying outcomes and maintaining models over time, with security and data-handling controls.
Turn that into a checklist:
- Inventory your data sources. List every monitoring tool, ticketing system and documentation store. Gaps in coverage become gaps in correlation.
- Fix identity first. Devices need consistent names, sites and owners, or the platform cannot connect events to the right place.
- Pick one or two use cases. Noise reduction and ticket triage deliver quickly and carry low risk.
- Write automation rules. For every automated action, define who approves it, what triggers it, how it is rolled back and how success is verified.
- Review monthly. Check which suppressed alerts mattered, which predictions held and which automations should be widened or narrowed.
Perspective
Most teams we talk to do not have an AI problem. They have a fragmentation problem. Monitoring lives in one tool, tickets in another, documentation in a third, and the engineer is the integration layer.
We built Netverge on the view that AIOps works when it sees the whole picture. That means monitoring, ticketing, documentation and automation in one platform, tied together by a knowledge graph so every alert arrives with its context. It also means physical visibility at the edge, which is why our Vergepoints sit alongside the software modules instead of being an afterthought.
Our AI agents are designed to diagnose and resolve issues, and we think autonomy should be earned in steps: observe first, recommend second, act within boundaries you set third. If you run an MSP or a multi-site network, the biggest gain is rarely a single clever model. It is removing the swivel-chair work between tools so your engineers spend their time on problems that need them.
Jim
See what a unified AIOps platform costs
Netverge brings monitoring, AI triage, documentation and autonomous agents into one platform for MSPs and multi-location enterprises. The Starter Package is $299 per month. Hardware Vergepoints are $49 per month per device, and Software Vergepoints are $29 per month per Vergepoint. Add-ons such as 100 additional monitoring sensors, 100 additional sites or 10 additional AI agents are each $100 per month per block. Full details are on the pricing guide, and the pricing calculator estimates your monthly total.
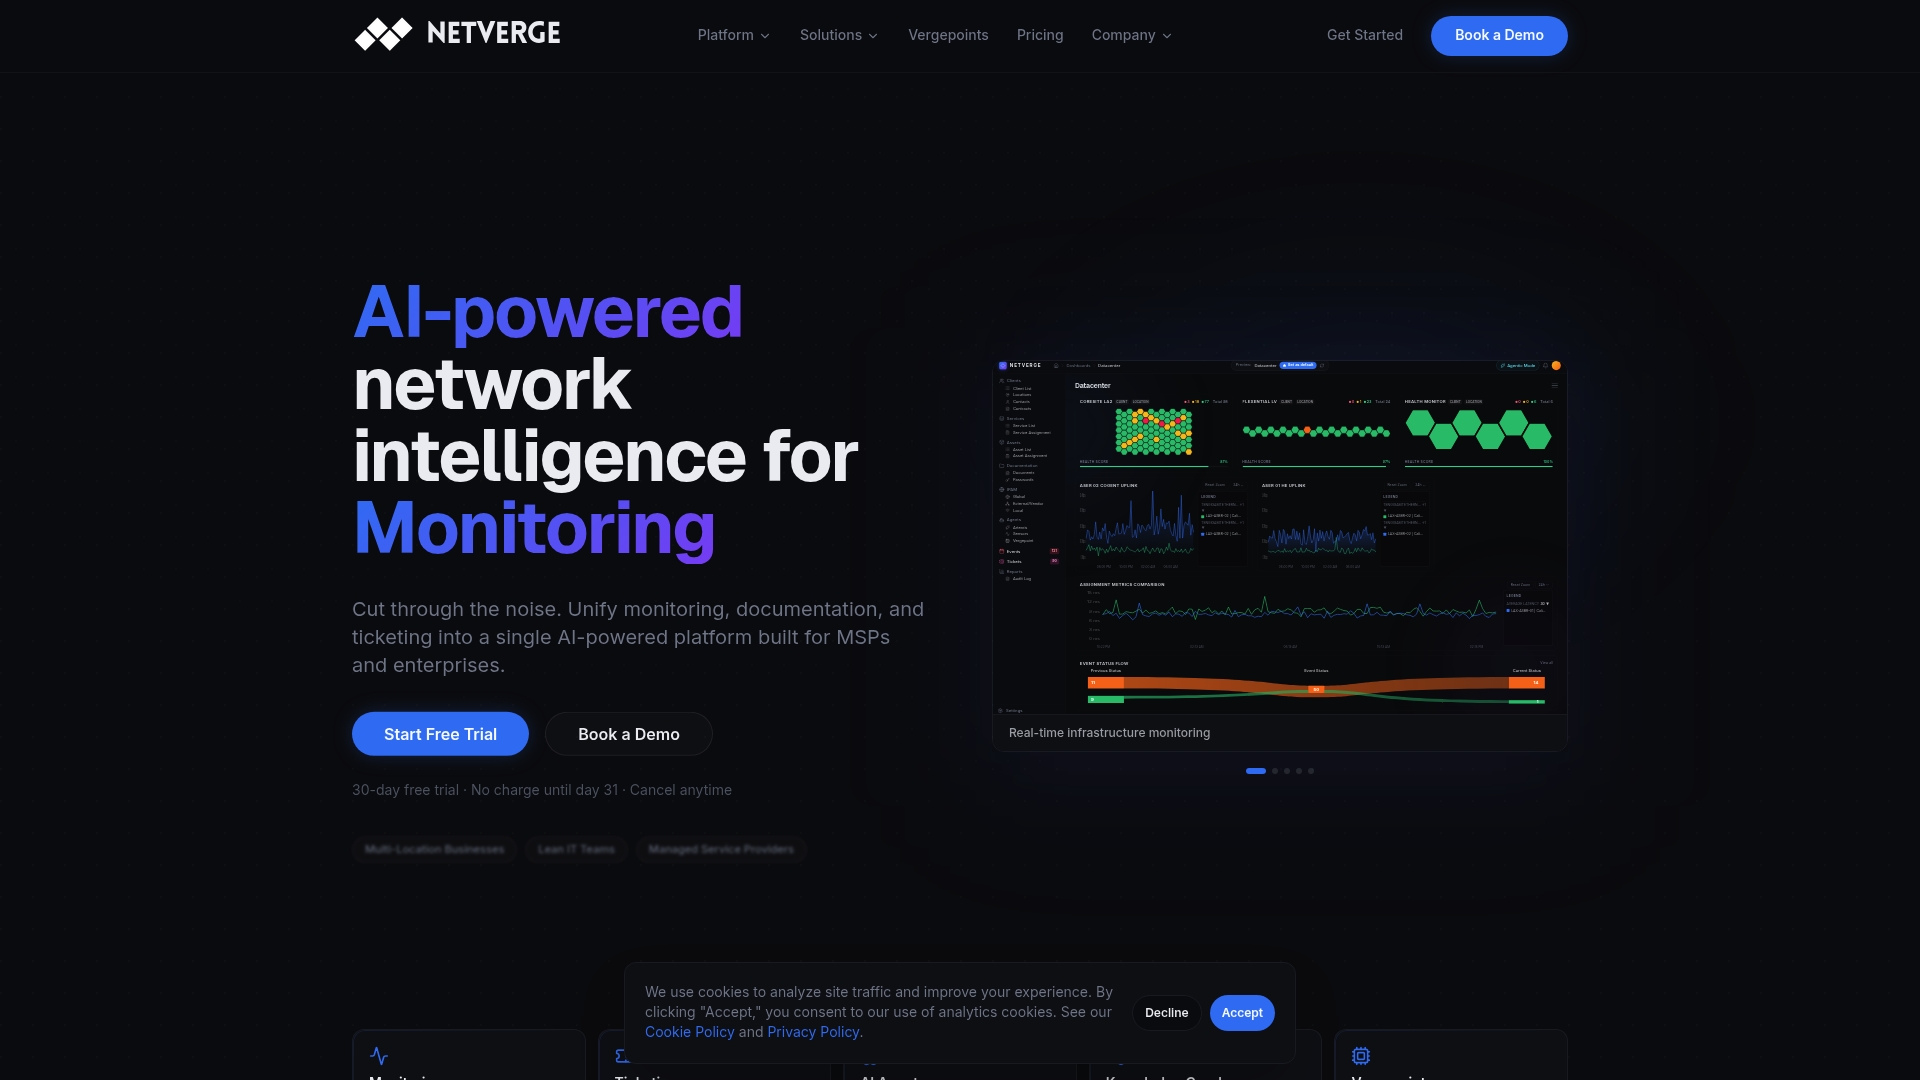
Ready to see these use cases on your own network? Start Free Trial or Request a Demo at netverge.com, or look at the AI network monitoring platform first.
FAQ
Is AIOps still relevant?
Yes. Networks, cloud services and ticket queues keep growing faster than teams do, and AIOps addresses that gap directly. The focus has shifted from dashboards that only report toward systems that correlate, diagnose and, within limits you set, act. Generative AI summaries and agent-based automation extend the same core idea.
What are the most common AIOps use cases?
Alert noise reduction, event correlation, root cause analysis, predictive analytics, capacity planning and incident response appear on nearly every list. For network and MSP teams, ticket triage and deduplication are close behind, because they remove repeated manual work.
What are the main benefits of AIOps?
The main benefits are faster detection and resolution, fewer redundant alerts and tickets, earlier warning of failures and less repetitive work for engineers. Measure them against your own baseline for MTTD, MTTR, alerts per incident and escalation rate.
How is AIOps different from traditional network monitoring?
Traditional monitoring checks values against fixed thresholds and sends an alert. AIOps learns normal behavior, groups related events, suggests root causes and can run approved workflows. It builds on monitoring data and does not replace the need for good sensors and coverage.
Can AIOps fix problems without human approval?
It can for low-risk, well-understood actions that you define in advance. For changes that can affect many users or sites, keep human approval in the loop and verify the outcome afterward.
Sources
- What is AIOps (artificial intelligence for IT operations), TechTarget
- What is AIOps? Benefits and use cases, Google Cloud
- Understanding AIOps, PagerDuty
- AIOps explained, Red Hat
- What is AIOps, Lenovo US
- The six strategic use cases for AIOps, IBM