Netverge Monitoring
Noisy monitoring gets ignored. That's a liability.
Replace noise with clarity, connect monitoring to operations, and save man-hours in the process.
Monitoring Sensors
Observability starts with sensors placed where it happens, powered by 4-Way Monitoring.
- Monitor infrastructure health
- Measure network paths
- Measure device resources
- Assess wired and wireless performance
- Simulate user experience
Unified Observability
Sensor data is automatically unified and correlated into a single operational view.
- Centralized telemetry ingestion
- Automatic event correlation
- Client and site context
- Service and asset association
- Time-aligned visibility
Sensor Catalog
28+ intelligent sensors to extend your Vergepoint capabilities. Each sensor provides specialized monitoring, automation, or data collection across your entire stack.
Featured Integrations

MerakiProbe
NetworkingPer-device Cisco Meraki monitoring via Dashboard API. Discover all devices in your organization and monitor with actionable metrics.

UniFiProbe
NetworkingPer-device Ubiquiti UniFi monitoring via the Site Manager API. Discover all sites and devices across your UniFi account.

FortiProbe
SecurityEnterprise Fortinet Security Fabric monitor. Discovers and monitors FortiGate firewalls, FortiAP access points, and FortiSwitch devices.

AWS EC2 Probe
CloudPer-instance Amazon EC2 monitoring via CloudWatch and EC2 API. Discover all instances and monitor with NOC/SOC-grade telemetry.
AWS Cost Monitor
CloudDaily AWS cost and usage analysis across your entire account with cost breakdowns by service, region, and usage type.

VMware vCenter Probe
VirtualizationPer-instance VMware virtual machine monitoring via the vSphere API. Discover all VMs and monitor with NOC/SOC-grade telemetry.
Full Catalog

APIEndpoint
WebGeneric REST API health sensor. Monitors HTTP/HTTPS endpoints with configurable method, headers, body, and authentication.

Azure Cost Monitor
CloudDaily Azure cost and usage analysis across your subscription. Provides a FinOps-grade dashboard with cost breakdowns by service and resource group.
Azure VM Probe
CloudPer-instance Azure Virtual Machine monitoring via Azure Monitor metrics and ARM API.

BGPProbe
TelecomMonitors BGP routing health: prefix visibility, AS path changes, route leak detection, and hijack detection.

CertWatch
SecurityMonitors SSL/TLS certificates for expiry, chain validity, cipher strength, OCSP status, and CT log presence.
CiscoIOSProbe
NetworkingMonitors Cisco IOS/IOS-XE devices via SSH with nto-templates structured parsing: interfaces, BGP, OSPF, HSRP, and config drift.

ConfigBackup
MonitoringVendor-agnostic network device configuration backup over SSH. Supports any CLI-accessible device: routers, switches, firewalls, and access points.
DNSWatch
NetworkingMonitors DNS health: resolution time, record accuracy, propagation consistency across resolvers, DNSSEC validation, and DNS hijacking detection.

LinuxProbe
MonitoringEnterprise Linux system health sensor. Collects CPU, memory, disk, network, processes, systemd services, and security posture.

M365 Watch
CloudMicrosoft 365 tenant health, service incidents, identity security posture, mail flow, and license management sensor.

MikroBackup
NetworkingBacks up MikroTik router configuration and key command outputs over SSH.
APIEndpoint
WebGeneric REST API health sensor. Monitors HTTP/HTTPS endpoints with configurable method, headers, body, and authentication.
Azure Cost Monitor
CloudDaily Azure cost and usage analysis across your subscription. Provides a FinOps-grade dashboard with cost breakdowns by service and resource group.
Azure VM Probe
CloudPer-instance Azure Virtual Machine monitoring via Azure Monitor metrics and ARM API.
BGPProbe
TelecomMonitors BGP routing health: prefix visibility, AS path changes, route leak detection, and hijack detection.
CertWatch
SecurityMonitors SSL/TLS certificates for expiry, chain validity, cipher strength, OCSP status, and CT log presence.
CiscoIOSProbe
NetworkingMonitors Cisco IOS/IOS-XE devices via SSH with nto-templates structured parsing: interfaces, BGP, OSPF, HSRP, and config drift.
ConfigBackup
MonitoringVendor-agnostic network device configuration backup over SSH. Supports any CLI-accessible device: routers, switches, firewalls, and access points.
DNSWatch
NetworkingMonitors DNS health: resolution time, record accuracy, propagation consistency across resolvers, DNSSEC validation, and DNS hijacking detection.
LinuxProbe
MonitoringEnterprise Linux system health sensor. Collects CPU, memory, disk, network, processes, systemd services, and security posture.
M365 Watch
CloudMicrosoft 365 tenant health, service incidents, identity security posture, mail flow, and license management sensor.
MikroBackup
NetworkingBacks up MikroTik router configuration and key command outputs over SSH.
MikroTikProbe
NetworkingMonitors MikroTik RouterOS devices via SSH: interfaces, routing (BGP/OSPF), firewall, NAT, IPsec, netwatch, SLA ping, and hardware health.

NVScan
SecurityEnterprise-grade deep vulnerability scanner with full OpenVAS/GVM stack and Nmap integration. Provides comprehensive vulnerability assessment.

Path Probe
NetworkingMeasures reachability and simple latency to a target.

ServicePort
MonitoringMonitors TCP/UDP service availability: port reachability, connection time, TLS handshake time, banner grabbing, and response validation.

SNMP Scout
NetworkingCollects device metrics and inventory via SNMP v2c/v3.

TechMate
NetworkingEnterprise-grade network and system diagnostics agent with comprehensive WiFi scanning, performance metrics, and categorized reporting.

VersaPathProbe
NetworkingRuns path probes against Internet via Versa SD-WAN device VNI.

WebHealth
WebEnterprise-grade website performance monitoring with Core Web Vitals, frame-by-frame capture, QoE metrics, and bottleneck analysis.

WiFi Health
NetworkingMonitors WiFi connection health, including signal strength and bitrate.

Windows Server Probe
MonitoringWindows Server health and compatibility sensor over WinRM. Collects OS compatibility, CPU/memory/disk usage, and system information.

WTI4GMonitor
NetworkingMonitors WTI 4G routers for connectivity, signal, usage, and latency.
MikroTikProbe
NetworkingMonitors MikroTik RouterOS devices via SSH: interfaces, routing (BGP/OSPF), firewall, NAT, IPsec, netwatch, SLA ping, and hardware health.
NVScan
SecurityEnterprise-grade deep vulnerability scanner with full OpenVAS/GVM stack and Nmap integration. Provides comprehensive vulnerability assessment.
Path Probe
NetworkingMeasures reachability and simple latency to a target.
ServicePort
MonitoringMonitors TCP/UDP service availability: port reachability, connection time, TLS handshake time, banner grabbing, and response validation.
SNMP Scout
NetworkingCollects device metrics and inventory via SNMP v2c/v3.
TechMate
NetworkingEnterprise-grade network and system diagnostics agent with comprehensive WiFi scanning, performance metrics, and categorized reporting.
VersaPathProbe
NetworkingRuns path probes against Internet via Versa SD-WAN device VNI.
WebHealth
WebEnterprise-grade website performance monitoring with Core Web Vitals, frame-by-frame capture, QoE metrics, and bottleneck analysis.
WiFi Health
NetworkingMonitors WiFi connection health, including signal strength and bitrate.
Windows Server Probe
MonitoringWindows Server health and compatibility sensor over WinRM. Collects OS compatibility, CPU/memory/disk usage, and system information.
WTI4GMonitor
NetworkingMonitors WTI 4G routers for connectivity, signal, usage, and latency.
Sensors in Action
Meraki switches, Fortinet firewalls, Linux servers, cloud costs, SSL certificates. Every sensor delivers rich, actionable data in a unified interface.
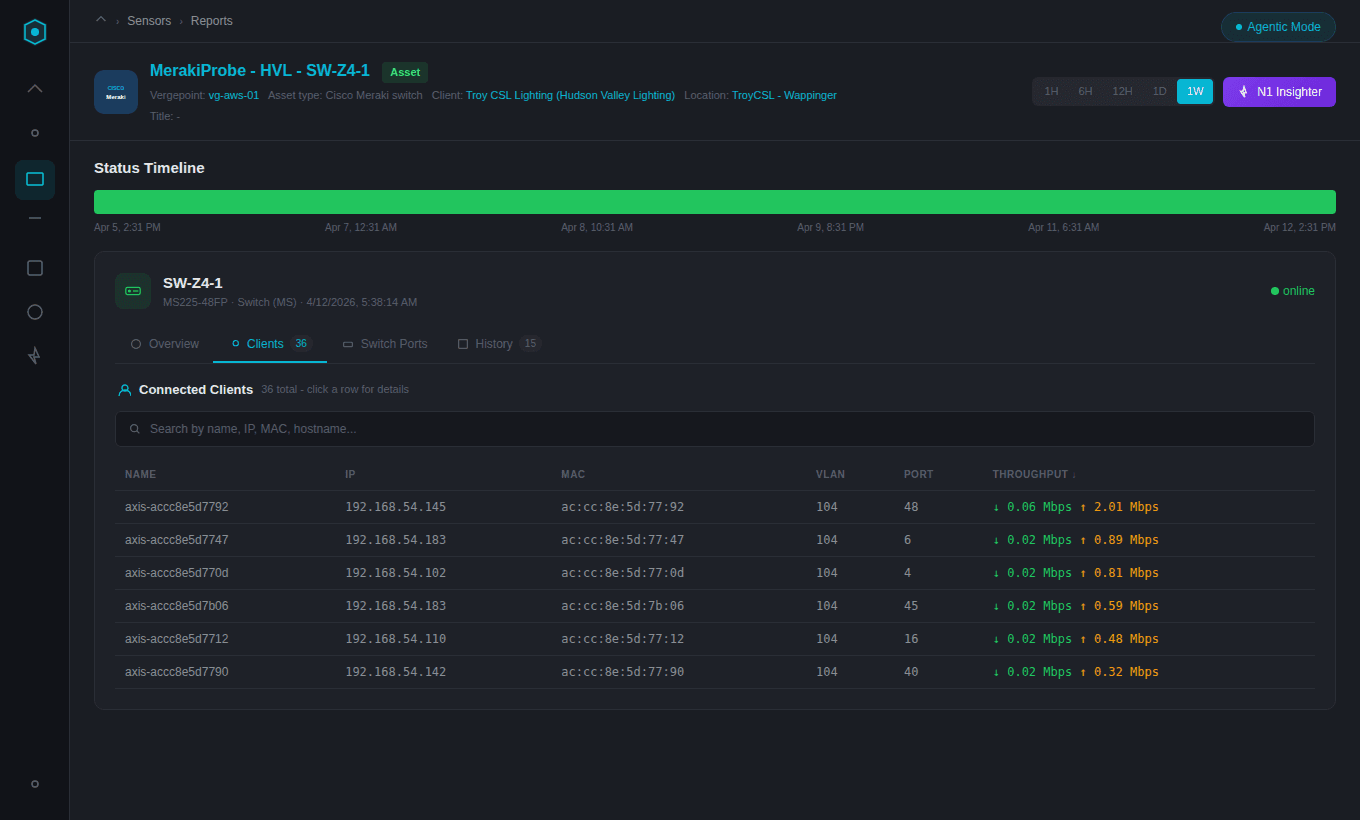
MerakiProbe
MerakiProbe gives per-device Cisco Meraki monitoring with connected clients, switch ports, throughput, and device inventory.
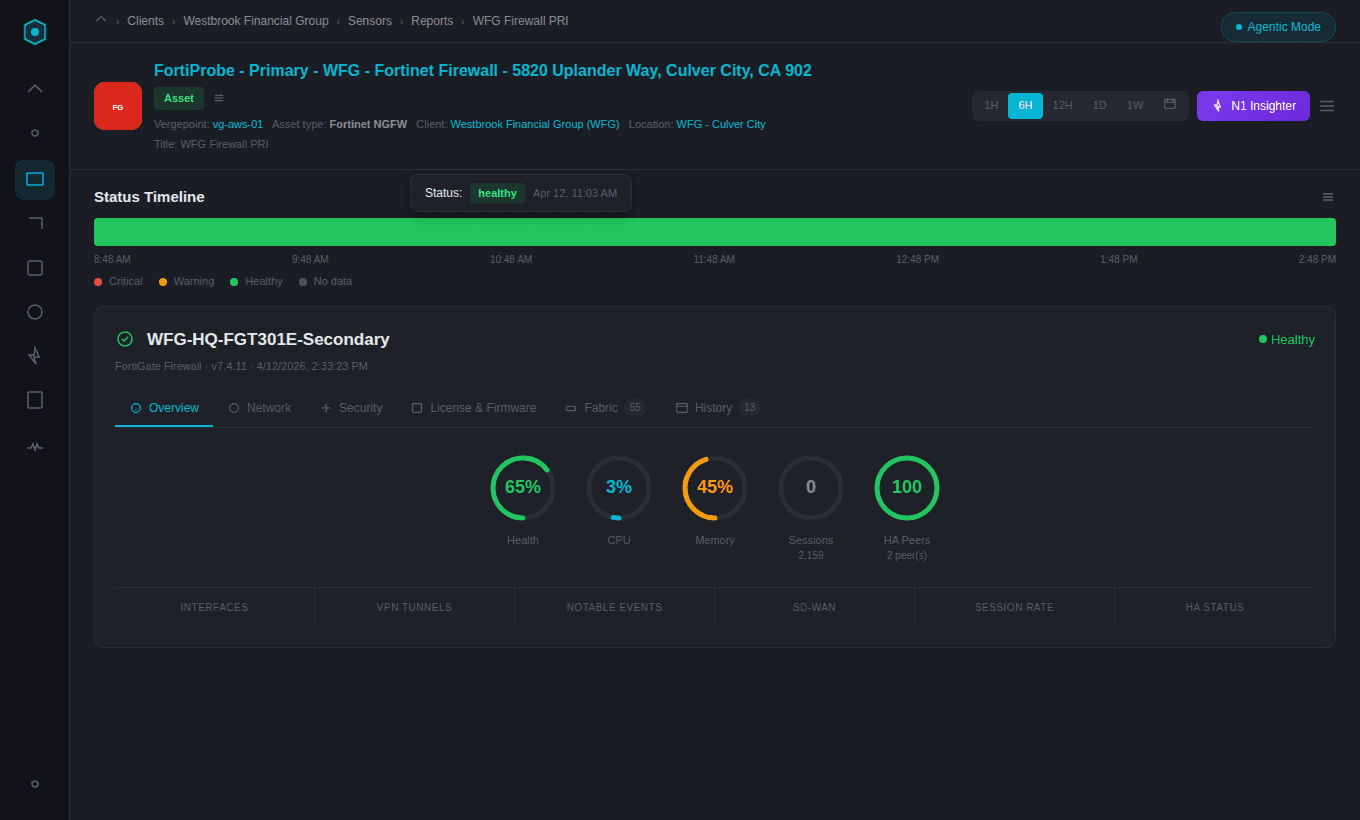
FortiProbe Overview
FortiProbe monitors FortiGate firewalls with health scores, CPU, memory, sessions, HA peers, and Security Fabric visibility across all connected devices.
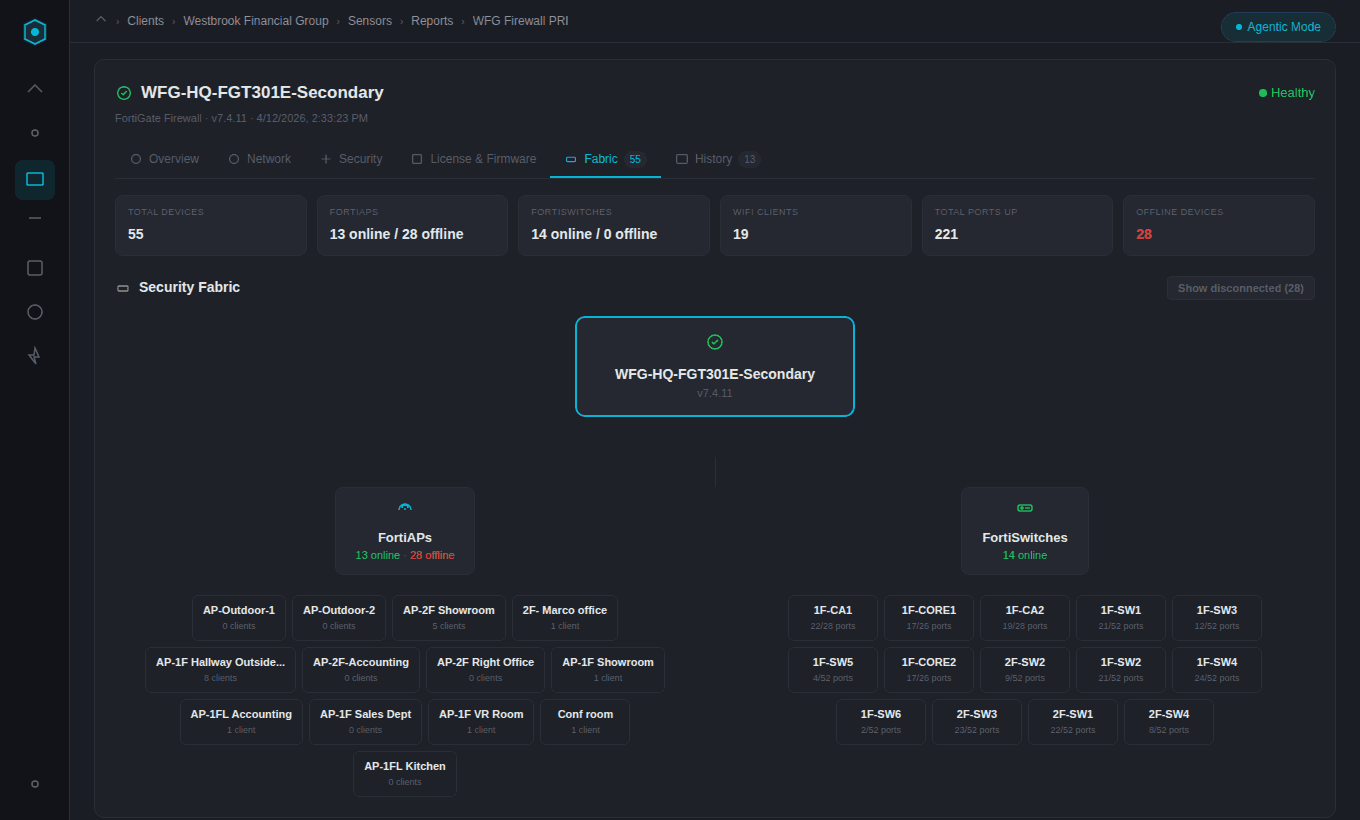
FortiProbe Security Fabric
Security Fabric view maps your entire Fortinet infrastructure - FortiGate, FortiAPs, and FortiSwitches with client counts and port utilization.
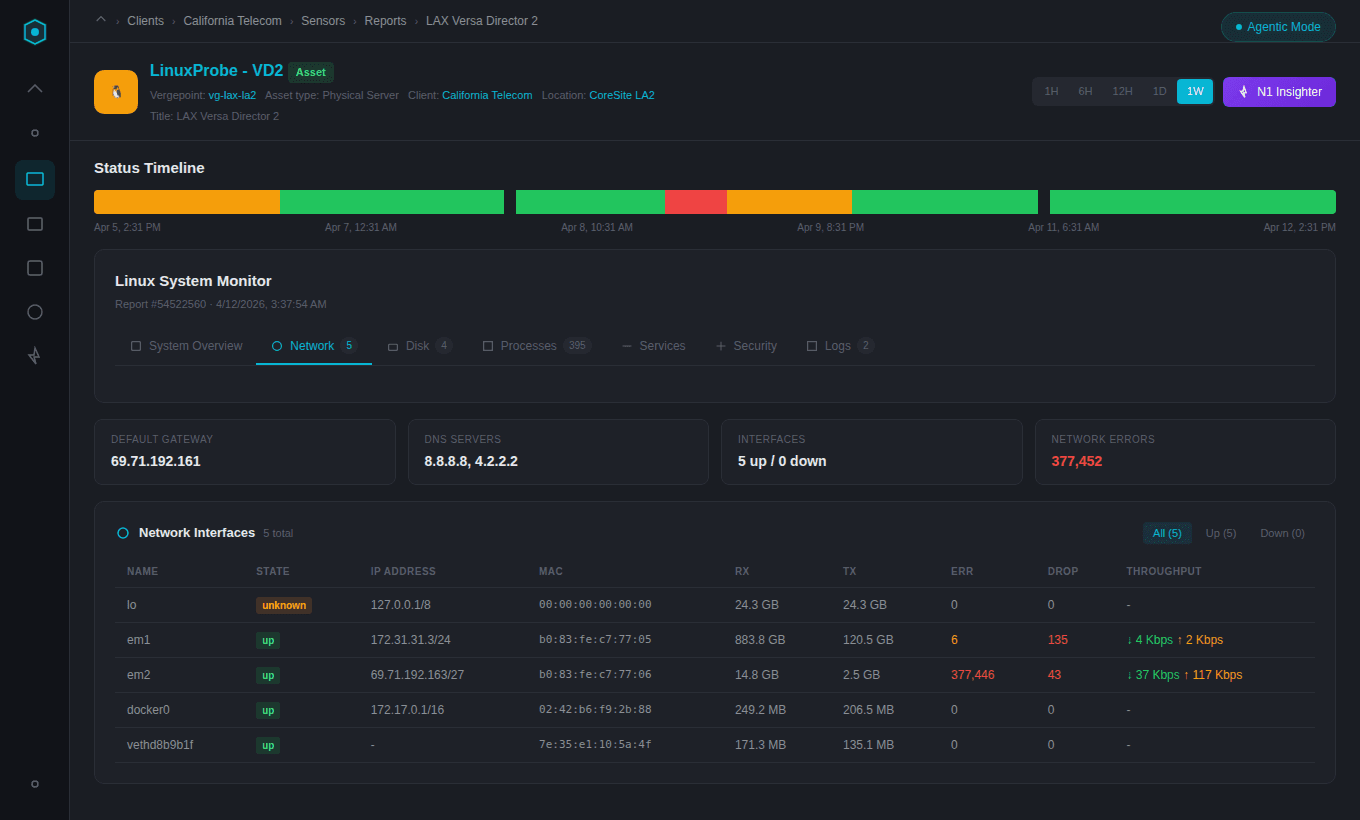
Linux System Monitor
Deep visibility into Linux server health: CPU, memory, swap, disk usage, running processes, and system logs. All metrics scored and tracked over time.
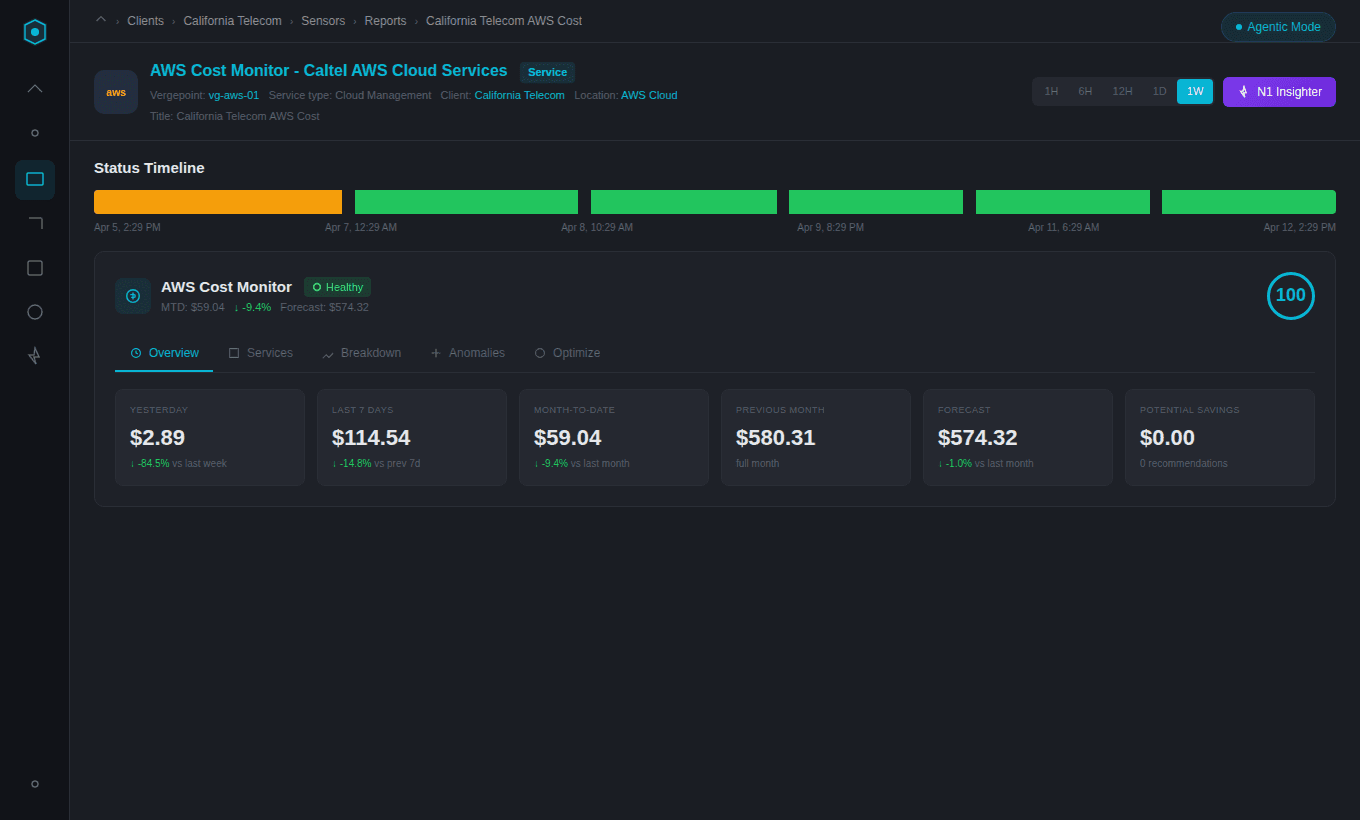
AWS Cost Monitor
Track cloud spend across AWS services with month-to-date totals, forecasts, cost trends, and per-service breakdowns. Detect anomalies before they become budget surprises.
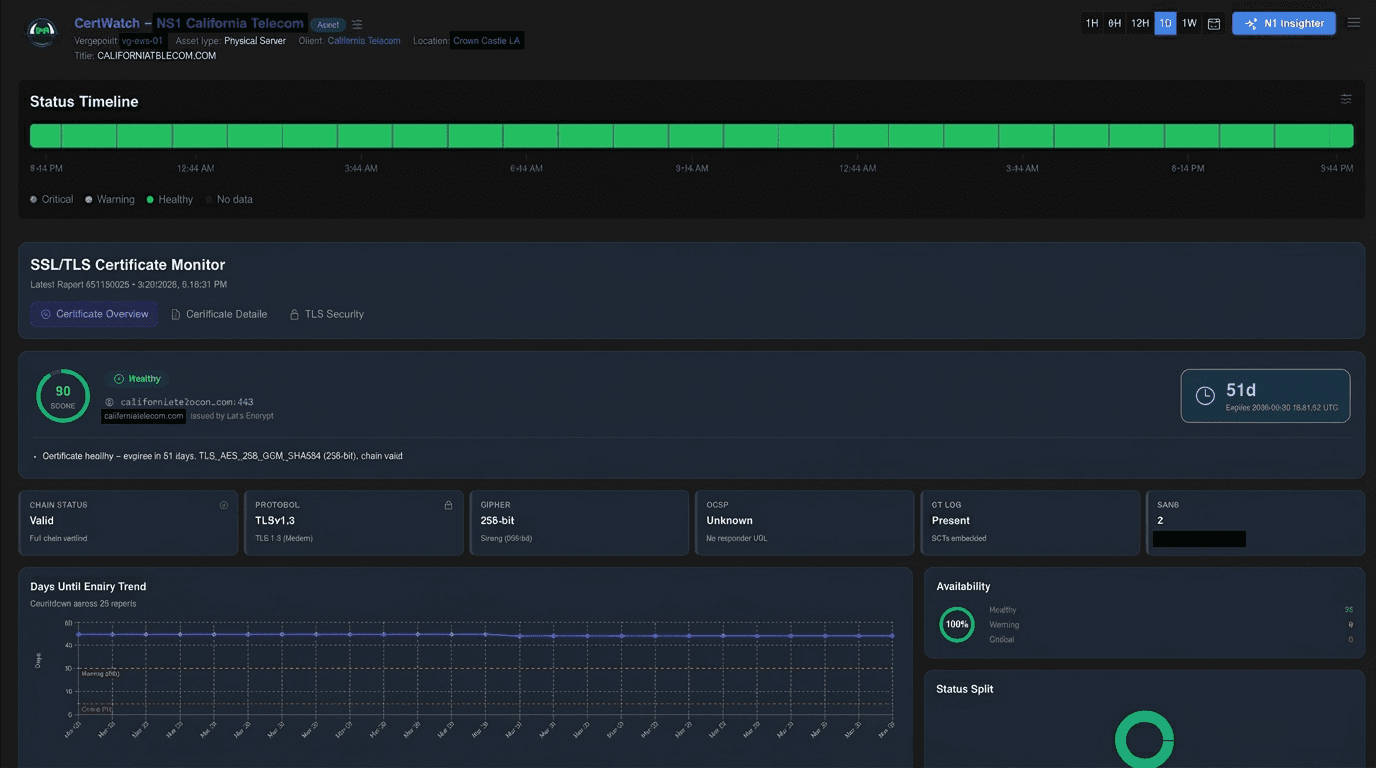
SSL/TLS Certificate Monitor
Automated certificate health checks with expiry countdowns, chain validation, TLS protocol and cipher details, and historical availability tracking.
Path Monitoring & Event Triage
Monitor network paths with latency, packet loss, and jitter metrics. When thresholds are breached, events are automatically triaged and escalated.
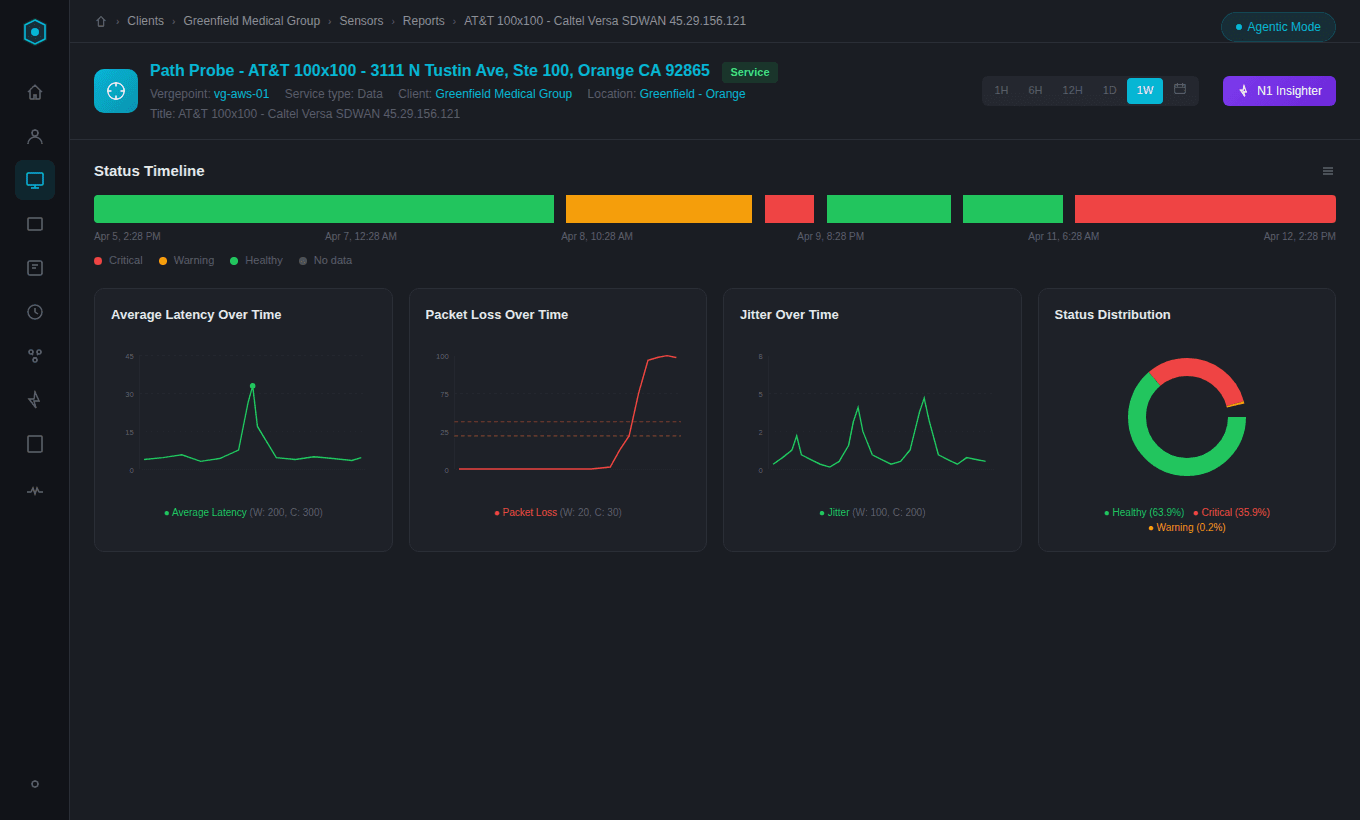
Path Probe Overview
Status timeline with latency, packet loss, jitter trends, status distribution, and correlated event history, all from a single path sensor.
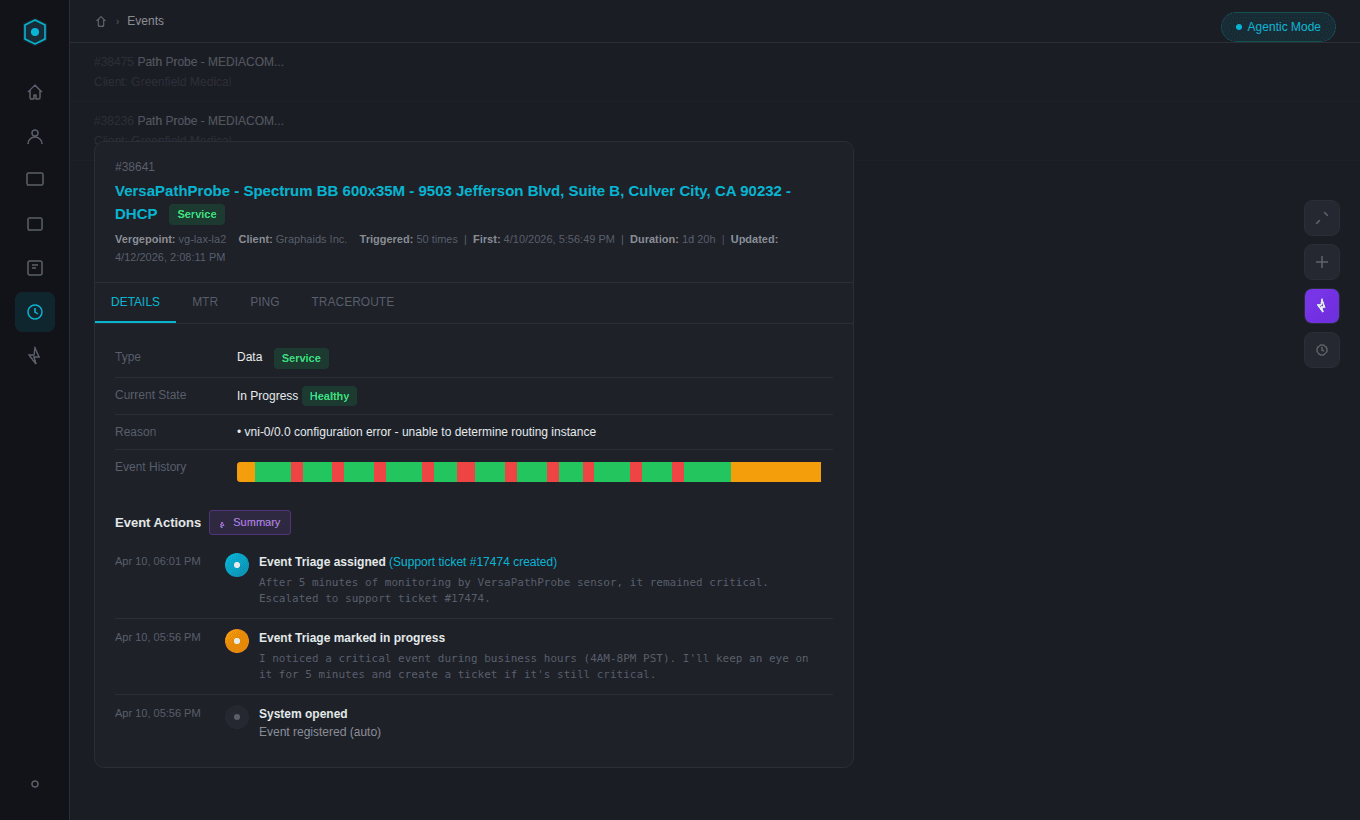
Automated Event Triage
AI-powered Event Triage monitors critical events, creates support tickets after sustained issues, and documents every action taken. Fully automated.
Event Management
Event history with workflow phases, ticket actions, and ownership. Every event is tracked, correlated, and connected to the right context automatically.
Workflow Phases
Track events through their complete lifecycle with clear status indicators.
Ticket Actions
Automatically create and associate tickets from monitoring events.
Ownership Tracking
Clear ownership and accountability for every event and resolution.
Ready to Experience the Future of Network Operations?
Start Using Netverge
30-day free trial · No charge until day 31 · Cancel anytime