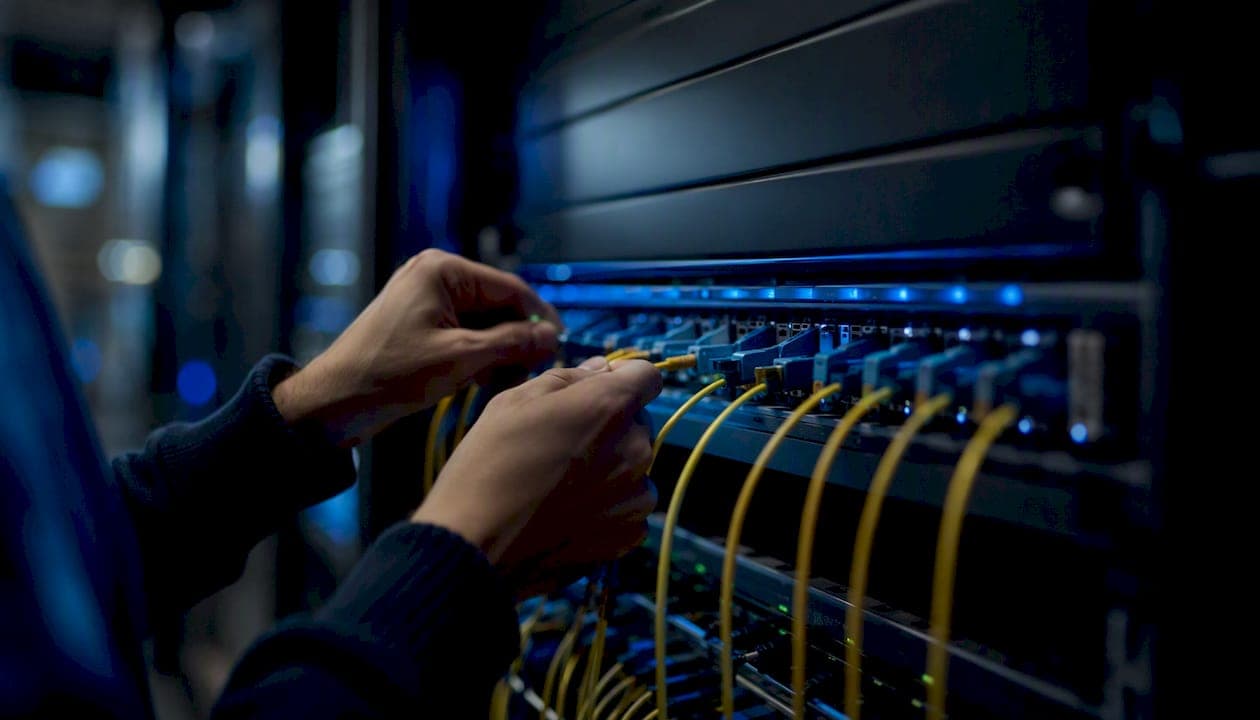
AI network monitoring, formally called AINetOps, automates telemetry correlation, anomaly detection, and closed-loop remediation so your team identifies and resolves root causes faster than any threshold-based system can. The practical payoff is immediate: alert volumes compress, mean time to repair (MTTR) drops, and predictive assurance catches degradation before users notice it. For a deeper look at why AI monitoring matters now, the operational case is clear.
Before reading further, two actions will set you up for success:
- Verify telemetry coverage: Confirm that flow data, SNMP/streaming telemetry, logs, and topology feeds are all reachable from a central ingestion point.
- Pick one pilot domain: Choose a bounded segment (wireless, a single WAN region, or a cloud-native workload) where you can measure MTTR and alert volume before and after.
Key Takeaways
AI network monitoring delivers its clearest ROI when telemetry coverage is complete, data governance is enforced from day one, and pilots are scoped to a single domain with defined MTTR and alert-volume baselines.
| Point | Details |
|---|---|
| Prioritize telemetry first | Audit and synchronize all telemetry sources before deploying any model or agent. |
| Pilot in a bounded domain | Scope the first deployment to one segment and measure MTTR and alert volume weekly. |
| Alarm compression is measurable | Production deployments like Cirion's show roughly 90–92% alarm-noise reduction with agentic correlation. |
| Keep humans in the loop | Use advisory mode for high-impact actions until the model has sufficient labeled outcomes to justify closed-loop trust. |
| Netverge as your AINetOps platform | Netverge unifies telemetry, AI triage, knowledge graphs, and Vergepoints edge hardware into one platform for MSPs and enterprises. |
Table of Contents
- How does AI network monitoring actually work?
- How AI-driven monitoring differs from traditional threshold-based monitoring
- What operational benefits and use cases justify an AINetOps pilot?
- How should you implement AI network monitoring in phases?
- What are the real risks and limitations of AI network monitoring?
- Where is AINetOps headed in the next 12–36 months?
- Standards and resources worth reading
- What practitioners actually learn from AINetOps deployments
- Netverge gives your team a complete AINetOps starting point
- Sources
How does AI network monitoring actually work?
The intelligence in an AINetOps system lives across four layers: collection, enrichment, model runtime, and action.
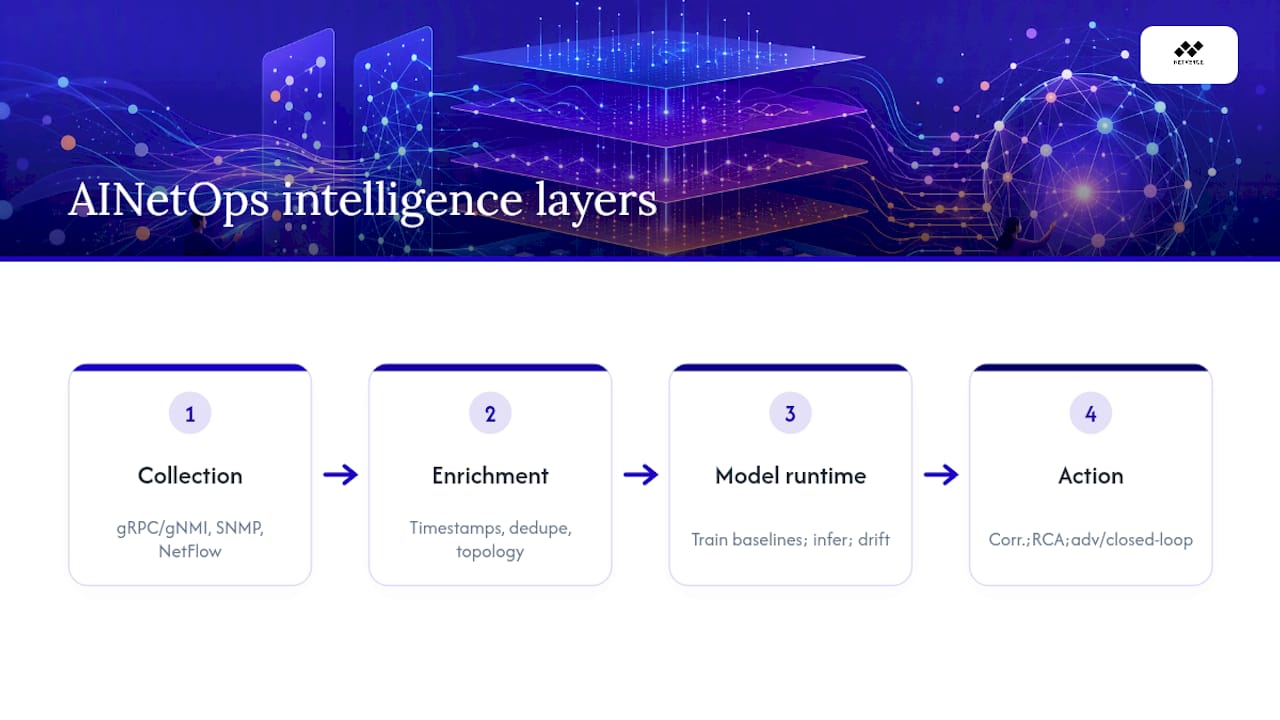
Data pipeline. Telemetry sources include streaming protocols (gRPC/gNMI), SNMP, NetFlow/IPFIX, syslog, SNMP traps, synthetic probes, and API-based cloud metrics. Raw streams feed an ingestion layer that normalizes timestamps, deduplicates events, and enriches records with topology context from a CMDB or knowledge graph. Network comprehension research underscores why protocol-aware and topology-aware enrichment is non-negotiable: models that lack topology context misattribute symptoms to the wrong device.
Model lifecycle. Models train on historical telemetry to establish dynamic baselines per device, interface, and traffic class. Once deployed, they run online inference against live streams, flagging deviations that exceed learned normal ranges rather than static thresholds. Drift detection routines monitor whether incoming data distributions have shifted enough to require retraining, a step many teams skip until model accuracy visibly degrades.
Operational components. A correlation engine groups related alarms into a single incident, an RCA engine traces the incident back to a probable cause across layers, and automation agents act on the verdict. Agents operate in two modes: advisory (surface a recommendation for analyst approval) or closed-loop (execute a remediation action automatically within a defined policy boundary). The IETF/IRTF AINetOps draft formalizes four use-case categories: reactive troubleshooting, proactive assurance, closed-loop optimization, and misconfiguration detection, each requiring progressively richer cross-layer telemetry.
Where to place intelligence. Edge agents handle local anomaly scoring and pre-filtering to reduce backhaul. Control-plane inference handles routing and policy decisions. A centralized correlation layer aggregates cross-domain incidents and drives ticketing.
Pro Tip: Supplement real telemetry with synthetic transactions on critical paths. Synthetic probes catch user-experience degradation before any device metric crosses a threshold, giving your models an early-warning signal that passive collection alone cannot provide.
How AI-driven monitoring differs from traditional threshold-based monitoring
Traditional monitoring fires an alert every time a metric crosses a fixed value. AI-driven monitoring learns what "normal" looks like for each device and traffic pattern, then flags meaningful deviations. The operational gap between the two is significant.
| Capability | Threshold-based monitoring | AI-driven monitoring |
|---|---|---|
| Anomaly detection | Static high/low thresholds per metric | Dynamic baselines per device, time-of-day, and traffic class |
| Alert volume | High; every threshold breach fires | Compressed; correlated into incidents |
| False-positive rate | High; seasonal or bursty traffic triggers noise | Lower; context-aware correlation filters transient spikes |
| RCA speed | Manual correlation across tools | Automated cross-layer RCA in minutes |
| SLA enforcement | Reactive; breach detected after the fact | Proactive; degradation predicted before breach |
| Analyst workflow | Triage hundreds of individual alarms | Review a handful of prioritized incidents |
Consider a concrete scenario: a fiber cut on an upstream link generates hundreds of downstream device alarms in a threshold-based NOC. Analysts spend 30–45 minutes correlating tickets before isolating the cause. An AI-driven system correlates those alarms in seconds, identifies the common upstream element, and either opens a single prioritized ticket or triggers an automated failover, depending on policy.
The key evaluation criterion for any detected anomaly: Is it actionable? An anomaly is actionable when it maps to a specific device or path, carries a probable cause, and has a defined remediation step. AI systems that surface anomalies without those three attributes add noise, not value.
What operational benefits and use cases justify an AINetOps pilot?
The ROI case for AI-based network monitoring is strongest in environments where alert volume is high and MTTR is a tracked SLA metric. Agentic AIOps deployments can deliver faster ROI than most other AI initiatives precisely because alarm correlation produces immediate, measurable relief for NOC teams.
The table below maps each use case to its primary metric and a real operator reference.
| Use case | Primary metric | Operator reference |
|---|---|---|
| Alarm-noise compression | Alert volume reduction | Cirion: very high alarm compression in production |
| Root-cause identification | MTTR | C Spire: measurable MTTR/MTTD improvement |
| Routine data retrieval | Engineer-hours saved | Swisscom: ~10% reduction in routine retrieval time per engineer |
| Predictive maintenance | Incidents prevented | Proactive assurance before SLA breach |
| Security/threat detection | Detection latency | Cross-layer anomaly flags on lateral movement |
| Capacity planning | Utilization forecasting | Trend-based provisioning before congestion |
Cirion's production deployment of agentic AIOps across its Latin America network achieved roughly 90–92% alarm-noise compression, letting operators focus on root causes rather than thousands of individual alerts. C Spire built four specialized agents (knowledge, weather, alarm, and supervisor) in about eight weeks and reported measurable improvements in detection and diagnosis times. Swisscom's RAG-based network assistant, built on Amazon Bedrock with a multi-agent architecture, cut routine data-retrieval time by roughly 10% per engineer.
Which use case to pilot first? In wireless-heavy environments, start with anomaly detection on AP and controller telemetry. In IP/optical networks, alarm correlation across layers produces the fastest visible compression. In cloud-native workloads, focus on flow-based threat detection and latency SLA assurance.
How should you implement AI network monitoring in phases?
A phased rollout reduces integration risk and gives you measurable checkpoints. Practical deployment examples show that teams who scope their pilot tightly and define success metrics upfront consistently outperform those who try to instrument everything at once.
Phase 1: Discovery and inventory (weeks 1–4)
Audit all telemetry sources. Confirm streaming telemetry, flow exports, and log forwarding are active and timestamp-synchronized. Map topology in your CMDB or knowledge graph. Identify gaps: devices with no flow export, segments with no synthetic probe coverage.
Phase 2: Pilot in a bounded domain (weeks 5–12)
Deploy agents or analytics in one domain. Connect to your ticketing system and CMDB. Run in advisory mode only. Track MTTR, alert volume, and false-positive rate weekly. Validate that ingestion is synchronized with production logging before expanding.
Phase 3: Expand and automate (months 4–12)
Extend to additional domains. Introduce closed-loop remediation for low-risk, well-understood actions (interface bounce, route failover) with explicit approval gates. Update runbooks to reflect AI-assisted workflows.
Data governance essentials. Telemetry fidelity, timestamp synchronization, and topology accuracy are the three variables that most directly determine model output quality. Labeling historical incidents in your ticketing system gives supervised models ground truth for RCA training. Integration risk is a primary bottleneck: AI outputs degrade when ingestion and synchronization with production logging, ticketing, and CMDB systems are not addressed early.
ROI metrics to track. During the pilot: MTTR per incident type, alert volume per shift, and false-positive rate. In steady state: incidents per week, engineer-hours saved on triage, and SLA breach frequency. These six metrics give you a defensible business case for expanding the program.
Organizational changes. NOC analysts shift from alarm triage to incident review and policy governance. Define approval gates for every automated remediation action. Document escalation paths for cases where the AI recommendation is uncertain or the blast radius is high.
What are the real risks and limitations of AI network monitoring?
AI-based monitoring introduces a new class of operational risk alongside its benefits. Planning for these pitfalls before deployment is far less costly than discovering them in production.
- Model drift: Data distributions shift as the network evolves. Without continuous validation, a model trained six months ago may baseline the wrong "normal." Schedule periodic retraining and monitor inference accuracy against labeled incidents.
- Poor data quality: Gaps in telemetry coverage, unsynchronized timestamps, or stale topology data produce unreliable outputs. Invest in data governance before model deployment, not after.
- Explainability gaps: Black-box models make it hard for analysts to trust or override a recommendation. Prefer models that surface contributing features alongside their verdict, and always maintain a human-in-the-loop gate for high-impact actions.
- False positives and negatives: AI systems reduce false positives compared to threshold-based tools, but they do not eliminate them. A false negative (missed incident) in a security context carries serious consequences. Tune sensitivity thresholds per use case and track both error types.
- Vendor lock-in: Proprietary telemetry formats and closed model APIs make migration expensive. Favor platforms that support open telemetry standards (OpenTelemetry, gNMI) and expose model outputs via documented APIs.
- Security and privacy exposures: Telemetry streams contain sensitive traffic metadata. Apply role-based access controls to ingestion pipelines and model outputs. Audit who can query raw telemetry versus aggregated incidents.
- Integration risk: Synchronized ingestion from existing logging, CMDB, and ticketing systems is the most common early failure point. Validate end-to-end data flow in a staging environment before going live.
Where is AINetOps headed in the next 12–36 months?
The trajectory is toward greater autonomy and natural-language control. Four trends are worth tracking now:
- Agentic and multi-agent workflows: Specialized agents (alarm, knowledge, environmental, supervisor) coordinate to handle complex incidents that span multiple domains. C Spire's four-agent NOC architecture is an early production example of this pattern.
- Natural-language intent layers: The ETSI whitepaper on autonomous networks describes multi-agent and intent-based abstractions that let engineers express business goals ("optimize for video traffic") and have the system translate them into technical configurations, reducing manual error.
- Cross-layer IP/optical correlation: Closed-loop optimization across IP and optical layers is an active IETF/IRTF focus area. Expect vendor support to mature within 18–24 months.
- Automated provisioning and self-healing: Fully autonomous remediation for a defined class of incidents is the near-term target for operators already running closed-loop pilots.
Planning recommendation: Pilot agentic alarm correlation and advisory RCA now. Monitor vendor roadmaps for natural-language intent interfaces and cross-layer closed-loop capabilities, and plan architecture to support open telemetry standards so you are not locked out when those features arrive. For a broader view of where the industry is moving, network monitoring trends for 2026 covers the roadmap in detail.
Standards and resources worth reading
These primary sources validate the technical and operational approaches described throughout this article.
- IETF/IRTF AINetOps use cases draft: The authoritative taxonomy of AINetOps use cases and cross-layer telemetry requirements. Read this before scoping your pilot to align terminology with the standards community.
- ETSI whitepaper on AI in autonomous networks: Covers multi-agent architectures, intent-based abstractions, and autonomy levels. Useful for architecture planning and vendor evaluation.
- Cirion agentic AIOps case study: Production deployment with measured alarm compression. Read for realistic expectations on what agentic correlation delivers at scale.
- C Spire NOC agentic AI deployment: Eight-week build of a four-agent NOC system with measured MTTR/MTTD outcomes. Read for architecture patterns and build-vs-buy framing.
- Swisscom network assistant on Amazon Bedrock: RAG and multi-agent implementation with quantified engineer time savings. Read for practical integration patterns.
- TechTarget: benefits and challenges of AI network monitoring: Balanced practitioner overview of data quality, integration, and false-positive risks. Good pre-pilot reading for NOC managers.
- CableLabs: network comprehension and AI: Explains why protocol-level and topology-aware models outperform metric-only approaches. Read when evaluating model architecture choices.
What practitioners actually learn from AINetOps deployments
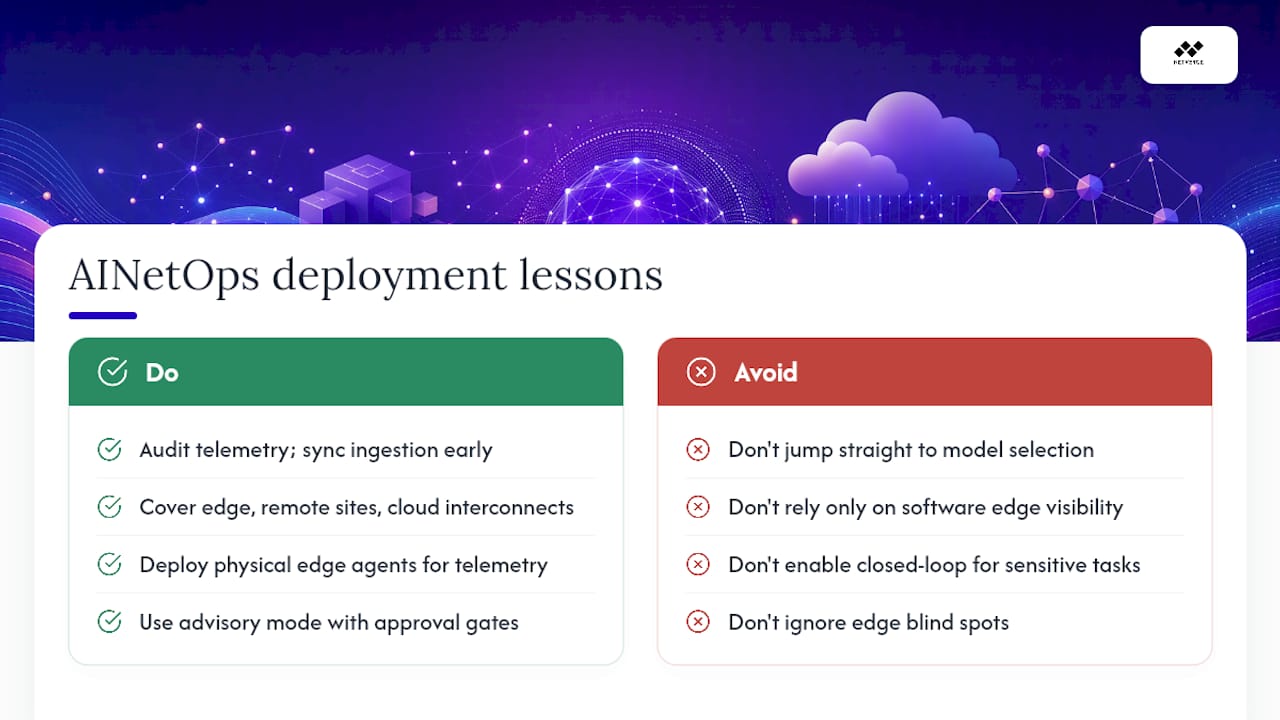
The gap between a proof-of-concept and a production AINetOps system almost always comes down to data governance, not model sophistication. Teams that spend the first four weeks auditing telemetry coverage and synchronizing ingestion pipelines consistently reach useful model outputs faster than teams that jump straight to model selection.
A pattern that appears repeatedly across deployments: organizations instrument the core of their network well but leave edge segments, remote sites, and cloud interconnects as blind spots. When an incident originates in one of those gaps, the AI system surfaces a symptom at the nearest instrumented point rather than the actual root cause. Physical edge visibility, through on-site hardware agents that collect local telemetry before forwarding it upstream, closes that gap in a way that purely software-based approaches cannot.
The human-in-the-loop question also deserves more attention than most vendor documentation gives it. Closed-loop remediation is genuinely valuable for well-understood, low-blast-radius actions. For anything that touches routing policy, security rules, or customer-facing services, advisory mode with a defined approval gate is the right operating posture, at least until the model has accumulated enough labeled outcomes to earn broader trust. For a practical guide to AI-powered infrastructure troubleshooting, the human-in-the-loop controls described there map directly to what production deployments require.
Netverge gives your team a complete AINetOps starting point
Netverge consolidates the telemetry collection, AI-driven correlation, and automated ticketing that the implementation phases above require into a single platform built for MSPs and multi-location enterprises. Where many teams spend months stitching together separate monitoring, documentation, and ticketing tools, Netverge delivers them as an integrated system from day one.

Key capabilities mapped to the deployment phases covered earlier:
- Telemetry consolidation: 28+ intelligent sensors plus Vergepoints edge hardware for physical on-site visibility at remote and branch locations.
- AI-driven triage and RCA: Autonomous agents diagnose issues and surface root causes with context from a built-in knowledge graph.
- Automated ticketing: Incidents route and prioritize automatically, cutting the manual triage load that consumes NOC capacity.
- Multi-tenant management: Role-based access and tenant isolation for MSPs managing multiple client environments.
Teams that deploy Netverge measure outcomes in the same terms this article recommends tracking: alert volume per shift, MTTR per incident type, and engineer-hours recovered from triage. See the full platform on the Netverge monitoring page and request a demo to evaluate it against your pilot scope.
Sources
- AI for Network Operations (AINetOps) use cases (IETF draft)
- Cirion turns agentic AI to optimize its Latin America network
- The benefits and challenges of AI in network monitoring | TechTarget
- Transforming network operations with AI: How Swisscom built a network assistant using Amazon Bedrock | Artificial Intelligence