
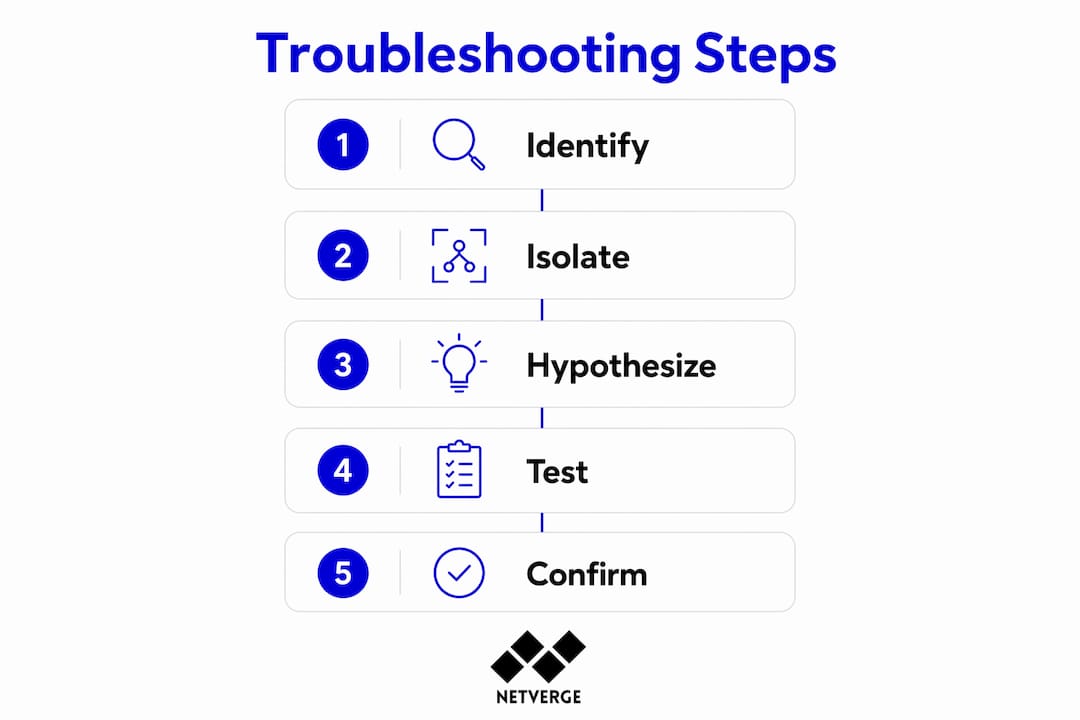
Step by step network troubleshooting is a structured, layered diagnostic methodology that guides IT professionals through a defined sequence of checks to isolate and resolve network faults with precision. The industry standard framework for this process is the OSI model, which maps seven distinct layers from physical cabling to application behavior. The seven-step fault isolation process is recognized as best practice across enterprise and managed service environments. Following this method reduces downtime, prevents guesswork, and gives technicians a repeatable process that holds up under pressure. Common failure causes including misconfigured IPs, failed interfaces, routing errors, and firewall blocks all yield to this systematic approach.
What are the essential prerequisites and tools for network troubleshooting?
Effective network diagnosis starts before you run a single command. You need current network diagrams, recent change logs, and confirmed access permissions before touching any device. Without a baseline, you cannot tell whether a metric is abnormal. Documentation and baseline reuse directly improves future troubleshooting efficiency and supports escalation when a fix is not straightforward.
The core diagnostic toolkit every technician needs includes:
- ping: Tests basic IP reachability between two endpoints. Use it to confirm whether a host responds before investigating further.
- traceroute / tracert: Maps the hop-by-hop path packets take to a destination. Reveals where in the network a failure or delay occurs.
- nslookup / dig: Resolves DNS queries. Confirms whether name resolution is working or failing at a specific server.
- ipconfig / ifconfig: Displays local IP configuration including address, subnet mask, and default gateway. The first command to run on a suspected misconfiguration.
- netstat / ss: Shows active connections and listening ports. Useful for confirming whether a service is running and accepting traffic.
| Tool | Function | Primary use case |
|---|---|---|
| ping | Tests IP reachability | Confirm host is up or down |
| traceroute / tracert | Maps network path | Locate routing failures or latency spikes |
| nslookup | DNS resolution check | Diagnose name resolution failures |
| ipconfig / ifconfig | Shows IP configuration | Verify address, mask, and gateway |
| netstat / ss | Lists connections and ports | Confirm service availability |
| Wireshark | Packet capture and analysis | Deep inspection of traffic anomalies |
Verifying physical access to devices and confirming you have the correct credentials before starting saves significant time. A technician locked out of a switch mid-diagnosis loses all momentum.
How to perform step by step troubleshooting using the OSI model as a fault map
The OSI model is the most reliable fault map for stepwise network diagnosis. Experts treat it as a mental framework rather than a memorization exercise. Mapping symptoms to a specific layer focuses your effort and prevents you from chasing application errors when the real problem is a bad cable.
A bottom-up approach starting from physical connectivity and moving upward is the most reliable strategy. Work through the layers in this order:
- Layer 1: Physical. Check cable connections, interface LEDs, and SFP modules. Confirm the port shows a link-up state on both ends. Swap cables to rule out physical damage before proceeding.
- Layer 2: Data link. Verify MAC address tables on switches. Check for VLAN mismatches between connected ports. Inspect interface counters for CRC errors. Even small CRC error rates on high-speed links cause significant throughput degradation and signal a physical layer problem masquerading as a data link issue.
- Layer 3: Network. Confirm the IP address, subnet mask, and default gateway on the affected host using ipconfig or ifconfig. Run ping to the gateway. If the gateway responds but a remote host does not, run traceroute to find where the path breaks. Check routing tables on routers and Layer 3 switches.
- Layer 4: Transport. Use netstat or ss to confirm the target service is listening on the correct port. Check firewall rules for blocked TCP or UDP ports. High TCP TIME_WAIT socket counts can mimic new connection delays and cause application slowness that looks like a network problem.
- Layers 5 through 7: Session, presentation, and application. Confirm the application service is running. Check application logs for authentication errors, certificate failures, or API timeouts. Test with a known-good client to rule out client-side configuration.
Approximately 80% of network connectivity problems resolve at Layers 1 through 3. That means most faults you encounter never require you to go above the network layer.
Pro Tip: Change one variable at a time. Swapping a cable and changing an IP simultaneously makes it impossible to know which fix resolved the problem.

What are common troubleshooting scenarios and how to apply the stepwise method?
Real-world network problems fall into four recurring categories. Each one has a distinct symptom profile and a clear starting point in the OSI stack.
No network access at all
- Symptom: Host shows no connectivity. Cannot ping gateway or any external address.
- Start at Layer 1. Check the physical link LED. Run ipconfig to confirm the host has a valid IP. If the address is a 169.254.x.x APIPA address, the host failed to get a DHCP lease.
- Resolution path: Fix the physical link, then confirm DHCP server reachability.
Intermittent connectivity drops
- Symptom: Connection works, then drops randomly. Users report brief outages.
- Check interface error counters on the switch port. CRC errors or input errors point to a physical layer problem. Check for duplex mismatches using interface statistics.
- Resolution path: Replace the cable or correct the duplex and speed settings on the interface.
Slow network performance
- Symptom: Traffic flows but throughput is degraded. File transfers are slow. Applications time out.
- Run traceroute to identify high-latency hops. Check interface utilization on the uplink. Inspect for packet loss using extended ping with a large packet count.
- Resolution path: Address congestion, fix routing asymmetry, or identify a failing WAN link.
Partial application failure
- Symptom: Some application functions work, others do not. Users can log in but cannot load specific features.
- Start at Layer 4. Confirm all required ports are open on firewalls. Check for network visibility gaps that hide traffic between application tiers.
- Resolution path: Update firewall rules or fix DNS resolution for internal service endpoints.
Do not skip layers because a symptom looks like an application problem. A VLAN misconfiguration at Layer 2 can produce symptoms that look exactly like a broken API call at Layer 7.
How to analyze findings, form hypotheses, and confirm fixes
The most common mistake in network troubleshooting is jumping to a solution before defining the problem. Answering "What changed?" and "Does it affect everyone or just one user?" early in the process narrows the fault domain and prevents wasted effort. A problem affecting one user points to the access layer or the endpoint. A problem affecting an entire site points to the core or WAN.
Once you have gathered test results, form a hypothesis that explains all observed symptoms. A good hypothesis is specific. "The switch port is dropping packets due to a duplex mismatch" is testable. "Something is wrong with the network" is not.
Test your hypothesis with the smallest possible change. Correct the duplex setting on one port and retest. If the problem resolves, you have confirmed the fix. If it does not, revert the change and test the next hypothesis.
Experienced engineers use a divide-and-conquer approach to isolate faults faster than sequential testing. Split the path and test the midpoint. If the midpoint is reachable, the fault is in the second half of the path. This method cuts diagnostic time significantly compared to testing every hop in order.
Pro Tip: After confirming a fix, run the same baseline tests you used at the start. Passing those tests proves the fault is resolved, not just suppressed.
Key practices for this phase:
- Write down every test result, even negative ones. Negative results eliminate possibilities and save time on repeat incidents.
- Confirm the fix holds under load, not just in a quiet test window.
- Update the change log and network documentation before closing the ticket.
- Share findings with the team. Documenting fixes and returning to baseline tests post-fix minimizes repeat work and assists escalation.
What advanced diagnostic tools can speed up network troubleshooting?
Wireshark is the standard tool for packet-level analysis when commands like ping and traceroute do not reveal the root cause. Capture traffic at the point closest to the affected host and filter by IP or protocol. A packet capture showing TCP retransmissions confirms packet loss even when interface counters look clean.
Hardware counters on switches and routers carry information that CLI commands alone miss. Monitor input errors, output drops, and CRC counts on every interface in the fault path. A 0.1% CRC error rate on a 10GbE link causes measurable TCP throughput degradation. That rate looks trivial in a counter but produces real user impact.
| Tool or technique | Best use case | Diagnostic layer |
|---|---|---|
| Wireshark | Packet capture and flow analysis | Layers 2 through 7 |
| Interface error counters | Physical and data link fault detection | Layers 1 and 2 |
| SNMP polling | Bandwidth and utilization trending | Layer 3 and above |
| Syslog analysis | Event correlation across devices | All layers |
| AI-assisted monitoring | Anomaly detection and root cause correlation | All layers |
Automation tools and AI-assisted network monitoring are becoming essential for scaling troubleshooting efficiency and reducing human error in complex networks. Platforms that correlate telemetry across devices surface anomalies before users report them. This shifts the workflow from reactive diagnosis to proactive resolution.
Pro Tip: Set up proactive network alerts on interface error thresholds before an incident occurs. Catching a rising CRC count at 0.05% is far easier than diagnosing a failed link at 2 a.m.
Automated network diagnostics reduce mean time to resolution by running parallel checks across multiple devices simultaneously. A technician running manual commands checks one device at a time. An automated platform checks hundreds in seconds.
Key Takeaways
Structured, layer-by-layer network troubleshooting using the OSI model resolves the majority of faults faster, with less guesswork, and with documentation that prevents repeat incidents.
| Point | Details |
|---|---|
| Start with prerequisites | Gather network diagrams, change logs, and credentials before running any diagnostic commands. |
| Use the OSI model as a fault map | Work bottom-up from Layer 1 to Layer 7; 80% of faults resolve at Layers 1 through 3. |
| Ask scope questions first | Determine what changed and who is affected before forming any hypothesis. |
| Test one variable at a time | Change a single setting per test cycle to confirm which fix actually resolved the fault. |
| Document every resolution | Record test results, fixes, and baseline confirmations to reduce repeat work and support escalation. |
The discipline that separates good technicians from great ones
After years of working through network incidents, the pattern I see most often is not a lack of technical knowledge. It is a lack of process discipline under pressure. When an outage hits and users are calling, the instinct is to act fast and try the most likely fix first. That instinct costs more time than it saves.
The OSI model is not a textbook concept. It is a decision tree you run in your head on every incident. When I stopped thinking "what is probably broken" and started thinking "which layer has I not confirmed yet," my resolution times dropped noticeably. The model forces you to confirm facts before acting on assumptions.
The other habit that separates consistent performers is documentation. Not the kind you write for compliance. The kind you write for yourself at 2 a.m. six months from now. A one-paragraph incident summary with the symptom, the root cause, and the fix is worth more than any certification when you hit the same problem again.
My advice to newer technicians is to resist the urge to skip layers because a symptom looks obvious. And my advice to experienced engineers is to revisit your process periodically. Systematic troubleshooting workflows ensure consistency and reduce errors under pressure, even for technicians who have been doing this for decades.
— Jim
How Netverge supports faster network fault resolution
Netverge brings AI-powered observability to the troubleshooting workflow, giving IT teams and MSPs real-time telemetry, anomaly detection, and automated root cause analysis across distributed infrastructure.
The platform's AI-driven monitoring correlates data from across your network, surfaces anomalies before they become outages, and maps faults to specific devices and layers automatically. Vergepoints hardware provides physical-layer visibility at the edge, feeding data into a centralized dashboard that replaces fragmented tools. For teams managing multi-location environments, Netverge's AI-powered ticketing connects incident detection directly to service desk workflows, cutting the gap between detection and resolution. Request a demo to see how the platform fits your troubleshooting process.
FAQ
What is the first step in network troubleshooting?
The first step is defining the problem scope by asking what changed and who is affected. This narrows the fault domain before any diagnostic commands are run.
Why is the OSI model used for network troubleshooting?
The OSI model provides a structured, layer-by-layer fault map that prevents technicians from skipping checks and chasing symptoms at the wrong layer. Approximately 80% of faults resolve at Layers 1 through 3.
What does "divide and conquer" mean in network troubleshooting?
Divide and conquer means testing the midpoint of a network path first rather than checking every hop sequentially. This method isolates the fault to one half of the path immediately, cutting diagnostic time significantly.
How do CRC errors affect network performance?
CRC errors indicate physical layer problems such as a damaged cable or a failing interface. Even a small CRC error rate on a high-speed link causes measurable TCP throughput degradation.
When should you use Wireshark during troubleshooting?
Use Wireshark when standard commands like ping and traceroute do not reveal the root cause. Packet captures confirm issues like TCP retransmissions, malformed packets, and application-layer failures that CLI tools miss.