Traditional monitoring tools often operate on polling cycles measured in minutes. By the time a degraded link, a saturated uplink, or a failing switch port triggers an alert, the damage is already affecting users. An intermittent failure that lasts 90 seconds every few hours will slip right past a 5-minute SNMP poll, leaving your team chasing ghost complaints with no data to support the investigation. Real-time monitoring shifts from periodic polling to continuous, push-based telemetry, giving MSPs and enterprises the visibility they need to detect, correlate, and respond before business impact escalates.
Table of Contents
- What you need to set up real-time network monitoring
- Step-by-step guide: Building a practical real-time workflow
- Troubleshooting and handling network monitoring edge cases
- Verification and tuning: Ensuring reliable outcomes
- What most guides miss: Real-time doesn't mean real-time everywhere
- Modern solutions for effortless real-time monitoring
- Frequently asked questions
Key Takeaways
| Point | Details |
|---|---|
| Start with clear KPIs | Defining your monitoring scope and key performance indicators is essential for actionable results. |
| Mix telemetry methods | Combine streaming, polling, and push alerts tailored to what matters most—don’t force real-time everywhere. |
| Engineer for resilience | Build fault tolerance and pub/sub decoupling into your monitoring pipeline to prevent blind spots during failures. |
| Verify and tune regularly | Continuously check, calibrate, and optimize your setup to deliver reliable, efficient insights that drive operational gains. |
What you need to set up real-time network monitoring
Before you start building your workflow, you'll need the right foundation. Let's break down what's essential up front.
Real-time monitoring is not just a software upgrade. It requires deliberate architecture decisions across collection, transport, and processing layers. Getting these right from the start prevents costly rework later.
Core components you need
A production-grade real-time monitoring stack requires three functional layers working together:
- Collectors: Agents or probes deployed on network devices, servers, or dedicated hardware that gather telemetry data. These can be streaming telemetry exporters using gRPC or YANG models, SNMP trap receivers, syslog aggregators, or flow exporters (NetFlow, sFlow, IPFIX).
- Brokers and pipelines: Message queues or pub/sub systems (such as Apache Kafka or Redis Streams) that decouple collection from processing. This decoupling is critical. Pub/sub decoupling and replay prevent monitoring misses when a downstream consumer goes offline, because events are buffered and replayed on reconnect rather than dropped permanently.
- Analytic and alerting engines: Platforms that ingest normalized telemetry, apply correlation rules, detect anomalies, and fire alerts or trigger automation. These must support low-latency stream processing, not batch jobs.
Choosing a unified network monitoring platform that integrates all three layers eliminates the integration overhead that typically consumes engineering time in fragmented tool stacks.
Requirements checklist for enterprise-grade monitoring
Before deploying, verify that your stack meets these baseline requirements:
| Requirement | Why it matters | Minimum standard |
|---|---|---|
| Fault tolerance | Prevents data loss during collector or broker restarts | Redundant collectors, persistent queues |
| End-to-end latency | Determines how quickly alerts fire after an event | Under 10 seconds, collection to alert |
| Pub/sub architecture | Allows multiple consumers without data loss | At least one message broker layer |
| Mixed cadence support | Balances cost and coverage across metric types | Configurable per metric or device class |
| Normalization layer | Ensures consistent data across vendors and protocols | Schema mapping before ingestion |
| Scalability | Handles growth in devices, sites, and telemetry volume | Horizontal scaling on collectors and brokers |
You should also evaluate specialized sensor options early in your planning phase. Different network segments and device types produce different telemetry, and a one-size-fits-all collection approach often creates blind spots.
Pro Tip: Plan for mixed-telemetry cadences from day one. Hardware status metrics like fan speed and power supply state change slowly and can tolerate 5-minute polling. Interface counters and flow data need sub-second or per-second resolution. Designing cadence tiers upfront prevents you from over-engineering the entire pipeline for worst-case throughput.
Step-by-step guide: Building a practical real-time workflow
With your tools and requirements in place, you're ready to implement a modern, efficient real-time monitoring process.
The practical real-time network monitoring workflow follows six stages: define scope and KPI targets, collect telemetry continuously, transport reliably to collectors and brokers, normalize and enrich, correlate across devices and services, then alert and drive automation with runbooks. Each stage builds on the previous one.
The six-stage workflow
Define scope and KPI targets. Identify which devices, interfaces, services, and flows are in scope. Map each to a business outcome. For example, a WAN uplink serving a point-of-sale system has a different criticality tier than a backup management interface. Define acceptable thresholds for latency, packet loss, jitter, and utilization before you collect a single metric.
Collect telemetry continuously. Deploy collectors appropriate to each device class. Use streaming telemetry (gRPC/YANG) for modern routers and switches that support it. Use SNMP traps and syslog for legacy devices. Use flow exporters for traffic visibility. The key is that collection must be continuous or event-driven, not scheduled.
Transport reliably to brokers. Route all collected telemetry through a pub/sub broker before it reaches your analytics engine. This decouples ingestion from processing. If your alerting engine restarts for maintenance, the broker buffers incoming data so no events are lost. This is the architectural decision that separates robust monitoring from fragile setups.
Normalize and enrich. Raw telemetry from different vendors arrives in different formats. A normalization layer maps all incoming data to a consistent schema, adds context (site, device role, business service), and filters noise. Enrichment at this stage dramatically improves alert quality downstream.
Correlate across devices and services. Single-device alerts generate noise. Correlation identifies when multiple related events are part of the same root cause. A BGP session drop, followed by increased CPU on a router, followed by latency spikes on downstream hosts, is one incident, not three separate alerts.
Alert and drive automation with runbooks. Correlated events trigger alerts routed to the right team or, better, trigger automated runbooks that begin remediation immediately. AI triage for outages can classify incidents, assign priority, and execute first-response actions without waiting for human review.
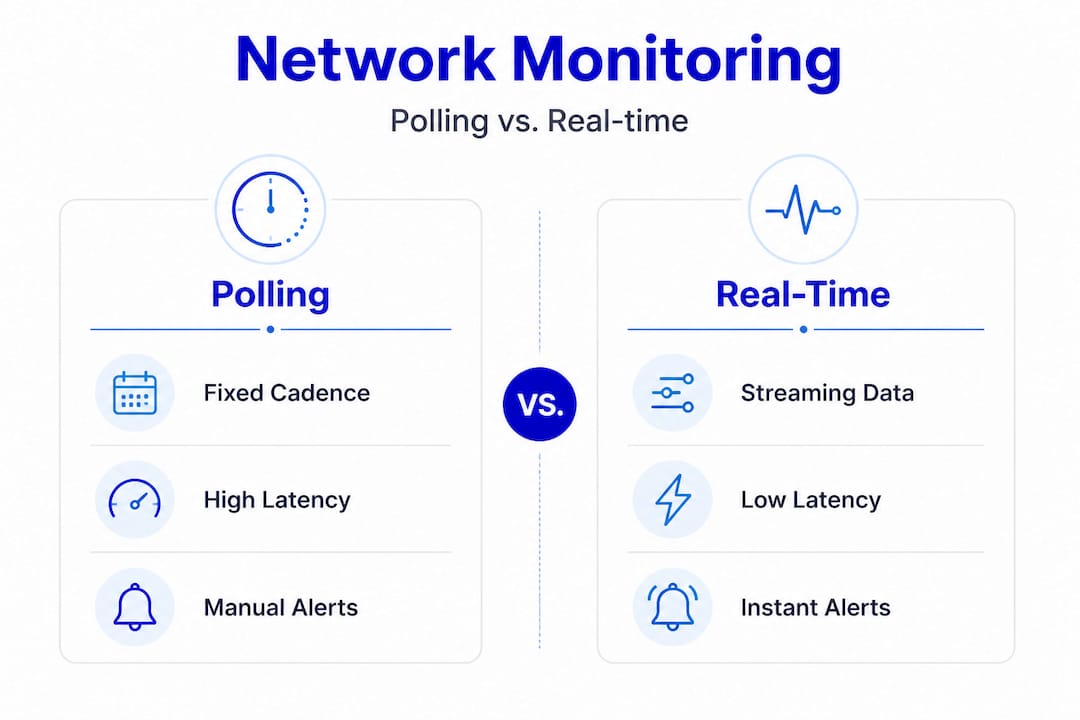
Traditional polling vs. modern real-time strategies
| Dimension | Traditional polling (SNMP) | Modern real-time (streaming + push) |
|---|---|---|
| Collection cadence | Fixed intervals (5-15 min) | Continuous or event-driven |
| Latency to alert | 5-15 minutes | Under 10 seconds |
| Data volume | Low | High (requires pipeline tuning) |
| Missed events | Frequent for short anomalies | Rare with pub/sub buffering |
| Scalability | Limited by polling overhead | Horizontal with broker architecture |
| Root cause correlation | Manual, after the fact | Automated, in-stream |
Use event management for real-time alerts to handle the increased event volume that streaming telemetry produces. Without proper event management, real-time monitoring creates alert fatigue rather than clarity.
Pro Tip: Decouple ingestion from processing at the broker layer. If your alerting engine experiences lag, your collection pipeline should not slow down or drop data. A pub/sub buffer ensures that even a 2-minute processing delay does not cause you to miss a 90-second link flap.
Troubleshooting and handling network monitoring edge cases
Even well-architected systems encounter elusive problems. Here's how to troubleshoot the toughest cases.
Standard monitoring workflows handle clear-cut failures well. A device goes offline, an interface goes down, a threshold is breached. These are unambiguous. The harder cases are intermittent or partial failures where symptoms vary, metrics look acceptable in aggregate, and users report problems that your dashboards do not confirm.
When standard monitoring is not enough
Intermittent failures share a common characteristic: they are brief enough to fall between collection intervals or subtle enough that aggregate metrics mask them. A 200ms latency spike that occurs for 10 seconds every 30 minutes will not appear on a 5-minute average chart. It will, however, cause TCP retransmissions, VoIP quality degradation, and application timeouts that users notice immediately.
Key indicators that you need deeper visibility:
- Users report problems that dashboards do not show
- Alerts clear before anyone investigates
- Issues are time-of-day dependent but not correlated to obvious traffic peaks
- Symptoms vary across sessions on the same path
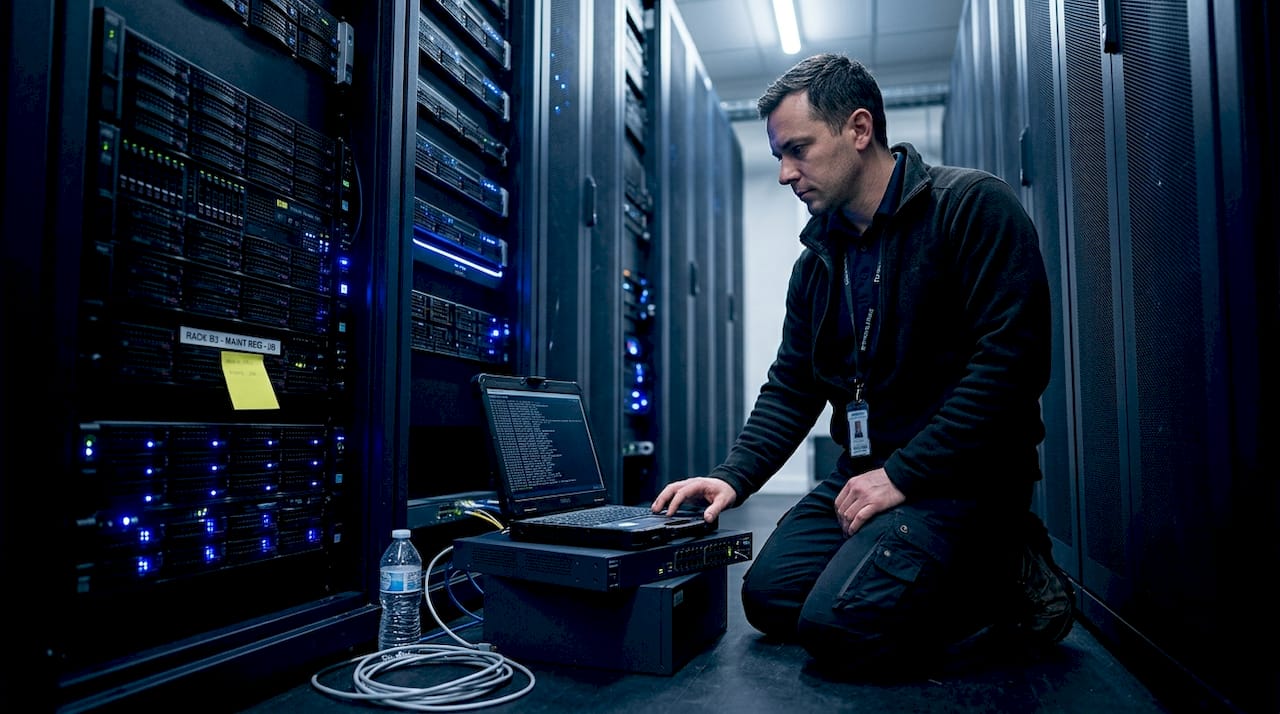
"When failures are intermittent and symptoms vary, packet capture becomes essential. A single pcap from a failed session can reveal what aggregate metrics never will. Two pcaps, one from a good session and one from a bad session on the same path, let you compare behavior at the packet level and isolate exactly where the deviation occurs."
Packet capture best practices
Intermittent partial failures require packet capture near the point where behavior becomes ambiguous. Capturing too far upstream or downstream from the problem zone adds noise and makes comparison harder.
Follow these guidelines for effective packet capture in edge cases:
- Capture at the ambiguity point. If users on one VLAN report issues but another VLAN is fine, capture at the switch port or router interface where the paths diverge.
- Capture simultaneously on both sides. For client-server issues, capture at both ends. Timestamps will show you whether a delay originates at the server, the client, or somewhere in the network path.
- Use display filters aggressively. Filter to the specific flow (source IP, destination IP, port) to reduce noise. A 10-second capture of a specific TCP session is more useful than a 10-minute full capture.
- Compare good and bad sessions. Capture a working session first to establish a baseline. Then capture during a failure. Compare TCP handshake timing, retransmission rates, and window sizes between the two.
- Look for TCP retransmissions and RST packets. These are reliable indicators of packet loss or connection resets that aggregate metrics will not surface.
For specialized network visibility at the sensor level, purpose-built probes positioned at key network segments can trigger automated packet captures when anomaly thresholds are crossed, eliminating the need to manually initiate captures during brief failure windows.
Verification and tuning: Ensuring reliable outcomes
To close the loop, it's crucial to prove your monitoring setup delivers and tune continuously for efficiency with real-world constraints.
Deploying a real-time monitoring stack is not a one-time project. Network environments change. New devices are added. Traffic patterns shift. Applications move to the cloud. Your monitoring configuration must evolve with the infrastructure it covers.
Key metrics to validate successful monitoring
Before you declare your setup production-ready, verify these outcomes:
- Alert latency: Measure the time from a simulated fault to alert delivery. Target under 10 seconds for critical paths.
- False positive rate: Track how many alerts require no action. A rate above 15-20% indicates correlation rules need tuning.
- Coverage completeness: Confirm every device in scope is actively sending telemetry. Silent devices are a common blind spot.
- Broker queue depth: Monitor your pub/sub broker's queue depth under peak load. Growing queues indicate processing capacity needs to increase.
- Missed event rate: Introduce controlled test faults (brief interface flaps, simulated packet loss) and verify every event is captured and alerted.
Balancing polling and streaming based on criticality
Not every metric needs sub-second resolution. Real-time everywhere is usually unnecessary and increases cost and complexity without proportional benefit. The practical approach is a criticality-driven cadence model.
High-frequency streaming (per-second or sub-second):
- Interface utilization on critical WAN links
- BGP and OSPF session state
- Active flow statistics
- Security event telemetry
Medium-frequency polling (30 seconds to 2 minutes):
- CPU and memory utilization
- Interface error counters
- VPN tunnel state
Low-frequency polling (5 to 15 minutes):
- Hardware health (temperature, fan speed, power supply state)
- Firmware version compliance
- Configuration change detection
Stat callout: Increasing collection frequency across all devices from 5-minute polling to per-second streaming can increase telemetry volume by a factor of 300 or more. Without selective cadence design, storage and processing costs scale accordingly, often exceeding the operational budget allocated for monitoring infrastructure.
Leverage AI automation workflows to continuously tune alert thresholds based on observed baselines. Static thresholds set at deployment become stale as traffic patterns evolve. AI-driven baselining adjusts thresholds dynamically, reducing false positives without manual reconfiguration.
Ongoing verification checklist
Run this checklist monthly to keep your monitoring stack healthy:
- Confirm all devices in scope are actively reporting telemetry
- Review and prune alert rules that have not fired in 90 days
- Test broker failover and replay functionality
- Validate that runbooks triggered by alerts are still accurate
- Review coverage for newly added devices or network segments
What most guides miss: Real-time doesn't mean real-time everywhere
With all the operation steps covered, let's address the biggest misconception and share practical wisdom from the trenches.
The phrase "real-time monitoring" creates an implicit expectation that everything should be monitored at the highest possible resolution, all the time. In practice, that expectation leads to over-engineered pipelines, bloated storage costs, and teams drowning in data volume rather than actionable insight.
The most effective monitoring deployments we see are not the ones with the highest data volume. They are the ones with the most deliberate data strategy. The teams that succeed have made explicit decisions about which metrics are truly time-sensitive and which are not. They have documented those decisions and built their pipeline architecture around them.
Some monitoring remains best-effort with lower-rate polling for hardware status and other stable indicators, while higher-resolution streaming is reserved for flows, interface statistics, and fault events. This is not a compromise. It is sound engineering.
The common pitfall is treating all monitoring as equally urgent. An IT team that deploys streaming telemetry for every device, including out-of-band management interfaces and rarely-used backup links, will spend more time managing the monitoring infrastructure than managing the network itself. The pipeline becomes the problem.
Our recommendation: document which data must be real-time and why. For each metric class, write down the business justification for the collection cadence. If you cannot articulate why a metric needs sub-second resolution, it probably does not. This discipline prevents scope creep in your telemetry pipeline and keeps operational costs predictable.
For MSPs managing monitoring scope across dozens of client environments, this discipline is especially valuable. Each client has different criticality tiers. A retail client with POS systems needs real-time WAN monitoring during business hours. A professional services firm may only need real-time monitoring for their VPN concentrators. Applying a uniform high-resolution strategy across all clients wastes resources and creates noise.
Build a criticality matrix per client or per environment. Assign each device class and metric type to a cadence tier. Review it quarterly. This single practice will do more for your monitoring ROI than any tool upgrade.
Modern solutions for effortless real-time monitoring
If you're ready to move from manual steps to streamlined, AI-driven network operations, these next resources will get you there faster.
Implementing everything in this guide from scratch requires significant engineering effort. Purpose-built platforms accelerate every stage of the workflow, from collection to correlation to automated response.
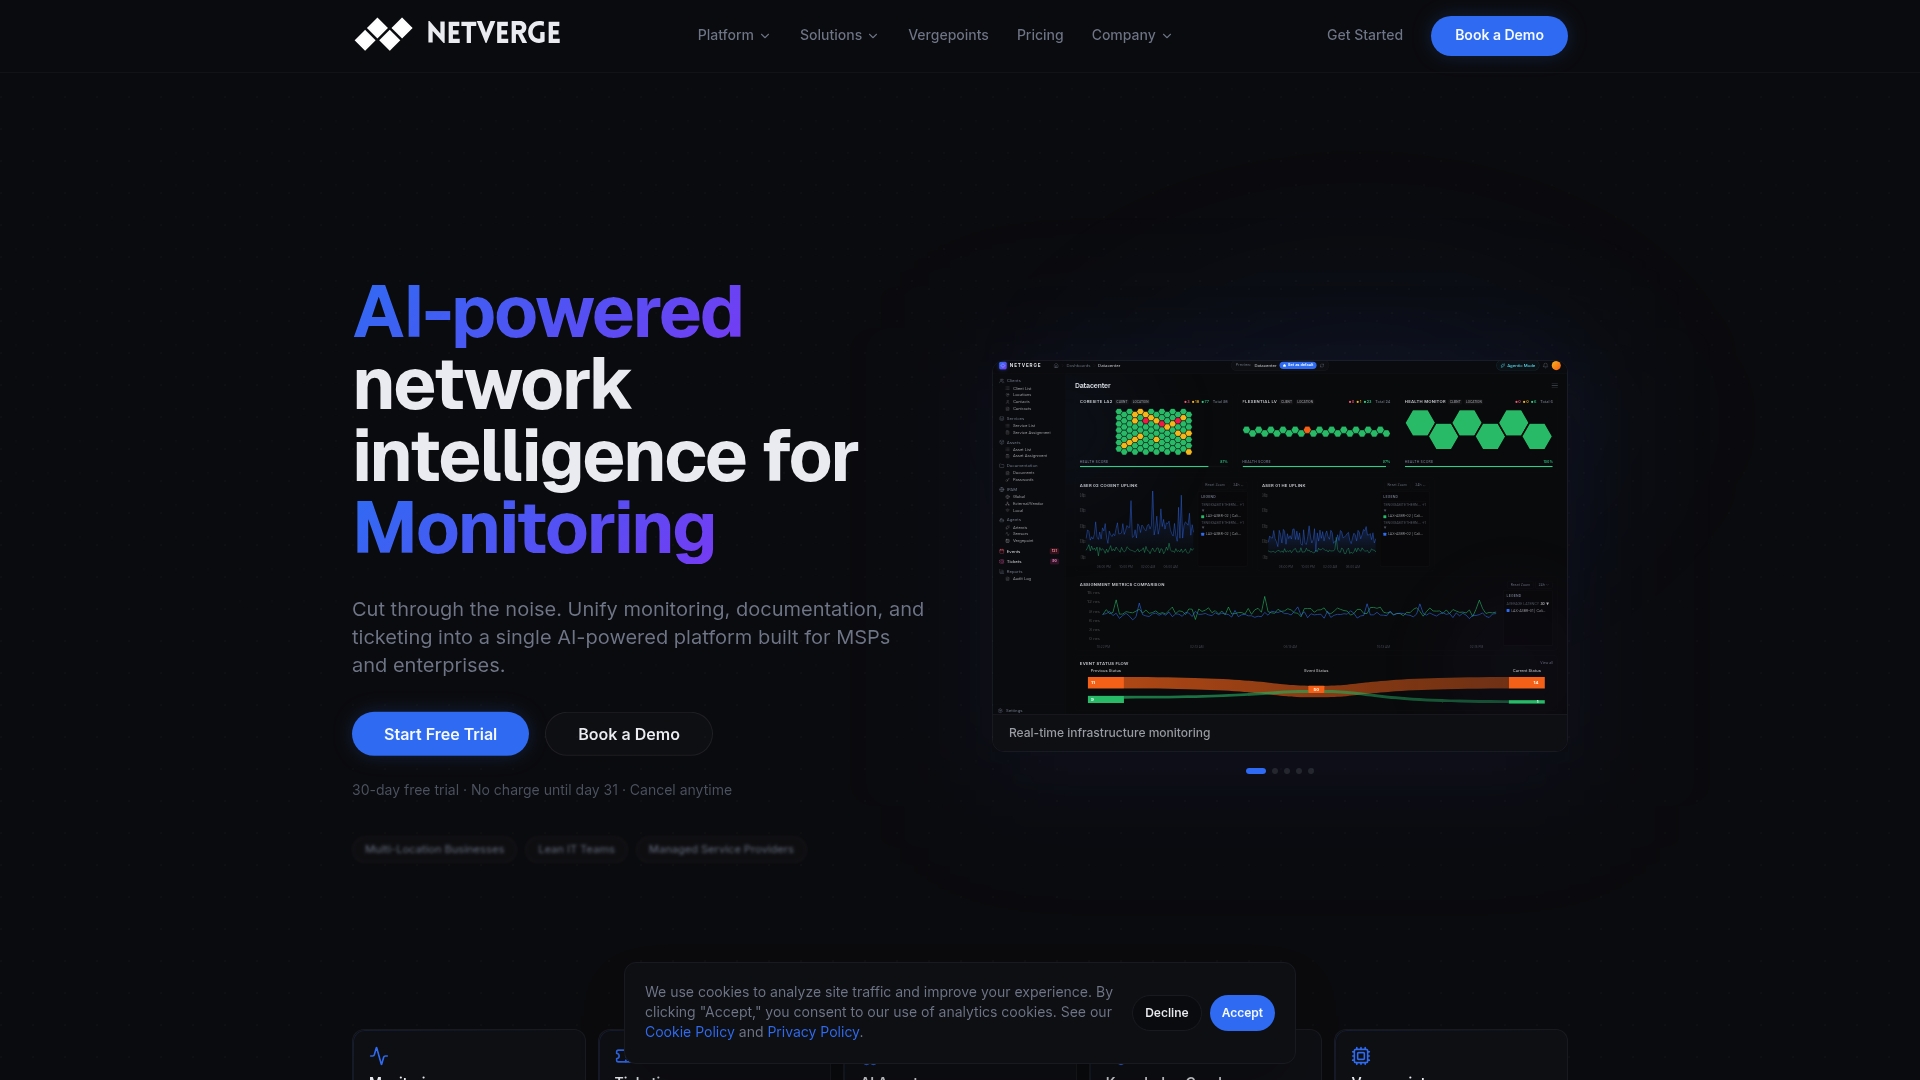
Netverge delivers AI-powered monitoring that unifies telemetry collection, anomaly detection, and intelligent alerting into a single platform. For physical visibility at distributed sites, plug-and-play observability through Vergepoints deploys in minutes without complex configuration. When incidents do occur, the automated service desk handles ticket creation, triage, and routing automatically, reducing mean time to resolution and freeing your team to focus on higher-value work. Whether you manage 10 sites or 1,000, Netverge scales with your operations and replaces the fragmented tool stacks that slow teams down.
Frequently asked questions
What is the first step in setting up real-time network monitoring?
Start by clearly defining scope and KPI targets essential for your network's performance and business needs, so every subsequent architecture decision is grounded in operational requirements.
When should packet capture be used in network monitoring?
Packet capture should be used when dealing with intermittent or partial failures that aggregate metrics cannot explain, particularly when user-reported symptoms do not match dashboard data.
Is it necessary to collect all metrics in real time?
No. Only critical metrics and active flows require real-time streaming. Stable statuses benefit from low-frequency polling to keep pipeline costs and complexity proportional to actual operational value.
How does pub/sub decoupling help real-time monitoring?
Pub/sub architecture prevents monitoring misses by buffering events so multiple downstream systems can reconnect and replay missed events during outages without permanently losing telemetry data.