
Most IT leaders assume that if their devices are up and interfaces are green, the network is healthy. That assumption is wrong. SNMP polling tells you a device is reachable and an interface is passing traffic, but it cannot tell you who is consuming bandwidth, which application is degrading a WAN link, or whether your cloud provider is routing traffic the way you expect. For MSPs managing dozens of client environments and enterprises running distributed sites, that blind spot is not a minor inconvenience. It is a direct risk to uptime, SLA compliance, and security posture.
Table of Contents
- What is network infrastructure and why does it matter?
- Core monitoring approaches: SNMP, flow telemetry, and advanced observability
- From reactive to proactive: Modern best practices for network management
- Assessment and benchmarking: Validating performance and reliability across sites
- A critical perspective: Going beyond device monitoring for actual results
- Next steps: Advanced network infrastructure solutions for MSPs & enterprises
- Frequently asked questions
Key Takeaways
| Point | Details |
|---|---|
| SNMP is not enough | Device polling alone misses traffic attribution—combine with flow telemetry for true visibility. |
| Proactive management pays off | 24x7 monitoring and defined SLAs drive lower downtime and better security for enterprises and MSPs. |
| Benchmark with real data | Platforms like RIPE Atlas let you empirically validate network performance and provider claims. |
| Cloud routing can surprise | Paths through cloud providers may not match expectations—test and verify routing strategies. |
What is network infrastructure and why does it matter?
Network infrastructure is the full set of hardware, software, and services that enable connectivity across an organization. That definition has expanded significantly in recent years.
Modern network infrastructure includes:
- Physical layer: Switches, routers, firewalls, wireless access points, and physical cabling
- Virtual layer: Software-defined networking (SDN) fabrics, virtual switches, and overlay networks
- Cloud layer: Cloud-native gateways, virtual private clouds (VPCs), SD-WAN endpoints, and cloud interconnects
- Management layer: Monitoring platforms, configuration management systems, and ticketing integrations
For an enterprise with 50 branch offices or an MSP managing 200 client networks, every one of these layers must be visible and manageable. A failure at any layer can cascade into a business-impacting outage.
"MSP and managed network operations commonly combine proactive monitoring, defined alert thresholds, severity classifications, and NOC-style 24x7 operations with lifecycle management and SLA constructs to reduce downtime and security incidents compared with reactive-only approaches."
Operational importance goes beyond keeping lights on. Performance directly affects employee productivity, customer experience, and revenue. A 200ms latency spike on a VoIP call is immediately noticeable. A routing loop on a cloud interconnect can silently degrade application response times for hours before anyone files a ticket.
Multi-vendor environments add another layer of complexity. A single site might have switches from one vendor, firewalls from another, and wireless infrastructure from a third. Each device family has its own telemetry format, CLI syntax, and API behavior. MSP network monitoring requires a platform that normalizes all of this data into a unified view, rather than forcing engineers to context-switch between five separate consoles.

The risk of unmanaged complexity is not theoretical. Geo-distributed networks with inconsistent monitoring coverage are statistically more likely to experience extended mean time to detect (MTTD) and mean time to resolve (MTTR) during incidents. For enterprises and MSPs, those numbers translate directly into SLA penalties and client churn.
Core monitoring approaches: SNMP, flow telemetry, and advanced observability
Given the scope and stakes, the next step is understanding which tools deliver meaningful insight into your environment.
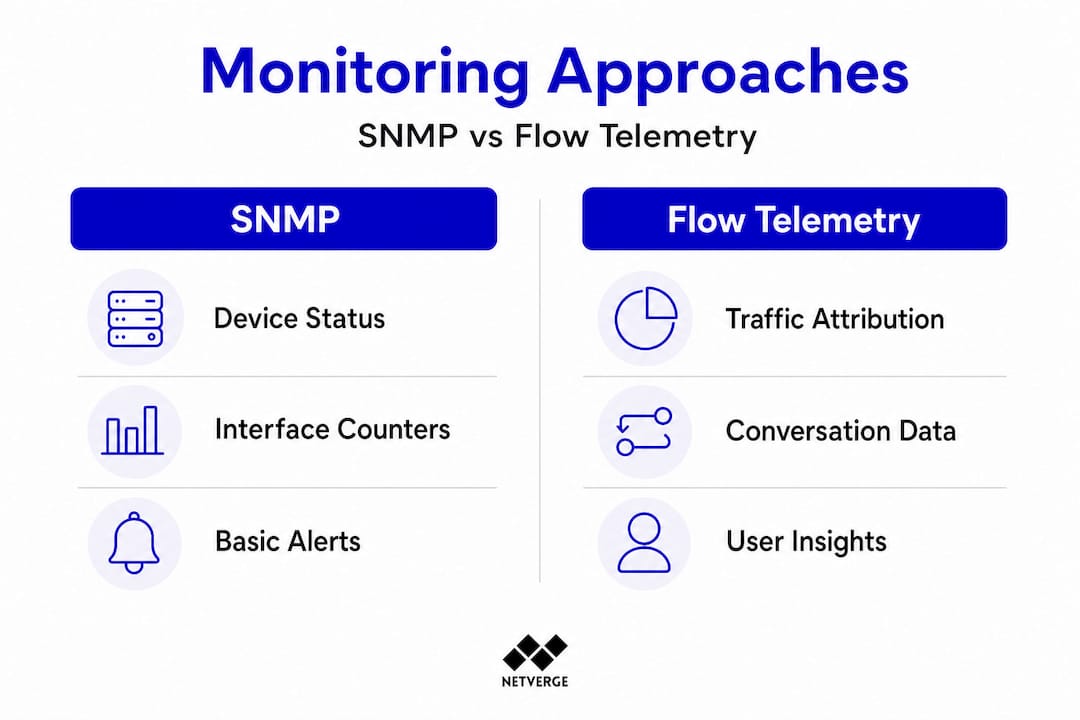
SNMP (Simple Network Management Protocol) is the most widely deployed monitoring protocol in enterprise networking. It works by polling devices at regular intervals, retrieving OID (Object Identifier) values that represent interface counters, CPU utilization, memory usage, and error rates. SNMP is lightweight, broadly supported, and effective for what it does.
The problem is what it does not do. SNMP cannot attribute traffic to a specific user, application, or destination. If your WAN utilization jumps to 95%, SNMP tells you the interface is saturated. It does not tell you whether a backup job, a video conference, or a compromised endpoint is responsible.
That is where flow telemetry fills the gap. NetFlow, sFlow, and IPFIX are protocols that export conversation-level records from network devices. Each record captures source IP, destination IP, port, protocol, byte count, and packet count for individual flows. Flow data answers the questions SNMP cannot, including who is generating traffic, where it is going, and how much bandwidth each application is consuming.
| Method | What it measures | Granularity | Best use case |
|---|---|---|---|
| SNMP polling | Interface counters, CPU, memory | Device-level | Health checks, threshold alerts |
| NetFlow/IPFIX | Traffic conversations, app flows | Flow-level | Bandwidth attribution, anomaly detection |
| sFlow | Sampled packet data | Sampled flow-level | High-speed links, security analysis |
| Full observability | All of the above, correlated | Multi-source | Root cause analysis, SLA validation |
True monitoring and observability means combining these methods. Here is a practical workflow:
- Use SNMP polling to establish baseline health metrics for every device and interface.
- Enable flow export (NetFlow or IPFIX) on edge routers and core switches.
- Correlate flow data with SNMP counters to identify which traffic is causing interface saturation.
- Add synthetic monitoring (ping, traceroute, HTTP checks) to validate end-to-end path performance.
- Feed all data into a unified platform that can correlate events across sources and trigger automated responses.
A real-world example: A WAN link between a branch office and a data center shows 90% utilization in SNMP. Without flow data, the team assumes it is normal business traffic and schedules an upgrade. With flow data, they discover a single endpoint running an unauthorized cloud backup at 400 Mbps. The fix takes 10 minutes instead of a multi-week circuit upgrade project.
Pro Tip: Enable flow export on your highest-traffic interfaces first. Even partial flow coverage on core and edge devices provides dramatically more context than SNMP alone, and you can expand coverage incrementally without a full platform overhaul.
For complete network visibility, the goal is not to pick one method. It is to layer them so each source fills the gaps left by the others.
From reactive to proactive: Modern best practices for network management
With the right tools in place, how you approach monitoring and management can determine business outcomes. Let's explore best practices that separate high-performing network operations from those constantly fighting fires.
The reactive model is familiar to most IT teams. An end user reports slowness. The help desk opens a ticket. A network engineer logs into devices, runs commands, and eventually isolates the issue. By the time resolution arrives, the business has absorbed the impact. MTTR in reactive environments commonly runs 2 to 4 times longer than in proactive ones.
Proactive management flips this sequence. Monitoring systems detect anomalies before users notice them, alert thresholds trigger automated runbooks, and engineers receive actionable context rather than raw alerts. The result is faster resolution and fewer escalations.
| Approach | Avg. MTTR | Alert noise | SLA compliance | Engineer workload |
|---|---|---|---|---|
| Reactive only | High | Low (no alerts) | Inconsistent | Spike-driven |
| Basic SNMP alerting | Moderate | High (threshold spam) | Improved | Alert fatigue risk |
| Proactive, multi-source | Low | Filtered, correlated | Consistent | Steady, manageable |
Key best practices for proactive network management include:
- Define alert thresholds by severity. Not every threshold breach is a P1. Classify alerts as informational, warning, or critical based on business impact. This directly reduces alert fatigue and ensures engineers focus on what matters.
- Build incident runbooks for common failure patterns. A runbook for "WAN link down" should include automated ping tests, traceroute captures, carrier portal checks, and escalation contacts. Automating these steps cuts MTTR significantly.
- Implement lifecycle management. Track firmware versions, end-of-life dates, and configuration baselines for every device. Unpatched firmware and configuration drift are leading causes of security incidents and unexpected failures.
- Adopt NOC-style 24x7 coverage. For MSPs, this often means tiered on-call rotations with clear escalation paths. For enterprises, it may mean a dedicated network operations center or a managed NOC service.
"Proactive monitoring combined with defined SLA constructs and lifecycle management reduces both downtime frequency and security incident rates compared with reactive-only operations."
Event management platforms that correlate alerts across devices and sites are critical here. A single fiber cut might generate 50 individual SNMP traps from downstream devices. An intelligent event management system recognizes the common root cause and creates one actionable ticket instead of 50 noise alerts.
The checklist for moving to proactive operations:
- Audit current monitoring coverage across all sites and device types
- Define alert severity tiers and map them to response SLAs
- Enable flow telemetry on core and edge devices
- Build runbooks for your top 10 most common incident types
- Implement automated first-response actions for known failure patterns
- Review MTTD and MTTR metrics monthly and set improvement targets
Assessment and benchmarking: Validating performance and reliability across sites
Good processes require evidence. Benchmarking and empirical validation are essential for success in multi-location or hybrid cloud settings, and this is where many organizations fall short.
The most common mistake is relying on a single speed test or a vendor's SLA document to validate network performance. Speed tests measure point-in-time throughput between your device and a nearby test server. They do not measure latency consistency, packet loss under load, routing path stability, or performance to your actual cloud workloads.
Effective benchmarking across sites requires a structured approach:
- Baseline every site independently. Measure latency, jitter, packet loss, and throughput from each location to shared resources (data center, cloud regions, SaaS endpoints).
- Test under realistic load conditions. Many performance issues only appear when the network is carrying production traffic. Synthetic load testing during off-peak hours can surface bottlenecks that idle tests miss.
- Validate routing paths, not just endpoints. Use traceroute and path analysis tools to confirm traffic is taking expected routes. Routing asymmetry and suboptimal paths are common in multi-provider environments.
- Monitor continuously, not periodically. One-time assessments miss intermittent issues. Continuous synthetic monitoring from each site catches problems that only occur at specific times or under specific conditions.
For large-scale empirical grounding, RIPE Atlas provides high-volume, geographically distributed measurement data suitable for latency and topology investigation at a scale that individual organizations cannot replicate internally. RIPE Atlas operates thousands of probes worldwide, enabling you to benchmark your network against real-world internet conditions and validate whether your observed latency is consistent with what other vantage points experience.
Cloud routing adds another layer of complexity. Traffic entering and leaving cloud environments can deviate from provider transit intent, with meaningful fractions of vantage points exiting cloud WAN networks early at far-away edges. This affects observed latency and makes performance routing strategies beneficial for specific site and region pairs. Validating your actual cloud routing paths, rather than assuming the provider's backbone is always optimal, is a critical step for any enterprise with latency-sensitive workloads.
Pro Tip: Map your cloud regions to the physical locations of your heaviest user populations before committing to a cloud architecture. A workload deployed in a region that routes traffic through a distant exchange point can introduce 40 to 80ms of avoidable latency for a significant portion of your users.
For enterprise-scale monitoring, the combination of continuous synthetic monitoring, flow telemetry, and external measurement platforms like RIPE Atlas gives you the empirical foundation to validate SLA claims, identify routing anomalies, and make infrastructure decisions based on data rather than assumptions. Understanding cloud migration and infrastructure decisions is also critical when planning how your network will interact with cloud-native services.
A critical perspective: Going beyond device monitoring for actual results
Here is an uncomfortable truth most monitoring guides avoid: checking that devices are up is not network management. It is the minimum viable activity that keeps you from being completely blind. The gap between "devices are up" and "network is performing as required" is where most incidents live.
Single-method monitoring, specifically SNMP-only environments, creates a false sense of control. Engineers see green dashboards and assume everything is fine. Meanwhile, a critical application is experiencing 300ms latency spikes because a cloud provider is routing traffic through a suboptimal path. The SNMP dashboard shows nothing wrong because no interface is down and no threshold is breached.
SNMP alone cannot answer "who is generating the traffic" questions. Combining SNMP polling with flow and telemetry attribution is necessary for practical root-cause workflows. This is not a feature preference. It is an operational requirement for any network that carries business-critical traffic.
The business risk of unvalidated provider routes is surprisingly high. Many organizations sign cloud or WAN contracts, deploy their infrastructure, and never empirically verify that traffic is taking the paths they expect. When performance issues surface, the troubleshooting process starts from scratch because there is no baseline to compare against.
Multi-source observability changes this. When you have SNMP counters, flow telemetry, synthetic path monitoring, and external measurement data all feeding into a correlated platform, root cause identification shifts from hours of manual investigation to minutes of automated analysis. The advanced sensor strategies that modern platforms support make this correlation possible at scale, across hundreds of devices and sites simultaneously.
Continuous improvement requires measurement. Teams that track MTTD and MTTR monthly, review alert accuracy, and audit monitoring coverage regularly consistently outperform those that treat monitoring as a set-and-forget function. The operational discipline of treating your monitoring stack as a product that needs ongoing investment is what separates high-performing network teams from those perpetually in reactive mode.
Next steps: Advanced network infrastructure solutions for MSPs & enterprises
For organizations ready to act, advanced network infrastructure solutions can make a major difference in daily operations and future-proofing your environment against growing complexity.
Netverge is built specifically for MSPs and multi-location enterprises that need unified visibility, not another siloed tool. The platform combines AI-powered monitoring with intelligent anomaly detection, automated ticket triage, and correlated event management across all your sites and device types. You get SNMP polling, flow telemetry, synthetic monitoring, and knowledge graph documentation in a single interface, with AI agents that diagnose and resolve issues autonomously.
For physical visibility at distributed sites, Vergepoints are plug-and-play observability hardware units that deploy in minutes and immediately begin feeding telemetry into the Netverge platform. No complex configuration, no vendor-specific expertise required. Whether you are managing 10 client sites or 500 enterprise locations, Netverge scales with your operations and gives you the empirical foundation to deliver on your SLA commitments. Request a demo today and see what genuine network observability looks like in practice.
Frequently asked questions
What are the key components of modern network infrastructure?
Key components include switches, routers, firewalls, wireless access points, monitoring systems, and connections to cloud or virtual networks. Modern infrastructure also includes software-defined networking layers, SD-WAN endpoints, and cloud-native gateways that require dedicated visibility and management.
Why isn't SNMP alone enough for enterprise-scale monitoring?
SNMP alone provides device status and interface counters but cannot show which users or applications are generating traffic, making it insufficient for root-cause analysis in complex environments. Flow telemetry is required to answer traffic attribution questions that SNMP cannot address.
How does proactive monitoring improve network reliability?
Proactive monitoring detects issues before users report them, supports automated incident response, and reduces both MTTD and MTTR compared to reactive approaches. Organizations using proactive, NOC-style operations with defined SLA constructs consistently experience fewer extended outages and lower security incident rates.
What is RIPE Atlas and how can it be used?
RIPE Atlas is a distributed measurement network that enables enterprises to benchmark latency and topology across geographically distributed vantage points. RIPE Atlas data is suitable for validating provider SLA claims, identifying routing anomalies, and comparing your network performance against real-world internet baselines.
How do cloud routing choices impact network performance?
Cloud traffic routing can deviate from provider transit intent, with traffic exiting cloud WAN networks at far-away edges and introducing unpredictable latency. Validating actual routing paths and applying performance routing strategies is important for any organization with latency-sensitive workloads in cloud environments.