
Manual network troubleshooting is a bottleneck most IT teams know intimately. A critical link goes down at a remote site, tickets pile up, and an engineer spends hours running through checklists before identifying the root cause. That model is no longer acceptable when uptime defines service quality. Automated network diagnostics is the process of running predefined workflows, rules, tests, and scripts against live network telemetry to analyze behavior, identify likely issues, and return actionable root-cause information directly to the operators who need it. This guide covers what it is, how it works operationally, and what best practices apply for modern IT teams and MSPs.
Table of Contents
- What is automated network diagnostics?
- How does automated diagnostics work in practice?
- Proactive versus reactive network diagnostics
- Limitations and edge cases in diagnostic automation
- Measuring the impact: Operational speed and ROI
- The overlooked reality: Why evidence-driven automation (not black boxes) delivers the most value
- Get started with automated network diagnostics
- Frequently asked questions
Key Takeaways
| Point | Details |
|---|---|
| Faster troubleshooting | Automated diagnostics streamline root cause analysis, saving IT teams hours on every incident. |
| Proactive problem detection | Continuous health checks and anomaly detection help spot network issues before users are affected. |
| Evidence-based workflows | Rule-driven modules provide traceable, actionable outputs for both tickets and operator review. |
| Understand the limits | Automation can miss faults without comprehensive, model-based procedures, so operator validation remains crucial. |
| Real ROI | Large enterprises report cutting incident detection from hours to seconds and speeding IT improvements overall. |
What is automated network diagnostics?
With the problem framed, let's define what automated network diagnostics actually means for your role.
At its core, automated network diagnostics collects data that sits outside standard alert coverage to diagnose issues and analyze root cause. It uses DiagnosticSource modules that can be triggered manually by an operator or automatically when an alert condition fires. The distinction from passive monitoring is critical: monitoring tells you something is wrong; automated diagnostics tells you why.
The technology stack typically involves three building blocks:
- Telemetry collection: Continuous ingestion of device state, interface counters, routing tables, and flow data from across the network
- Diagnostic execution engine: A rules-based or scriptable layer that maps alert conditions to specific diagnostic procedures
- Root cause reporting: Structured output that correlates evidence into a readable, actionable summary attached to a ticket or dashboard
Here is how automated diagnostics compares directly to manual network operations:
| Dimension | Manual troubleshooting | Automated network diagnostics |
|---|---|---|
| Time to root cause | 2 to 16 hours (average) | Seconds to minutes |
| Evidence quality | Operator-dependent | Consistent, traceable |
| Scalability | Limited by headcount | Scales to thousands of devices |
| Repeatability | Variable | Rule-driven, uniform |
| Ticket enrichment | Manual notes | Auto-attached evidence |
The automated data collection benefits go well beyond speed. You eliminate transcription errors, you standardize evidence collection across sites, and you free engineers to focus on remediation rather than data gathering. For MSPs juggling 50 or more client networks, that standardization is genuinely transformative.
A network monitoring platform overview from an AI-powered vendor will typically combine sensors, anomaly detection, and diagnostic modules in one interface, reducing the tool sprawl that makes correlation so difficult in fragmented environments. The broader shift toward enterprise network automation is accelerating because the economics are clear: fewer manual hours per incident, lower error rates, and faster resolution benchmarks.
How does automated diagnostics work in practice?
Now that we understand what it is, let's explore how automated diagnostics actually works in enterprise settings.
The standard workflow follows a four-stage sequence: Trigger → Data Collection → Diagnostic Execution → Root Cause Reporting. Each stage is automated with defined inputs and outputs, making the entire chain repeatable and auditable.
- Trigger: An alert fires (interface down, latency threshold exceeded, BGP route withdrawal) or a scheduled task initiates a health check.
- Data collection: The engine pulls targeted telemetry, route tables, device logs, and path traces specific to the affected segment, gathering data outside the scope of routine polling.
- Diagnostic execution: Reusable diagnostic modules and rules run against the collected data, applying predefined procedures to test each likely fault hypothesis.
- Root cause reporting: Evidence is correlated, ranked by confidence, and attached to the relevant ticket or incident record with structured output.
In multi-site enterprise and MSP workflows, incident-triggered diagnostics map the affected network path and execute the right diagnostic sequence before routing results back to the ticket. This means a Jira or ServiceNow ticket can arrive at an engineer's queue already enriched with traceroute results, interface error counts, configuration snapshots, and probable cause statements. The engineer skips the data-gathering phase entirely and moves straight to resolution.
Pro Tip: Build your diagnostic modules with operator override in mind. Automation should accelerate analysis, not remove human judgment. Ensure engineers can add manual steps to any automated workflow, particularly for edge cases involving third-party circuits or vendor-specific device quirks.

Consider a practical MSP scenario. A client's branch office in Dallas loses connectivity to the corporate data center at 2:47 AM. The alert fires automatically, the diagnostics engine captures device state across five hops, runs path analysis, identifies a misconfigured static route pushed in the previous change window, and attaches all evidence to the ticket. By the time the on-call engineer receives the page, they already know what happened and where. Resolution time drops from 90 minutes to under 15.
The step-by-step hosting workflow principles that apply to high-availability infrastructure are directly relevant here: structured, documented, repeatable procedures outperform ad-hoc approaches in both speed and reliability. That same philosophy applies to diagnostic automation.
For teams using AI-driven outage triage, the diagnostic workflow integrates with intelligent ticket prioritization, routing the most severe incidents to senior engineers while handling routine faults automatically. Combined with IT ticketing integration, this creates a closed-loop system where every diagnostic run produces traceable output that feeds back into your knowledge base.
Proactive versus reactive network diagnostics
Understanding workflows sets the stage for contrasting proactive and reactive automation strategies.
Most organizations start with reactive diagnostics: something breaks, the automation runs, and the fix gets applied faster than manual processes allow. That alone delivers significant value. But the real operational gains come when you shift to proactive diagnostics.
Proactive diagnostics continuously assess health and performance against known-outage patterns, running "Golden" checks that compare current device configuration and state against a verified baseline. When drift is detected, an alert fires before users notice a degradation.
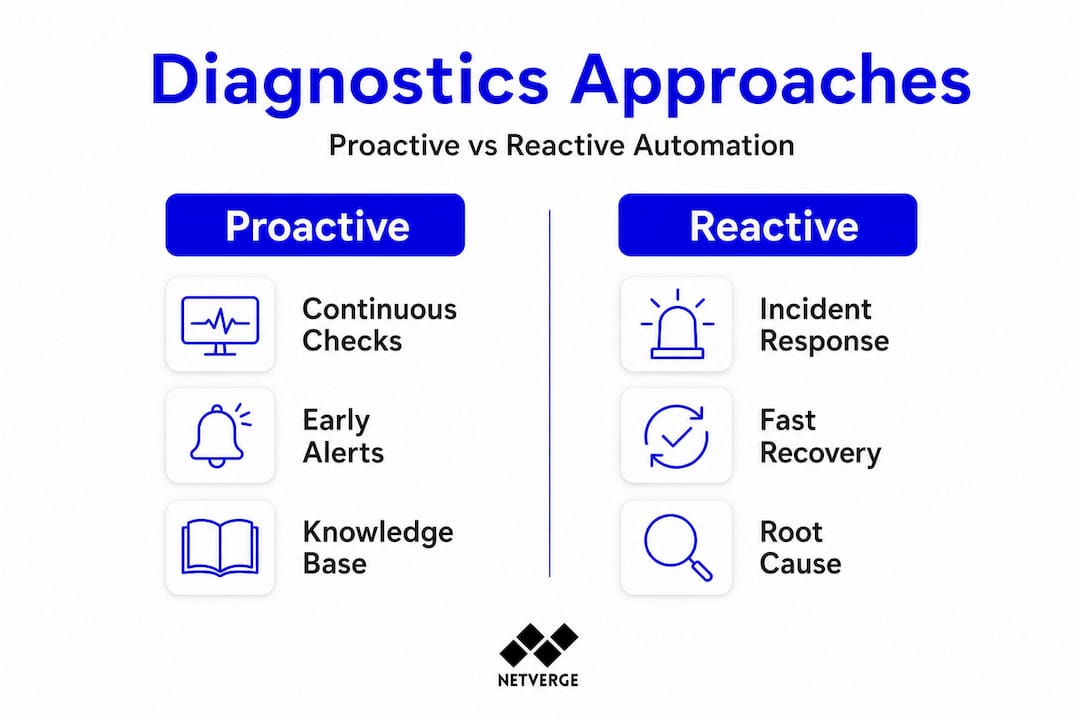
Reactive diagnostics: what it covers
- Incident-triggered root cause analysis
- Post-mortem evidence collection after an outage
- Alert enrichment for active tickets
- On-demand diagnostic runs initiated by operators
Proactive diagnostics: what it adds
- Continuous configuration drift detection
- Scheduled health assessments against Golden baselines
- Anomaly detection across traffic patterns, routing tables, and device state
- Prevention of repeat incidents by encoding lessons from past outages into reusable checks
"The networks most resistant to repeat incidents are those where lessons from past outages are systematically encoded into automated checks, not just documented in runbooks that engineers may or may not consult during a high-pressure incident."
For network health monitoring to deliver full value, you need both layers working together. Reactive automation ensures fast resolution when things go wrong. Proactive automation shrinks the window during which issues can develop undetected. Using network visibility sensors, you can instrument every segment of a distributed network, giving the proactive engine enough data to detect subtle anomalies well before they become customer-impacting events.
Pro Tip: Integrate your proactive diagnostic results into a 360 network monitoring view and pair it with SIEM dashboard integration for security correlation. Configuration drift that looks like a performance issue can sometimes indicate unauthorized change activity.
Knowledge libraries are another proactive asset. When a diagnostic run resolves an incident, the evidence and resolution steps can be stored as a reusable procedure. The next time a similar fault pattern appears, the engine matches it against the library and executes the proven resolution path, often without human intervention.
Limitations and edge cases in diagnostic automation
While the benefits are substantial, it's vital to recognize where automation can fall short.
Automated diagnostics is not infallible. The quality of output depends heavily on the quality of the underlying models and the completeness of data collection. Several failure modes are worth understanding before you build out a production environment.
Common edge cases where automation underperforms:
- Incomplete network models: If the diagnostic procedure only covers part of the forwarding path, it may miss faults in uncovered segments. Model-based diagnosis aims to systematically derive end-to-end procedures from an explicit model of forwarding and routing to cover both data-plane and control-plane faults. Without that model completeness, results will be partial.
- Novel fault patterns: Diagnostic rules are built on known failure signatures. A genuinely new fault class, such as a firmware bug on a recently deployed device model, may produce telemetry that none of the existing modules recognize.
- Black-box AI outputs: Some vendors offer fully opaque AI diagnosis with no traceable logic. When those systems are wrong, engineers have no evidence trail to audit, which erodes trust and slows resolution.
- Sparse telemetry coverage: Remote sites with minimal sensor deployment generate insufficient data for confident root cause correlation.
- Vendor-specific gaps: Proprietary devices that do not expose standard APIs or SNMP may fall outside the diagnostic engine's reach.
"Automation that cannot explain its reasoning is difficult to trust in production. The most operationally reliable diagnostic systems combine rule-driven, explainable logic with AI-assisted pattern recognition, giving engineers a clear evidence trail alongside the conclusion."
Event lifecycle tracking becomes essential in these scenarios. When automated diagnostics return inconclusive results, the event record should preserve all collected evidence so that an engineer can continue from where the automation stopped, rather than starting from scratch. This is a design requirement, not an afterthought.
You can also supplement native diagnostics with external network tools for path testing and reachability checks in segments that your primary platform cannot directly instrument.
Measuring the impact: Operational speed and ROI
As a final piece, let's examine the measurable results organizations are reporting.
The business case for automated network diagnostics is grounded in hard operational data. Cisco IT data shows manual detection times of 2 to 16 hours cut to as little as 41 seconds with automated AI alerts, alongside 59% faster software upgrade times after implementing automated systems. Those are not incremental improvements; they represent a fundamentally different operational model.
Key metrics to track in your environment:
- Mean Time to Detect (MTTD): How quickly does the system identify a fault after it occurs? Automation typically reduces this to seconds.
- Mean Time to Resolve (MTTR): From detection to resolution, what is the elapsed time? Enriched tickets directly shorten this metric.
- Diagnostic accuracy rate: What percentage of automated root cause conclusions are confirmed correct by engineers? Track this over time to improve module quality.
- Alert-to-ticket enrichment rate: What share of alerts arrive at engineers with structured diagnostic evidence already attached?
- Repeat incident rate: Are known fault patterns recurring? A proactive diagnostic library should drive this metric toward zero for covered fault classes.
Results vary by vendor, network scale, and deployment maturity. A greenfield MSP deployment on a standardized infrastructure stack will see faster gains than a mature enterprise with 15 years of heterogeneous device diversity. The important practice is to baseline each metric before deployment and track it systematically post-deployment.
For teams using monitoring automation, dashboards should surface these KPIs automatically, giving team leads and executive stakeholders a real-time view of operational efficiency gains. That visibility supports continued investment in automation and helps justify the platform costs to finance and operations leadership.
The overlooked reality: Why evidence-driven automation (not black boxes) delivers the most value
Having reviewed the technology, real cases, and caveats, here's what truly matters for IT leaders looking to deploy automated diagnostics today.
There is a recurring pattern across enterprise deployments: organizations that adopt fully opaque, AI-only diagnostic tools initially see impressive demo results, then encounter trust problems in production. When an automated conclusion is wrong and there is no evidence trail to audit, engineers stop relying on the system. Adoption collapses. The tooling investment is wasted.
The more durable approach is what we call "rule-first, evidence-always." Every automated diagnostic run should produce a traceable record of what data was collected, which rules or procedures were applied, and what evidence supported the conclusion. This is not just about transparency for its own sake. It is about giving engineers the ability to validate, override, and improve the system over time.
Scaling diagnostic automation across large, heterogeneous networks exposes another hard reality: no single vendor's diagnostic library covers every device type, protocol, or topology. The organizations that scale successfully treat their diagnostic module library as a living asset, continuously adding new rules based on resolved incidents and encoding those lessons into future automation.
The final lesson is about operator control. Automation should accelerate human decision-making, not replace it in high-risk scenarios. Change windows, circuit failovers, and configuration rollbacks benefit enormously from automated evidence collection, but the execution decision should remain with a qualified engineer unless you have extremely high confidence in the automation's accuracy for that specific scenario.
A well-designed practical ticket workflow integrates these principles: automation enriches and routes tickets with evidence, but engineers retain clear control over resolution actions. That balance is where automated diagnostics delivers sustained, long-term value.
Get started with automated network diagnostics
If you're ready to operationalize these insights for your organization, here's how to take the next step.
Netverge brings together everything this guide has covered into a single, AI-powered platform built specifically for MSPs and multi-site enterprises. You get real-time telemetry, automated diagnostic workflows, intelligent ticket triage, and a unified dashboard that surfaces root cause evidence before your engineers even open a ticket.

Our automated monitoring solutions handle continuous proactive assessment across every site in your network. The AI-powered service desk closes the loop between diagnostics and resolution, attaching structured evidence to every incident automatically. And if you need physical visibility at distributed locations, deploy plug-and-play hardware with Vergepoints to extend sensor coverage without complex installation. Start your free trial or request a demo to see how Netverge transforms your diagnostic workflow from reactive firefighting to proactive network control.
Frequently asked questions
How does automated network diagnostics differ from regular network monitoring?
Automated diagnostics initiates targeted tests and returns root-cause evidence, while monitoring detects issues and sends alerts. Specifically, automated diagnostics collects data outside alert coverage to diagnose issues and analyze root cause rather than simply flagging that a threshold was crossed.
Which networks benefit most from automated diagnostics?
Large multi-site enterprises and MSPs managing diverse, complex infrastructures gain the most from automation. Incident-triggered diagnostics are especially valuable in these environments where manual triage across dozens of sites is operationally impractical.
Can automated diagnostics prevent downtime?
Yes, when combined with proactive assessment, anomaly detection, and knowledge libraries built from previous outages. Continuous health assessments against Golden baselines detect configuration drift and known-outage patterns before users experience any impact.
Is automated diagnosis ever unreliable?
Yes, automated routines may miss faults if diagnostic models or collected evidence are incomplete. Automated diagnosis can fail when the diagnostic procedure does not align with the underlying networking model, particularly when only a subset of the forwarding plane is covered.
What improvements can IT teams expect with automation?
Many organizations see network outage detection times reduced from hours to seconds, plus faster software rollouts. Manual detection times of 2 to 16 hours have been cut to as little as 41 seconds with automated AI alerts, based on Cisco's own reported IT operations data.