
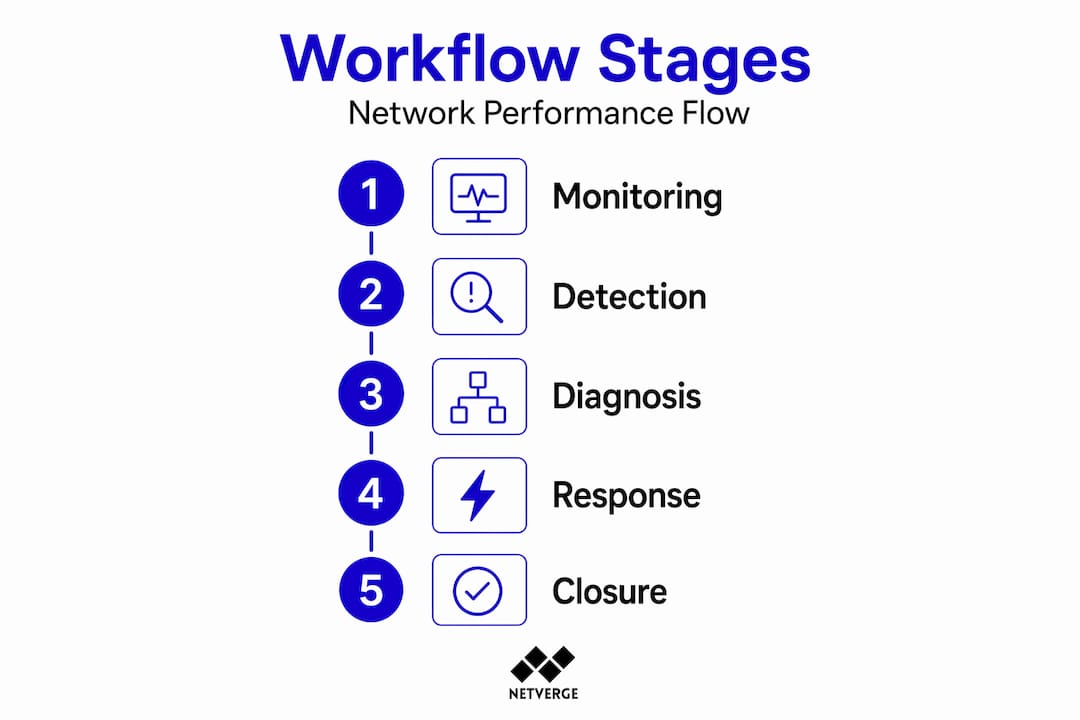
Most enterprise IT teams don't fail at monitoring. They fail at workflow. Alerts fire, engineers scramble, tickets open and close without clear data, and the same root causes resurface three months later. A well-designed network performance management workflow changes that pattern. It converts reactive chaos into a repeatable, evidence-backed process, from initial detection through resolution and post-incident improvement. This guide walks you through every stage: prerequisites, execution, incident handling, telemetry analysis, and verification, with enough specificity to actually implement, not just conceptualize.
Table of Contents
- Key takeaways
- Prerequisites for your network performance management workflow
- Executing continuous monitoring and incident detection
- Incident management: from logging to closure
- Telemetry data and layered analysis for root cause identification
- Verifying performance with operational dashboards
- My take on what actually separates good workflows from bad ones
- How Netverge supports your monitoring workflow
- FAQ
Key takeaways
| Point | Details |
|---|---|
| Define SLOs before building alerts | Set availability targets and error budgets first so your alerting thresholds reflect real service commitments. |
| Use multi-location verification | Confirm issues from multiple regions before triggering alerts to eliminate false positives and reduce fatigue. |
| Follow structured incident triage | Apply ITIL-aligned categorization and OSI-layer troubleshooting to speed escalation and cut resolution time. |
| Combine SNMP and NetFlow telemetry | SNMP identifies device health; NetFlow reveals traffic sources. Use both sequentially for complete visibility. |
| Track MTTR and error budget consumption | Operational dashboards that show these metrics help you prioritize improvements before SLOs are breached. |
Prerequisites for your network performance management workflow
Before you touch a monitoring dashboard or configure a single alert, you need three things in place: the right data sources, defined performance targets, and an alerting structure that doesn't bury your team in noise.
Monitoring platform requirements
Your platform needs to support at least SNMP, NetFlow, and API-based telemetry collection. SNMP handles device health and interface counters. NetFlow captures conversation-level traffic data. Without both, you're working with incomplete information. If you manage multiple locations, you also need multi-location monitoring agents so you can measure availability and latency from more than one geographic vantage point. A single agent can miss regional failures that users experience directly.
Service level objectives and error budgets
Define your SLOs before configuring anything else. A 99.9% availability target translates to roughly 43.8 minutes of allowed downtime per 30-day period. That number should drive every threshold decision you make. Error budgets, the remaining allowable downtime before an SLO is breached, give your team a shared metric for prioritizing work and knowing when to halt feature deployments in favor of reliability work.
The table below shows how common SLO targets map to practical downtime allowances:
| SLO Target | Monthly Downtime Budget | Weekly Budget |
|---|---|---|
| 99.0% | ~7.3 hours | ~1.7 hours |
| 99.5% | ~3.7 hours | ~51 minutes |
| 99.9% | ~43.8 minutes | ~10 minutes |
| 99.95% | ~21.9 minutes | ~5 minutes |
Alert cadence and noise reduction
Alerting intervals should reflect system criticality. Use 1-minute check intervals for core infrastructure, 5-minute intervals for standard production systems, and 15-minute intervals for non-critical assets. Pair each alert with multi-location verification before notification fires. If only one monitoring location reports an issue, hold the alert. If two or more locations confirm it, escalate immediately.
Pro Tip: Configure your alerting platform to suppress duplicate alerts from the same root cause. Correlation logic that groups related alerts into a single incident ticket prevents your on-call engineer from receiving 40 notifications about one failed switch.
For a deeper look at alert types and how to configure them without drowning your team, review Netverge's breakdown of network alert categories.
Executing continuous monitoring and incident detection
With your prerequisites in place, the operational workflow begins with continuous monitoring. This is where most teams have the most to gain from structure and automation.
Establish polling intervals by system tier. Assign your 1, 5, and 15-minute check cadences to device groups before go-live. Don't treat this as a one-time setup. Review tier assignments quarterly as infrastructure changes.
Run checks from at least two geographic locations. Multi-location verification prevents false positives caused by local monitoring agent failures. If your monitoring node goes offline, you should not generate a P1 ticket for every device it was watching.
Integrate alert routing with your incident channels. Multi-channel alert delivery, covering email, Slack, webhooks, and SMS, should be tuned by severity. P1 alerts wake someone up. P3 alerts appear in a Slack channel for review during business hours. The routing logic is as important as the alert threshold itself.
Automate early detection with anomaly baselines. Static thresholds miss gradual degradation. A circuit that normally runs at 40% utilization hitting 80% is meaningful even if it's below your hard threshold. Baselining establishes what "normal" looks like per device and per time window, so anomaly detection fires before users call the helpdesk.
Log every triggered alert with a timestamp and source. Even alerts that auto-resolve should create a record. Pattern analysis across auto-resolved alerts often reveals intermittent issues that never escalate but indicate underlying instability.
Test your detection workflow monthly. Simulate a failure on a non-production device and confirm that alerts fire, route correctly, and arrive within your defined response window. Detection workflows degrade silently when monitoring agents lose connectivity or API credentials expire.
Pro Tip: Use automated network diagnostics to run initial checks automatically when an alert fires. Pre-populated diagnostic data in the ticket cuts the first five minutes of every incident response.
Incident management: from logging to closure
Detection without structured response is just noise with extra steps. The incident management phase of your network performance management workflow needs defined intake, triage, escalation, and closure steps.

Structured intake and logging
Every incident record should capture: timestamp, affected device or circuit, alert source, initial severity, and the name of the first responder. These fields are non-negotiable. Missing them makes post-incident review unreliable. Use a template in your ticketing system so intake is consistent regardless of who opens the ticket.
Categorization and prioritization
ITIL incident management defines prioritization by two axes: impact (how many users or services are affected) and urgency (how quickly the situation will worsen without intervention). A WAN circuit down at a primary site is high impact and high urgency. A single workstation with elevated packet loss is low impact and low urgency. Your priority matrix should drive automatic SLA timers in your ticketing system, not engineer judgment calls made under pressure.
The table below compares ad hoc versus structured incident prioritization:
| Approach | Escalation Logic | SLA Consistency | Knowledge Retention |
|---|---|---|---|
| Ad hoc triage | Based on who's available | Inconsistent | Low |
| ITIL-aligned structured triage | Based on impact and urgency scores | Consistent | High |
Layered troubleshooting with time boundaries
OSI model-guided troubleshooting with strict time budgets per layer is one of the most effective ways to reduce mean time to resolution. The discipline is simple: spend no more than 10 minutes investigating each OSI layer before documenting your findings and moving up or escalating to the next tier. This prevents the common failure mode where one engineer spends 45 minutes at Layer 3 while a Layer 1 physical fault sits unexamined.
Key practices for this phase include:
- Document evidence at each layer, not just conclusions
- Update the incident ticket every 10 minutes with findings
- Define clear escalation triggers so Tier 1 hands off to Tier 2 without delay
Incident closure and knowledge retention
Proper incident closure requires user confirmation that the issue is resolved, a root cause entry in the ticket, and an update to any affected runbooks or knowledge base articles. Teams that skip closure documentation repeat the same diagnostic steps on every recurrence. Close the loop every time, not just for major incidents.
Telemetry data and layered analysis for root cause identification
SNMP and NetFlow serve different diagnostic questions. Knowing which to use first, and when to switch, is a core performance optimization strategy.
SNMP telemetry excels at interface-level health data: error rates, CRC counts, interface utilization, and device CPU and memory. It answers "Is this device or interface healthy?" NetFlow answers "Who is sending what to whom?" SNMP can tell you a circuit is saturated. NetFlow tells you which IP conversation is causing the saturation. Using only SNMP risks missing traffic-level issues that don't register as device errors but still degrade user experience.
The recommended two-stage approach:
- Stage 1 (SNMP): Confirm interface health, error counters, utilization percentages, and device resource consumption. Identify which interface or device is the likely fault point.
- Stage 2 (NetFlow): Drill into traffic flows on the identified interface. Find source and destination pairs, application protocols, and conversation volume to pinpoint root cause.
This sequential process is faster than running both simultaneously because Stage 1 narrows the scope for Stage 2 analysis.
Pro Tip: If your monitoring platform doesn't correlate SNMP counters and NetFlow data in the same interface, you'll spend more time context-switching between tools than actually troubleshooting. Integrated network infrastructure monitoring that combines both telemetry types in one view cuts diagnostic time significantly.
Continuous performance optimization also requires tracking telemetry trends over time, not just during incidents. Weekly reviews of utilization percentiles, error rate trends, and latency baselines reveal capacity problems and configuration drift before they generate user-reported incidents.
Verifying performance with operational dashboards
The verification phase closes the loop on your network efficiency tracking. Dashboards are your mechanism for confirming that the workflow is producing results and that SLOs remain intact.
Every operational dashboard used for network performance should display these metrics at minimum:
| Metric | Update Cadence | Primary Audience |
|---|---|---|
| Availability percentage | Real-time | Operations, management |
| Error budget remaining | Hourly | Engineering, operations |
| Incident frequency (7-day rolling) | Daily | Operations team |
| MTTR (30-day rolling average) | Daily | Engineering leads |
| Latency percentiles (p50, p95, p99) | Real-time | Engineering |
One often-overlooked requirement: use external monitoring data for availability calculations, not internal health checks. An internal check only knows if your monitoring agent can reach a device. External monitoring confirms that real users in real locations can access your services. These are not the same measurement, and the gap between them is where SLO violations hide.
Update your dashboards on two cadences: real-time operational views for the NOC team, and weekly engineering reviews that analyze trends and inform priority decisions for the next sprint. The engineering review is where dashboard data converts into actual workflow improvements.
My take on what actually separates good workflows from bad ones
I've worked with a lot of network operations teams, and the ones that struggle almost always have the same problem. They've built monitoring, but they haven't built a workflow. There's a difference.
Monitoring tells you something is wrong. Workflow determines what happens next, who does it, how fast, and what gets documented when it's done. I've seen teams with best-in-class monitoring platforms that still have 45-minute MTTR on simple issues because nobody defined the escalation path or the troubleshooting discipline.
The OSI-layer time budget approach, spending no more than 10 minutes per layer before documenting and moving on, sounds rigid until you've watched an engineer spend an hour chasing a routing issue that turned out to be a bad cable. Structure isn't bureaucracy. It's the mechanism that stops wasted effort.
My other strong opinion: SNMP-only monitoring is a silent liability. Teams that rely on it exclusively feel covered until they get a saturation event caused by a single application conversation that never triggered an interface threshold. NetFlow integration isn't optional at enterprise scale. It's how you find the 20% of issues that SNMP will never surface.
Finally, incident closure is not administrative overhead. It's the only way your workflow improves over time. If you're not documenting root causes and updating runbooks, you're building institutional knowledge in people's heads. People leave. Runbooks don't.
— Jim
How Netverge supports your monitoring workflow
If the workflow stages above describe what you want but your current toolset still requires you to switch between multiple platforms to get there, Netverge is worth a direct look.
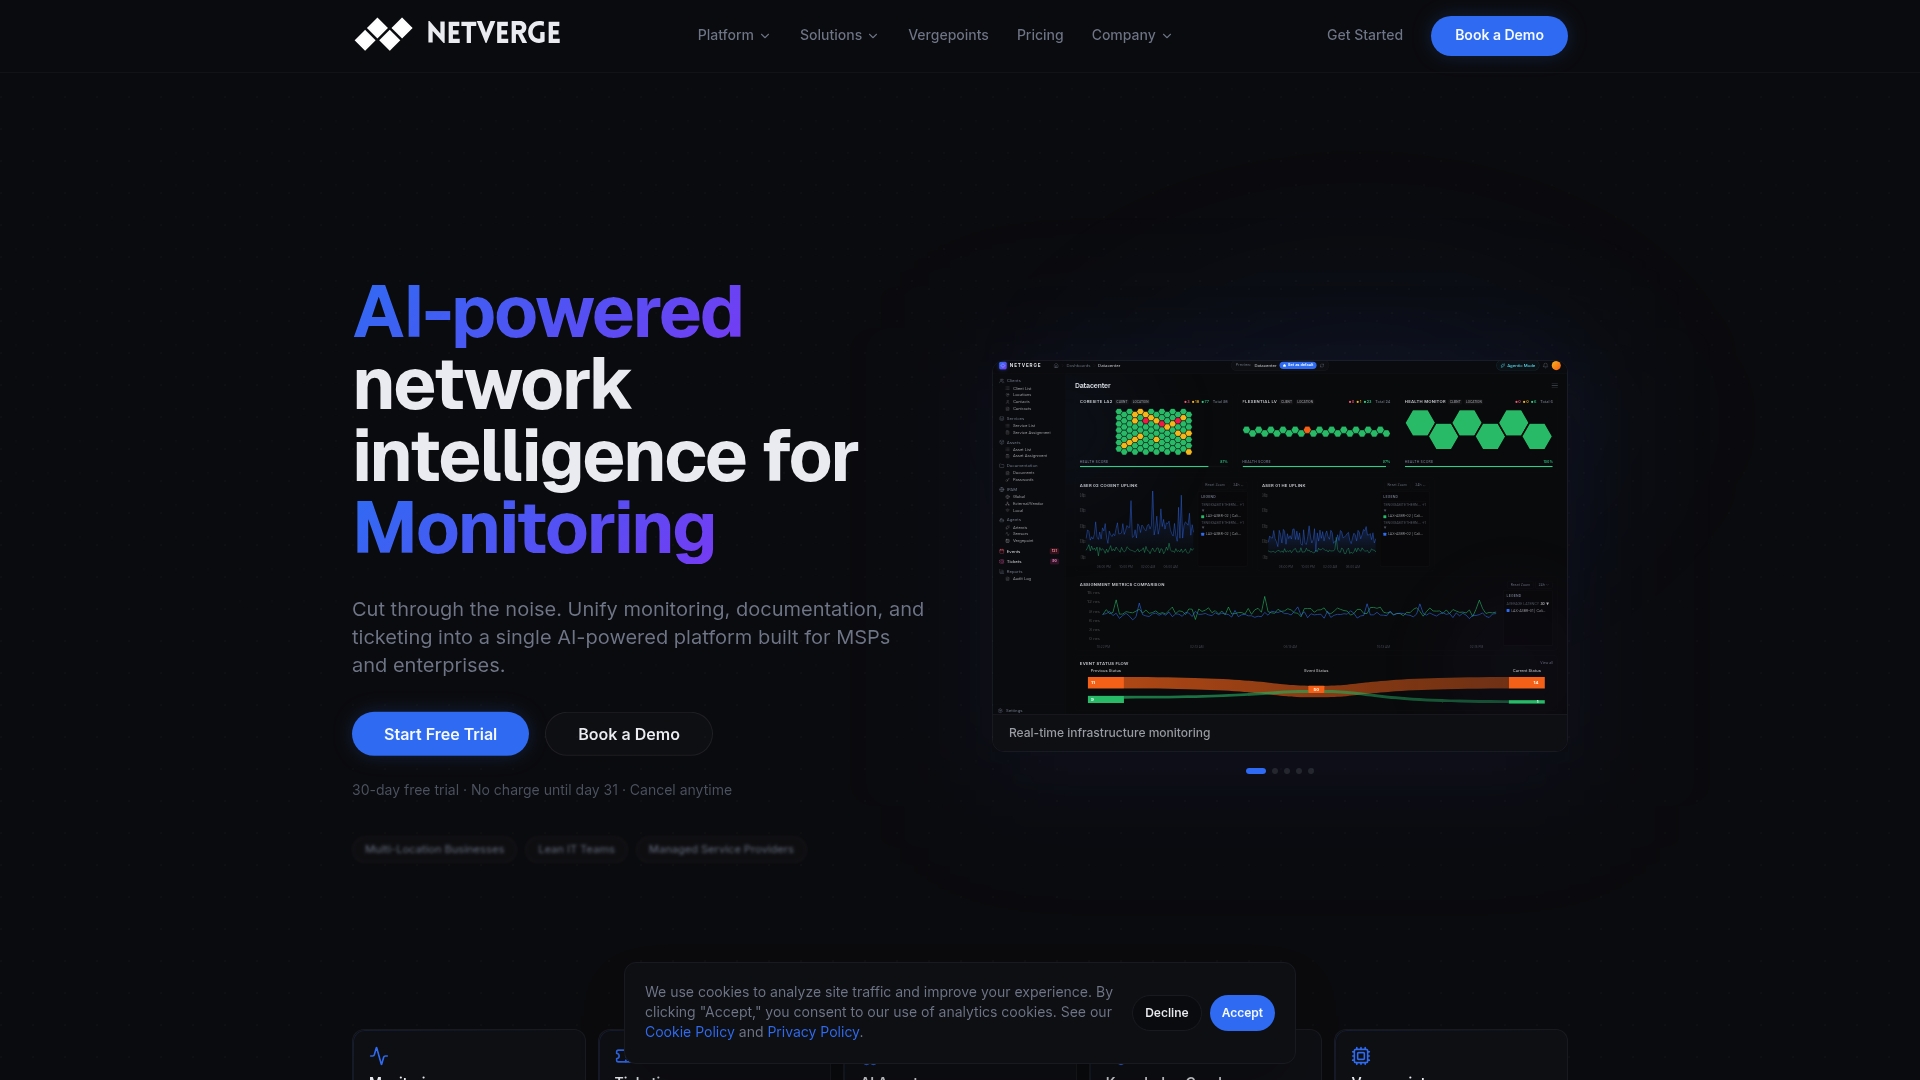
Netverge's AI-powered monitoring platform unifies real-time telemetry, anomaly detection, and automated diagnostics in one interface, removing the context-switching that slows incident response. Its event management module handles the full incident lifecycle from alert detection through closure, with structured intake, AI-assisted triage, and automatic ticket routing built in. For IT teams managing distributed enterprise networks or multi-site MSP environments, Netverge's platform replaces the fragmented tool stack with a single source of truth that actually supports how a disciplined workflow operates.
FAQ
What is a network performance management workflow?
A network performance management workflow is a structured, repeatable process for monitoring, detecting, diagnosing, and resolving network performance issues. It covers everything from alert configuration through incident closure and post-incident review.
How do I reduce alert fatigue in network monitoring?
Use multi-location verification to confirm issues before alerting, assign check intervals based on system criticality, and configure alert correlation to group related events into single tickets rather than sending individual notifications per device.
What metrics belong on a network performance dashboard?
The most useful metrics are availability percentage, error budget remaining, incident frequency, MTTR, and latency percentiles. External monitoring data should feed availability calculations to reflect what users actually experience.
When should I use SNMP versus NetFlow in troubleshooting?
Start with SNMP to identify device health and interface-level issues, then move to NetFlow to find the specific traffic conversations causing the problem. Using both sequentially gives you complete visibility that neither source provides alone.
How does ITIL incident prioritization improve network incident response?
ITIL prioritization scores incidents by impact and urgency, which drives automatic SLA timers and escalation paths. This removes judgment calls under pressure and keeps the right expertise engaged at the right time.