
Network blind spots are not a minor inconvenience. They are the reason security incidents go undetected for weeks and the reason your team spends hours troubleshooting a performance issue that should take minutes to isolate. A disciplined, step by step network visibility approach cuts through that uncertainty. 67% of businesses cite network blind spots as a primary obstacle to protecting sensitive data, particularly in hybrid, cloud, and remote-access environments. This guide gives you a concrete, technical framework for building visibility that actually holds up under real-world conditions.
Table of Contents
- Key takeaways
- Step by step network visibility: the preparation phase
- Physical visibility infrastructure setup
- Integrating flow, packet, and telemetry data
- Validation, troubleshooting, and ongoing maintenance
- My take on network visibility after years in the field
- How Netverge supports your visibility program
- FAQ
Key takeaways
| Point | Details |
|---|---|
| Assess before you deploy | Map your network segments, traffic types, and existing monitoring gaps before purchasing or configuring any new tooling. |
| TAPs beat SPAN for critical segments | Hardware TAPs guarantee 100% packet capture; SPAN ports drop packets under load and are unreliable for compliance monitoring. |
| Unify your data sources | Combining flow data, packet capture, SNMP, and logs into a single platform cuts incident resolution time from hours to seconds. |
| Monitor the monitoring system | Failures in TAPs, brokers, or collectors create silent blind spots; your visibility infrastructure needs its own health checks. |
| Treat visibility as continuous | Network visibility is an ongoing operational process, not a one-time deployment; review and adapt policies regularly. |
Step by step network visibility: the preparation phase
You cannot build reliable visibility without knowing what you are trying to see. Before deploying a single sensor or configuring a single SPAN port, you need a clear picture of your current environment and a defined set of goals.
Identify and categorize your network segments
Start with a full asset inventory. List every segment that carries traffic worth monitoring: data center core, WAN edges, cloud on-ramps, remote access gateways, and any OT or IoT segments. For each segment, document the traffic types (north-south, east-west, encrypted, unencrypted), approximate volume, and the business function it supports. This inventory becomes your comprehensive network visibility checklist.

Use your existing monitoring tools to pull whatever data is already available. SNMP polling, existing flow exports, and firewall logs can reveal a surprising amount about segments you thought were well-covered. Map the gaps explicitly.
Evaluate your current monitoring infrastructure
| Monitoring Component | What to Check | Common Gap |
|---|---|---|
| Flow exporters (NetFlow/IPFIX) | Coverage per device, sampling rates | Missing cloud or SD-WAN segments |
| SNMP polling | Device inventory completeness | No polling on virtual or cloud hosts |
| Packet capture | TAPs or SPAN in place, locations | Critical segments with no packet-level data |
| Log collection | Sources feeding SIEM or collector | Incomplete syslog coverage |
| Cloud telemetry | VPC flow logs, cloud-native metrics | Gaps in multi-cloud or hybrid paths |
After completing this table for your environment, you will have a prioritized list of gaps. Focus first on segments carrying the highest-risk or highest-volume traffic.
- Define visibility goals for each segment: compliance-grade forensic capture, performance baselining, or security event detection.
- Identify tooling you need to acquire: network TAPs, packet brokers, flow collectors, or a unified observability platform.
- Budget for hybrid environments: cloud-native telemetry requires different tooling than physical infrastructure.
- Confirm staffing: who owns monitoring configuration, alert response, and ongoing maintenance?
Pro Tip: Before finalizing your list of required tools, check whether your existing visibility gaps can be addressed through better configuration of assets you already own. A misconfigured NetFlow exporter is a faster fix than procuring new hardware.
Physical visibility infrastructure setup
With your requirements documented, you are ready to deploy the hardware and configurations that will actually capture traffic. This is where most teams make decisions they regret later.
TAPs vs. SPAN ports: choose deliberately
TAPs guarantee 100% packet capture without affecting production traffic. SPAN ports are a switch software function and are treated as low-priority processes. Under load, SPAN ports drop packets silently, with no error counters to alert you to the loss. For compliance monitoring, forensics, or security detection in critical segments, SPAN is not an acceptable substitute for a TAP.
That said, SPAN is not useless. For lower-risk segments, short-term troubleshooting, or environments where TAP installation is not feasible, SPAN provides adequate coverage at zero hardware cost. The practical approach: deploy TAPs in critical segments and use SPAN selectively for secondary or temporary monitoring needs.
Step-by-step physical deployment
- Select TAP placement points. Install passive optical or active copper TAPs at your most critical chokepoints: data center core uplinks, WAN gateway interfaces, cloud on-ramp connections, and any segment subject to compliance requirements.
- Configure SPAN ports for secondary segments. On switches where TAP installation is not justified, configure dedicated SPAN sessions targeting monitoring tool interfaces. Limit each SPAN session to the specific VLANs or ports you need.
- Install and configure a packet broker. Connect TAP and SPAN outputs to a packet broker. The broker aggregates traffic from multiple capture points, filters out irrelevant traffic (ICMP keepalives, multicast noise), deduplicates packets, and load-balances the remaining traffic to your monitoring tools.
- Connect monitoring tools. Route specific traffic streams from the packet broker to the right tools: full packet capture to your network forensics platform, filtered streams to your IDS, and sampled flows to your NPM solution.
- Validate capture completeness. Generate known traffic (a controlled file transfer or synthetic transaction) across each monitored segment and confirm it appears in your capture tool with no gaps.
Pro Tip: Passive optical TAPs require no power and fail open, meaning they pass traffic even if the TAP itself fails. For segments where continuous packet capture is non-negotiable, passive optical TAPs are the most reliable choice.
Common pitfalls to avoid
- Oversubscribing a packet broker port by aggregating more traffic than its throughput rating
- Configuring SPAN to mirror both ingress and egress on the same port, which duplicates packets and skews analysis
- Placing TAPs only at the perimeter while ignoring east-west traffic between server segments
- Neglecting encrypted traffic: know which segments carry TLS and plan for decryption or metadata-only analysis
Integrating flow, packet, and telemetry data
Capturing packets at the wire level is only part of the picture. Improving network visibility at scale requires pulling together multiple data types and correlating them in a single platform.
The four core data sources
- NetFlow/IPFIX/sFlow: Flow records provide conversation-level visibility across the entire network without storing full packet payloads. Configure exporters on all routers, switches, and firewalls. Adjust sampling rates per segment risk level: high-risk segments warrant 1:1 sampling; lower-risk segments can tolerate higher sampling ratios to reduce collector load.
- Full packet capture: Reserved for segments where forensic-level analysis is required. Storage-intensive but irreplaceable for incident investigation.
- SNMP metrics and traps: Device health data (CPU, memory, interface utilization, error counters) provides context for correlating network events with device conditions.
- Structured logs: Firewall deny logs, authentication events, and routing protocol changes fill gaps that flow and packet data cannot.
Building a unified data pipeline
Unified observability combining SNMP, flow data, and logs into a single platform reduces incident resolution from hours to seconds. The key is normalization: every data source needs to emit timestamps, device identifiers, and interface references in a consistent format so the platform can correlate events across sources.
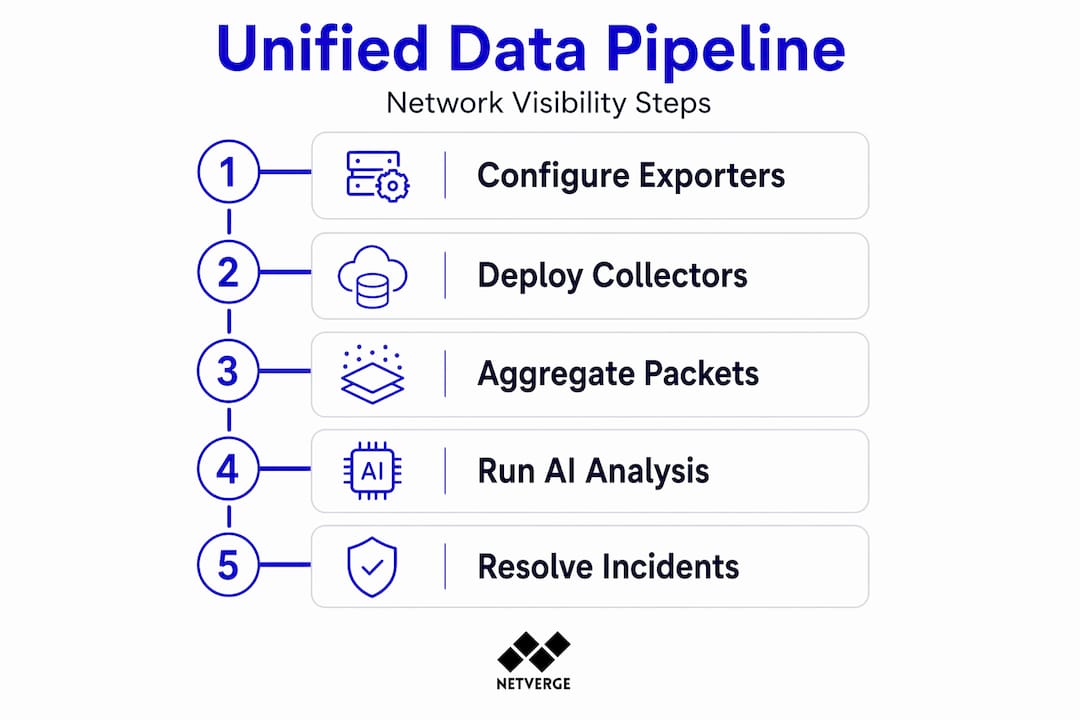
Set up your data pipeline in this sequence: configure exporters and log forwarders first, then deploy collectors with sufficient capacity, then apply normalization rules, and finally configure correlation rules that link flow anomalies with device health degradation or log events.
Pro Tip: Aggregating packets into 30-second windows with 25% traffic sampling can reduce log volume by up to 83% without losing visibility into overall traffic patterns. Apply this technique on high-volume, lower-risk segments to keep your collector infrastructure manageable.
AI-driven analysis changes what is possible here. AI tools automate triage by correlating network events, analyzing device context, and generating root cause assessments in real time. This is not a luxury for large teams. For MSPs and lean IT departments managing distributed infrastructure, AI-assisted alerting is what makes this level of telemetry operationally sustainable. Platforms like Netverge's AI-powered monitoring apply this correlation automatically, reducing alert fatigue and accelerating triage without requiring manual rule tuning for every scenario.
Validation, troubleshooting, and ongoing maintenance
Getting visibility infrastructure deployed is not the finish line. Verification and continuous maintenance are what separate a reliable visibility program from one that fails silently.
Validating your setup
- Run baseline traffic tests. Send synthetic transactions across each monitored segment and verify end-to-end capture in your analysis platform. Confirm timestamps, direction, and payload completeness.
- Check for packet loss at every collection point. Review TAP and packet broker counters. Any drop counters incrementing under normal load indicate oversubscription or misconfiguration.
- Audit flow export coverage. Pull a list of all actively routing devices and compare it to your list of configured flow exporters. Gaps here mean blind spots in your traffic analysis.
- Verify alert triggering. Simulate a known condition (a port scan, a high-bandwidth transfer) and confirm your correlation platform generates the expected alert within your defined SLA.
- Test failover behavior. Disable a TAP or collector and confirm that your platform flags the loss of visibility rather than silently continuing to report "all clear."
"Visibility infrastructure components must be continuously monitored. Failure in TAPs or packet brokers can blind security and performance monitoring tools entirely, with no automatic indication that data collection has stopped."
Ongoing maintenance practices
Network visibility is a continuous process, not a one-time deployment. Your network changes. New segments get added, cloud workloads spin up and down, and traffic volumes shift. Your visibility infrastructure must keep pace.
Document every TAP placement, SPAN configuration, packet broker policy, and collector mapping in a living network documentation system. When a change is made to the network, visibility implications should be assessed as part of the change management process, not discovered after the fact. Review your visibility infrastructure health monthly: check TAP and broker hardware health, collector queue depths, flow export continuity, and alert rule accuracy. Retire stale rules and add new ones as network patterns evolve.
Pro Tip: Assign ownership of visibility infrastructure health to a specific individual or team. When everyone is responsible, no one monitors the monitoring system. Formalize this responsibility with a documented review cadence.
My take on network visibility after years in the field
I have reviewed dozens of network visibility deployments, and the pattern I see repeatedly is underinvestment in the physical layer. Teams budget for software platforms and spend weeks selecting the right SIEM or NPM tool, then cut corners on TAP placement because the hardware seems like a commodity decision. It is not.
The integrity of everything downstream: your flow analysis, your security detections, your AI-driven correlation, depends on the quality of the packet data feeding it. A SPAN port dropping 15% of packets under load does not announce itself. Your dashboards still populate. Your alerts still fire. But the data is wrong, and you will not discover that until you are investigating an incident and the packet trace does not add up.
The other underappreciated discipline is monitoring your monitoring infrastructure. I have seen environments where a packet broker silently failed and the security team continued operating with full confidence for three weeks before anyone noticed. Treating TAPs, brokers, and collectors as invisible plumbing is a serious operational risk.
Looking ahead, the visibility challenge only gets harder. Zero-trust architectures, encrypted-by-default traffic, and highly distributed multi-cloud environments all create new blind spots that traditional sensor placement does not address. The teams that will handle this well are the ones building structured, documented visibility programs now, not the ones reacting to each new architecture change as it arrives. Unified telemetry platforms that break down silos between network engineering and IT operations are the right foundation for that future.
— Jim
How Netverge supports your visibility program
Netverge was built for exactly the operational complexity this article describes. When you have TAPs, SPAN ports, flow exporters, and SNMP polling all feeding different tools, the integration work and alert management can consume as much time as the visibility itself.
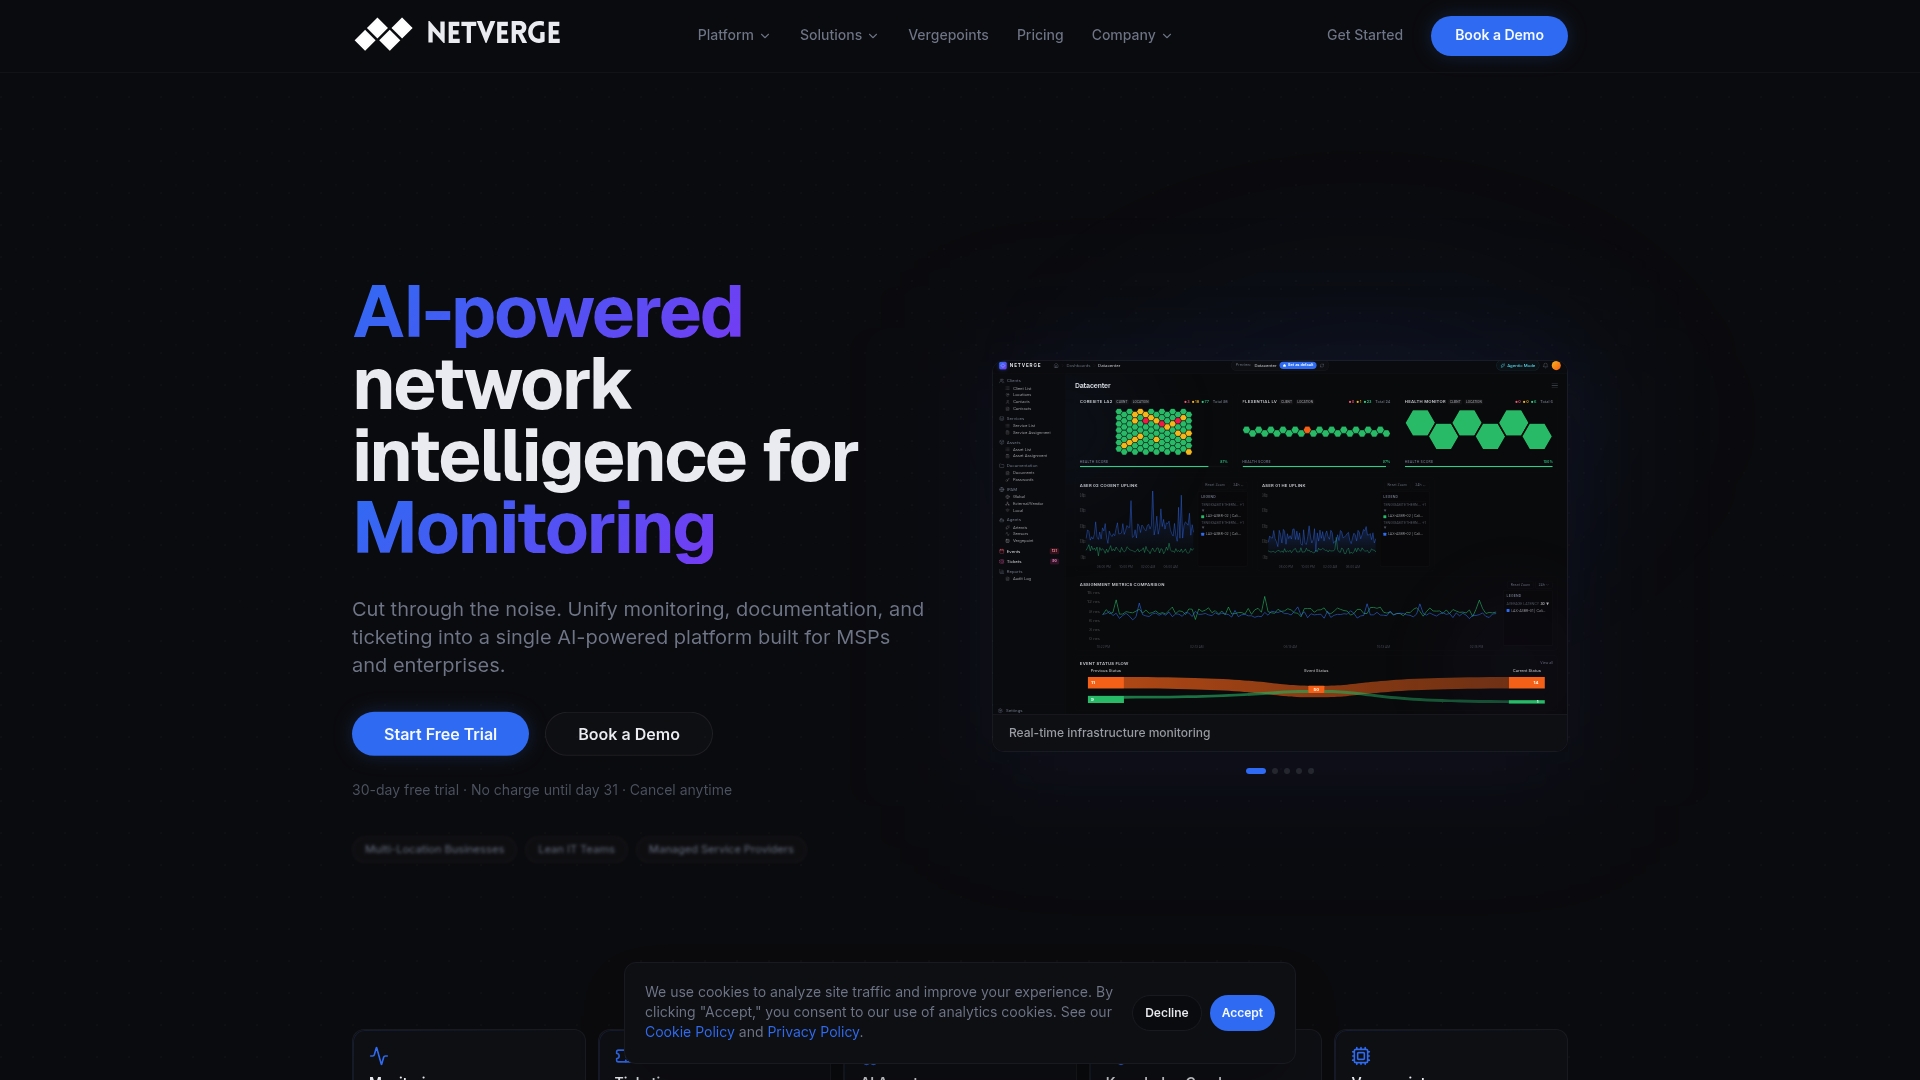
Netverge's AI-powered observability platform unifies flow data, packet telemetry, SNMP metrics, and logs into a single interface with automated correlation and anomaly detection. For physical infrastructure, Vergepoints provide plug-and-play network observability hardware that deploys in minutes and feeds directly into the Netverge platform. AI-driven triage reduces alert fatigue by automatically generating root cause assessments, so your team focuses on resolution rather than diagnosis. Whether you are an MSP managing distributed client networks or an enterprise IT team overseeing multi-location infrastructure, Netverge gives you the visibility and control your environment demands. Request a demo today.
FAQ
What is network visibility and why does it matter?
Network visibility is the ability to monitor, capture, and analyze all traffic across your infrastructure in real time. Without it, security threats and performance issues go undetected until they cause measurable damage.
When should I use a TAP instead of a SPAN port?
Use hardware TAPs in any segment subject to compliance requirements, forensic analysis, or continuous security monitoring. SPAN ports drop packets under load and are unreliable for mission-critical capture.
How do I verify my visibility setup has no blind spots?
Run synthetic traffic tests across every monitored segment, audit your flow exporter device list against your full routing table, and validate that your platform generates alerts for known test conditions within your defined SLA.
What data sources should I include in a unified visibility platform?
A complete setup includes NetFlow or IPFIX flow records, full packet capture for critical segments, SNMP device metrics, structured syslog events, and cloud-native telemetry such as VPC flow logs for hybrid environments.
How often should I review my network visibility configuration?
Review visibility infrastructure health at least monthly, and assess visibility implications as part of every network change management process. Your network evolves continuously, and your visibility program must keep pace.