Observability vs. Monitoring: What Each Does and When to Use Both
Published
- observability vs monitoring
- monitoring vs observability
Monitoring tells you that something is wrong. Observability helps you work out why. Monitoring watches for conditions you defined in advance, such as a link down, CPU above 90%, or latency over a threshold. Observability gives you enough context-rich telemetry to investigate problems nobody predicted. Most network teams need both, and the real decision is how much of each fits your environment and budget.
This guide explains how each works, where they differ, how metrics, logs, and traces fit in, and how to decide for a distributed network.
TL;DR
- Monitoring answers known questions: is it up, is it slow, is it over capacity? It drives alerts and trend reports.
- Observability lets you ask new questions of a system from the outside, which matters most when a failure is new or the cause is unclear.
- Monitoring is a part of observability practice, not a rival to it. Alerts detect the problem, and observability data explains it.
- Full observability is not always worth the cost. Start from the problem you need to solve, then pick the level that fits.
- For MSPs and multi-site teams, the practical gain comes from correlating telemetry, documentation, and tickets in one place.
Table of Contents
- What is monitoring?
- What is observability?
- Observability vs. monitoring: key differences
- How metrics, logs, and traces fit
- Why distributed networks make the difference matter
- When to use monitoring, observability, or both
- The cost question
- Where observability sits: DevOps, SRE, and IT operations
- Our perspective
- How Netverge brings both together
- Practical steps to improve both
- FAQ
- Sources
What is monitoring?
Monitoring is the practice of collecting predefined data from systems, comparing it with expected values, and alerting when something crosses a line. You decide in advance what to watch and what counts as bad.
Typical network monitoring covers:
- Device and interface status (up or down)
- Bandwidth utilization and errors
- Latency, jitter, and packet loss
- CPU, memory, and disk on network gear and servers
- Service checks such as DNS, HTTP, and VPN tunnels
TechTarget describes monitoring as well suited to detecting problematic conditions and analyzing long-term trends. That fits how network teams use it: alerting on outages, tracking capacity growth, and proving SLA compliance.
The limit is built in. A dashboard or alert rule only covers the failures someone imagined. If a problem produces a pattern you never wrote a rule for, monitoring may stay green while users complain.
What is observability?
Observability is a property of a system: how well you can understand its internal state from the data it emits. The OpenTelemetry project puts it this way: observability lets you ask questions about a system from the outside without knowing its inner workings, and it helps you troubleshoot novel "unknown unknowns."
That is the core distinction. Monitoring handles known unknowns: you know a link could saturate, so you watch it. Observability handles unknown unknowns: a set of sites slows down every day at 2:15 p.m. and no alert explains it.
To support that kind of exploration, a system has to emit rich data and keep it in a form you can query and correlate. Observability is therefore less a product category than a capability: the depth of data you collect and how well you can connect it.
Observability vs. monitoring: key differences
| Monitoring | Observability | |
|---|---|---|
| Core question | Is something wrong? | Why is it wrong, and where? |
| Questions covered | Predefined, known failure modes | New, unanticipated questions |
| Data | Selected metrics, status checks, thresholds | Metrics, logs, traces, and context, correlated |
| Output | Alerts, dashboards, trend reports | Root-cause investigation, dependency insight |
| Best for | Detecting known conditions, capacity planning, SLAs | Complex, distributed systems and novel incidents |
| Main risk | Blind spots outside your rules | Data volume, tooling complexity, cost |
| Typical user action | Respond to an alert | Explore data to find a cause |
A few points the table cannot capture:
- Direction of work. Monitoring starts with a hypothesis ("this could fail") and builds a check. Observability starts with a symptom and works backward through the data.
- Dependence. You cannot investigate with observability data you never collected, and you cannot respond fast without monitoring to flag the issue. Red Hat's description of a debugging journey starts with detection through monitoring, alerts, or user reports, then moves to analysis with observability data.
- Scope. Monitoring often looks at one component at a time. Observability tries to explain behavior across the whole path between components.
How metrics, logs, and traces fit
The common description of observability rests on three signal types. OpenTelemetry defines telemetry as data emitted by a system and its behavior, including traces, metrics, and logs.
- Metrics are numeric measurements over time: throughput, error rates, latency, utilization. They are cheap to store and ideal for alerting and trends. Monitoring runs mostly on metrics.
- Logs are timestamped event records: a configuration change, an authentication failure, an interface flap. They carry detail that a number cannot.
- Traces follow a single request across the services and hops it touches. They show where time was spent or where a request failed.
OpenTelemetry also notes that applications must be instrumented to emit these signals, and that with adequate instrumentation developers do not need to add instrumentation during an incident to get the information they need. That is the practical test of observability: when something breaks at 3 a.m., the data you need is already there.
For network teams, the equivalents are flow records, SNMP and streaming telemetry, syslog, synthetic probes, and path measurements. The three-signal model is a useful frame, not a checklist. What matters is whether you can connect the signals to each other and to the device, site, and customer they belong to.
Why distributed networks make the difference matter
A single-site network with a handful of switches is easy to reason about. Monitoring covers most of it, and an experienced engineer can hold the topology in their head.
Distributed environments change that. Communications of the ACM lists the reasons distributed systems are hard to debug: heterogeneous nodes, concurrency, network delay and packet loss, distributed state, and partial failures. It adds that reconstructing the global state of the system can be difficult or impossible.
Multi-site enterprises and MSPs live in this situation every day. A customer reports that video calls degrade on Tuesdays. The WAN link looks fine, the firewall is within limits, and the ISP shows no incident. Each tool says "healthy," yet users are affected. Finding the cause means correlating data from several layers.
TechTarget's analysis of network observability makes the benefit concrete: it narrows a large distributed view down to the failed components and, ideally, shows why they failed, which reduces how much information operators must keep in their heads.
For an MSP, this effect multiplies. More clients and more sites mean more devices, more vendors, and more combinations of failure. Without correlation, each ticket starts from zero.

When to use monitoring, observability, or both
There is no universal answer, but the pattern is consistent. Use monitoring for predefined conditions, alerts, and long-term trend or capacity analysis. Use observability to investigate complex systems and issues you have not seen before. TechTarget notes that organizations may use both, or choose different approaches for different workloads.
Monitoring is enough when
- The environment is small and stable, with few vendors
- Failure modes are well understood and repeat
- The main goals are uptime, SLA reporting, and capacity planning
- Incidents are resolved quickly by checking a known list
Add observability when
- Incidents take hours to diagnose even though alerts fire
- Problems cross layers, such as application, network, and cloud
- You manage many sites or tenants with different configurations
- The same issue returns and nobody can show the cause
- Alert noise is high and engineers cannot tell which alerts matter
A simple decision path
- Write down your last five major incidents. Note how each was detected and how long diagnosis took.
- Separate detection time from diagnosis time. If detection is fast and diagnosis is slow, you need context and correlation, not more alerts.
- Identify the missing data. Was the evidence absent, or present in three tools that nobody connected?
- Add signals only where they close a gap. Start with the segments that cause the most tickets.
- Review cost and retention. Telemetry storage grows quickly, so decide what you keep and for how long.
The cost question
Observability has a price: more data, more storage, more tooling, and more time to build useful views. Info-Tech Research Group states that full observability is not always necessary or worth the expense, and advises teams to first identify the problem they need to solve and then choose an appropriate level of monitoring or observability.
That is a sound rule. A retail chain with 200 near-identical branch sites may get more value from strong monitoring plus automated correlation than from tracing every packet. A software company running microservices may need deep traces. The environment and the problem decide, not the buzzword.
Watch for three cost traps:
- Collecting everything. Volume drives storage and licensing costs without improving answers.
- Tool sprawl. Separate products for metrics, logs, documentation, and tickets leave engineers to correlate by hand.
- Alert fatigue. More signals without better correlation produce more noise, not more insight. Our guide to intelligent alerting covers how to cut it down.
Where observability sits: DevOps, SRE, and IT operations
Observability grew out of software engineering, and it is closely tied to DevOps and site reliability engineering. Red Hat notes that DevOps processes rely on observability to keep cloud-native applications reliable and performant.
It is not limited to DevOps, though. Network operations, IT support, and MSP service desks face the same questions: what changed, what depends on it, and who is affected. The vocabulary differs, but the need for correlated telemetry is the same. On the network side, it shows up as topology-aware alerting, dependency mapping, and documentation tied to live data.
Our perspective
We build for MSPs and multi-site IT teams, and we see the same pattern in nearly every environment: the problem is rarely a lack of alerts. It is a lack of context.
An alert says a site is degraded. The engineer then opens a monitoring console, a documentation system, a ticket queue, and a vendor portal to learn what the site is, what is connected, what changed, and whether this happened before. That time is where mean time to resolution grows.
So we do not treat monitoring and observability as a choice. We treat monitoring as the detection layer and observability as the context layer, and we put both in one platform. Telemetry from sensors and Vergepoints feeds a knowledge graph that links devices, sites, clients, documentation, and tickets. AI agents use that graph to diagnose issues and triage tickets, so the engineer opens a ticket that already carries the likely cause.
Our advice to any team:
- Fix detection first. Without reliable monitoring, deeper data does not help.
- Reduce noise before adding signals. Correlate and group alerts into incidents.
- Keep documentation next to live data. A diagram that is out of date is worse than none.
- Measure diagnosis time, not just uptime.
— Jim
How Netverge brings both together
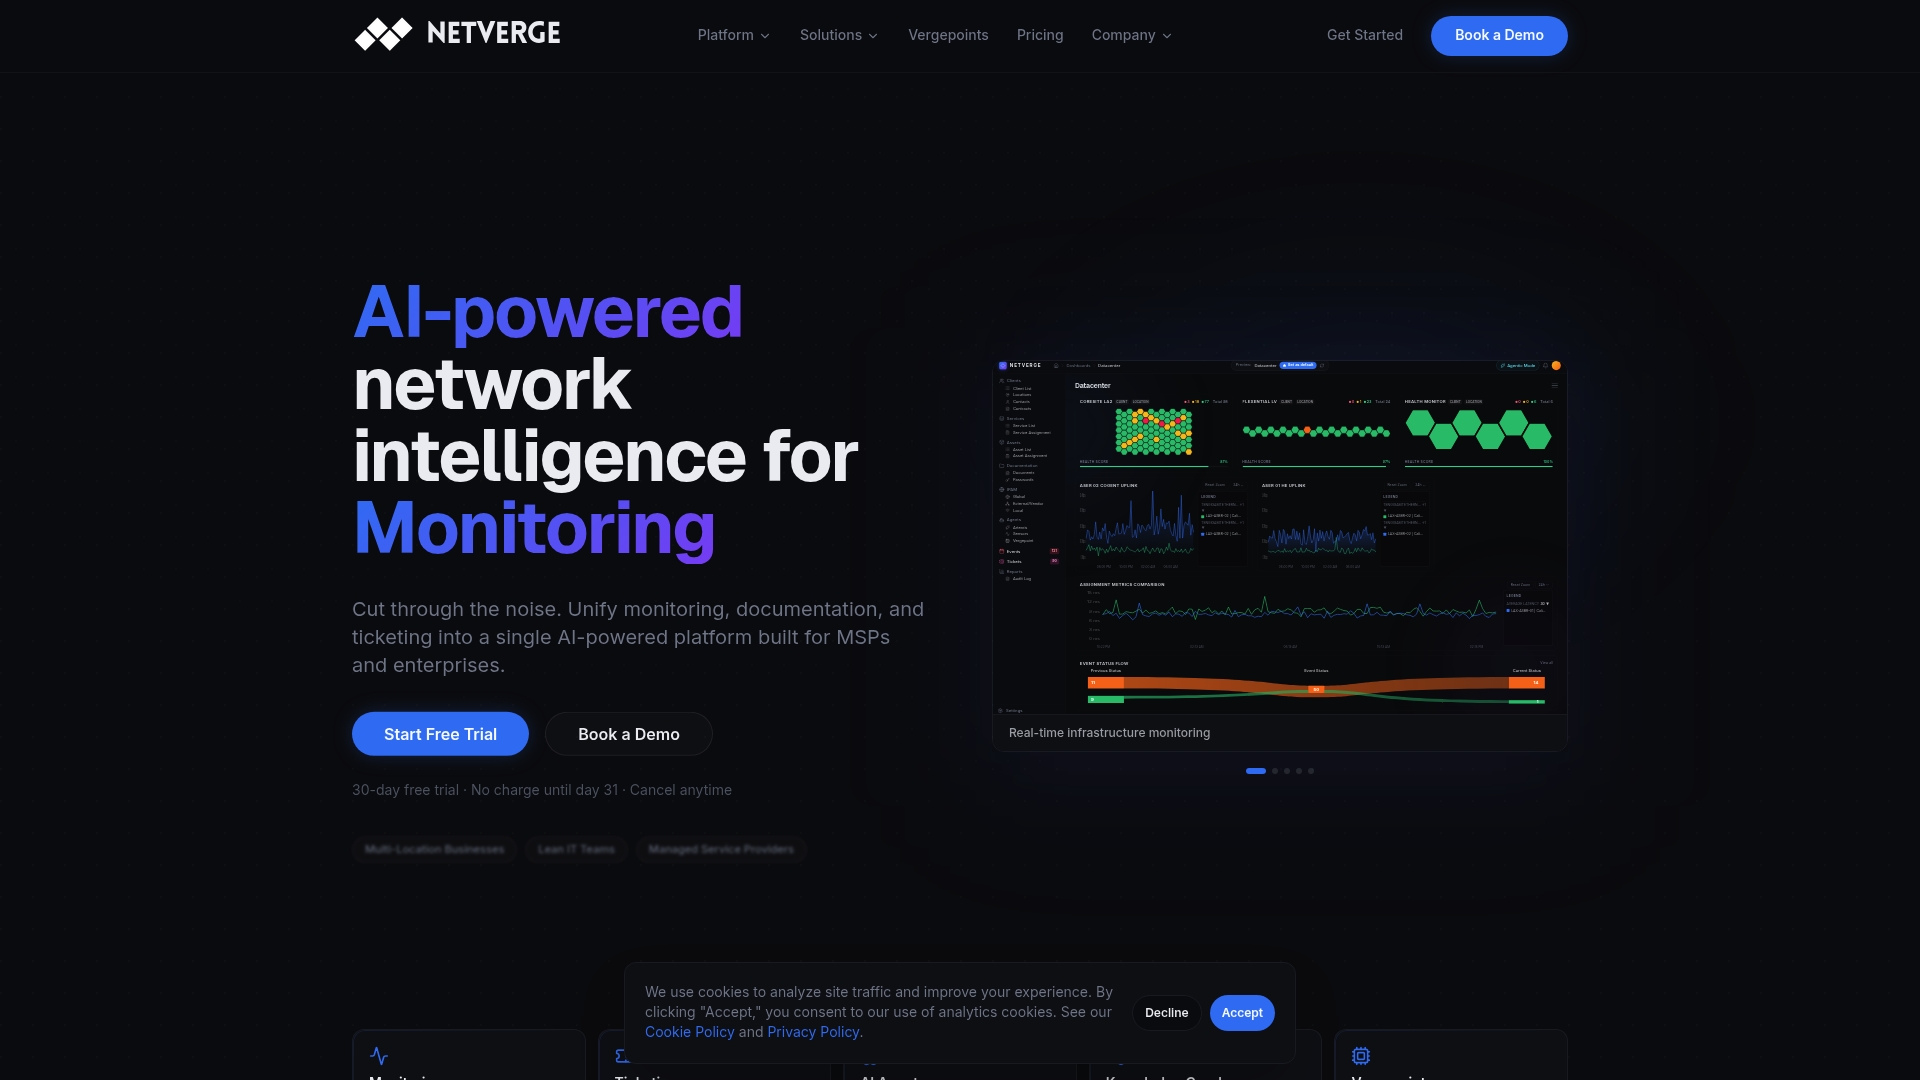
Netverge unifies monitoring, documentation, ticketing, and AI-driven automation in one platform, so detection and investigation happen in the same place. You can read how it works in our overview of AI-powered network monitoring and observability, or see the enterprise approach for multi-site teams.
Pricing is published and usage-based. The Starter Package is $299 per month. Hardware Vergepoints are $49 per month per device, and Software Vergepoints are $29 per month per Vergepoint. Additional capacity, such as 100 more sensors, 100 more clients, 100 more sites, 10 more AI agents, or 500GB of storage, is $100 per month for each block. The full list is on the pricing guide, and the pricing calculator estimates a monthly cost for your footprint.
Ready to see it on your own network? Start your free trial and connect your first site.
Practical steps to improve both
Whether you buy a platform or build with existing tools, these steps raise the quality of both monitoring and observability:
- Inventory what you watch. List devices, links, services, and sites, and flag what has no coverage.
- Choose collection methods deliberately. Our comparison of agentless and agent-based monitoring shows the tradeoffs.
- Use real-time methods where they matter. See real-time monitoring methods for what fits which signal.
- Separate alerts from incidents. Validate impact before escalating, as described in alert vs. incident.
- Use anomaly detection for the unknowns. Static thresholds miss slow drifts, and our anomaly detection examples show where baselines help.
- Build a repeatable workflow. A defined network performance management workflow keeps findings from getting lost between shifts.
If you want broader context on where the field is heading, our look at network monitoring trends covers it.
FAQ
What are the three pillars of observability?
Metrics, logs, and traces. Metrics are numeric measurements over time, logs are timestamped event records, and traces follow a request across the components it touches. The value comes from correlating them, not from collecting each one separately.
Is observability just monitoring with a new name?
No. Monitoring checks for conditions you defined ahead of time. Observability is the ability to investigate behavior you did not predict, using rich, correlated data. They overlap, and monitoring is usually the detection step within an observability practice.
Does observability fall under DevOps?
It is central to DevOps and SRE, where teams use it to keep applications reliable, but it is not owned by them. Network operations and IT support teams use the same ideas to trace causes across devices, sites, and services.
Do I need observability if I already have monitoring?
Only if monitoring leaves you slow to diagnose problems. If you detect incidents fast but spend hours finding causes, or the same issues keep returning, more context and correlation will help. If your environment is small and stable, strong monitoring may be enough.
Is a monitoring tool or an observability tool better for an MSP?
MSPs usually need both capabilities in one place. They manage many clients with different setups, so fast detection and cross-tenant context both matter. A unified platform avoids correlating data by hand across separate tools.
Sources
- Observability primer, OpenTelemetry
- Debugging Distributed Systems, Communications of the ACM
- The role of network observability in distributed systems, TechTarget
- Observability vs. monitoring: What's the difference?, TechTarget
- Plan Your IT Monitoring Journey, Info-Tech Research Group
- What is observability?, Red Hat