
Managing a distributed network without reliable real-time monitoring methods is like running a data center with your eyes closed. Alert fatigue drains your team, telemetry pipelines collapse under load, and by the time a static threshold fires, the damage is already done. This guide cuts through the noise. You will find concrete steps for setting up scalable telemetry, designing alerts that only fire when a human must act, and building a monitoring stack that holds up under production pressure. Whether you manage a handful of sites or hundreds of endpoints, the techniques here apply directly to your environment.
Table of Contents
- Key takeaways
- Real-time monitoring methods: foundations first
- Setting up a real-time monitoring pipeline
- Designing alerts that actually get acted on
- Avoiding common monitoring failures
- My take on where real-time monitoring is heading
- See real-time monitoring in action with Netverge
- FAQ
Key takeaways
| Point | Details |
|---|---|
| Separate telemetry tiers | Always collect node-level metrics; treat container logs and traces as opt-in to prevent pipeline overload. |
| Design alerts for action | Alerts should only fire when a human must respond; SLO burn-rate models cut false positives by 40 to 60 percent. |
| Buffer your pipeline | Insert buffering layers between collectors and storage to prevent telemetry crashes under traffic spikes. |
| Integrate as one system | Treat collectors, gateways, storage, and alert routing as a single integrated system, not isolated components. |
| Link runbooks to every alert | Runbooks attached to alerts cut investigation time and reduce engineer burnout significantly. |
Real-time monitoring methods: foundations first
Before you write a single Prometheus scrape config or deploy a collector, you need to answer two questions: what signals actually matter, and how much data can your pipeline realistically handle? Most monitoring failures start here, not in dashboards or alert rules.
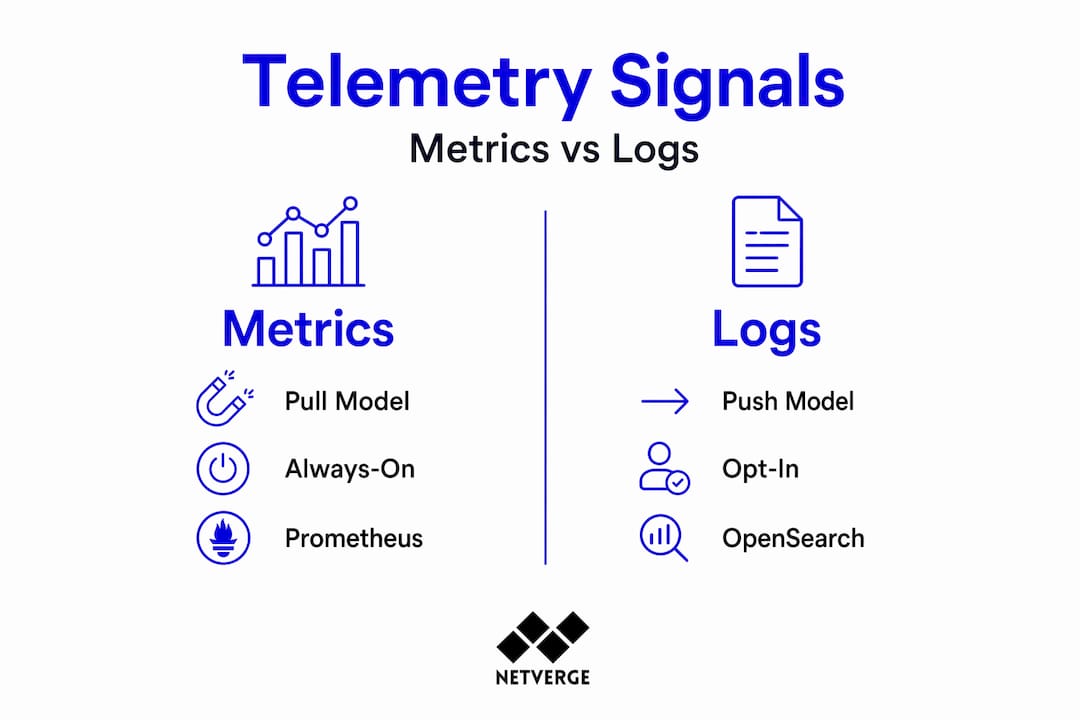
The three telemetry signal types
Real-time network monitoring relies on three signal types, each with different collection mechanics and storage costs.
- Metrics are numeric time-series data (CPU, memory, packet loss, request rate). They are cheap to store and ideal for alerting.
- Logs are structured or unstructured event records. High volume, high cost. Use them for diagnostics, not baseline monitoring.
- Traces capture the path of a request across distributed services. Collected via the OpenTelemetry SDK and sent directly to endpoints using OTLP.
The collection approach for each differs significantly. Prometheus uses a pull model for metrics, scraping targets on a defined interval. Traces use a push model, where instrumented services emit spans directly to a collector. Logs typically use an agent-based push model via tools like Fluent Bit or the OpenTelemetry Collector.
Architecture design for scale
Separating always-on node-level metrics from opt-in container signals is the single most important architectural decision you will make. Node-level data (CPU, memory, disk, network) should always be on. Container-level logs and metrics should be opt-in, controlled through pod annotations or service labels. Traces should only be emitted by services where distributed tracing adds diagnostic value.

This separation gives you a reliable baseline without drowning your pipeline in high-cardinality data. The OpenSearch Observability Stack takes a similar approach, combining PromQL-compatible metrics, correlated logs and traces, and ML-powered anomaly detection in a single stack built on OpenTelemetry.
| Telemetry type | Collection method | Common tools | Opt-in or always-on |
|---|---|---|---|
| Node metrics | Pull (scrape) | Prometheus, Node Exporter | Always-on |
| Container metrics | Pull with annotation | cAdvisor, Prometheus | Opt-in |
| Application logs | Push (agent) | Fluent Bit, OTEL Collector | Opt-in |
| Distributed traces | Push (OTLP) | OpenTelemetry SDK, Jaeger | Opt-in |
| Broker/queue metrics | Pull (JMX, exporter) | JMX Exporter, kafka_exporter | Always-on |
Pro Tip: Start with the smallest viable annotation set. Enable container metrics only for namespaces actively in production. You can always expand scope; recovering from a collapsed pipeline takes far longer.
Setting up a real-time monitoring pipeline
With your architecture defined, you can move into execution. The steps below reflect a production-grade setup applicable to Kubernetes clusters, distributed services, and message queue infrastructure.
Monitoring stack setup steps
- Deploy Node Exporter and Prometheus on every node. Configure scrape intervals based on your alerting needs. Fifteen seconds works for most operational metrics; sixty seconds is appropriate for capacity planning data.
- Add JMX Exporter for broker-level signals if you run Kafka. This surfaces broker internals: request rate, under-replicated partitions, controller metrics. Mount the JMX config into the broker container and expose the metrics port to Prometheus.
- Deploy kafka_exporter alongside Burrow for consumer group visibility. Combining JMX metrics with kafka_exporter and Burrow gives you broker internals, topic-level metrics, and consumer lag status classification in one view. Without Burrow, you risk false alerts on consumer groups that are simply paused rather than failing.
- Set up an OpenTelemetry Collector as a gateway between your services and your storage backend. Configure batching and retry logic at the gateway level. This is your first line of defense against pipeline overload.
- Insert a buffering layer using Redpanda or a Kafka-compatible streaming platform. Telemetry pipeline overload causes crashes without a durable buffer; Envoy load balancing combined with OTEL Gateway batching and Redpanda streaming prevents data loss under traffic spikes.
- Build Grafana dashboards targeting the metrics that directly inform operational decisions: consumer lag, under-replicated partitions, node saturation, and error rates.
- Write alert rules in Prometheus or Grafana tied to SLO burn rates, not fixed thresholds.
Key metrics to surface on your dashboards
Once your pipeline is running, these are the signal categories that belong on your primary dashboards:
- Infrastructure health: CPU saturation, memory pressure, disk IOPS, network throughput per node
- Kafka broker health: Under-replicated partitions, active controller count, request latency by type
- Consumer group status: Lag per partition, committed offset trends, group rebalance events
- Application telemetry: Request rate, error rate, latency percentiles (p50, p95, p99)
Pro Tip: Avoid collecting every available metric at maximum resolution. Real-time monitoring latency depends on sampling policy. Use recording rules in Prometheus to pre-aggregate high-cardinality data before it hits your dashboard queries.
For a deeper look at how distributed monitoring can be applied across multi-location networks, the practical guide for IT leaders from Netverge covers additional architectural patterns worth reviewing.
Designing alerts that actually get acted on
Alert fatigue is not a people problem. It is a design problem. When engineers learn to ignore alert channels because 80 percent of the notifications require no action, you have lost your real-time detection capability entirely.
SLO burn-rate alerting vs static thresholds
Static threshold alerts fire when a metric crosses a number. They do not account for context. An error rate of 2 percent at 3 AM on a low-traffic window is not the same problem as a 2 percent error rate during peak load consuming your error budget in hours.
SLO-based burn-rate alerting reduces alert noise by 40 to 60 percent by aligning every alert with user impact. You define an error budget for each service, then alert when the burn rate indicates the budget will be exhausted before the window closes. The result: fewer alerts, all of them meaningful.
Good alerting rules fire only when human action is required. Configure multi-window burn rate alerts in Prometheus, route critical alerts to PagerDuty, and send warning-level alerts to a Slack channel. Use silencing rules and grouping to suppress duplicate notifications during known maintenance windows.
Making alerts useful with runbooks and context
An alert that tells an engineer "high error rate on service X" without context creates a slow, stressful response. Runbooks attached to alerts give responders an immediate starting point. Link a runbook URL directly in the alert annotations. Better yet, build executable runbooks that auto-collect diagnostic data when an alert fires.
Tips for tuning alert quality:
- Audit alerts quarterly. Kill any alert that has not driven a human action in the past 90 days.
- Set minimum duration windows before alerts fire. A 30-second CPU spike is not an incident.
- Use Alertmanager's inhibition rules to suppress downstream alerts when a parent service is already known to be degraded.
- Add deployment markers to dashboards so engineers can correlate alert timing with recent changes.
AI-assisted alert triage is changing how teams handle this. For context on how that works in practice, Netverge's analysis of AI triage for network outages shows how automated root-cause acceleration reduces mean time to resolution. The full breakdown of alert fatigue in MSP contexts is also worth reading if you manage multiple client environments.
Avoiding common monitoring failures
Even well-designed monitoring systems drift. Telemetry pipelines grow without governance, dashboards fall out of sync with services, and blind spots appear quietly. Here is where most distributed environments break down.
Common failure points to watch
- Ephemeral event loss: Short-lived pods and containers generate metrics that never get scraped if your collection interval is too long. Reduce the scrape interval for workloads with high churn, or use push-based collection for those environments.
- Missing consumer lag data: Using only JMX Exporter without kafka_exporter or Burrow leaves you blind to consumer group health. You will see broker-level signals but miss the consumer lag that actually impacts your downstream services.
- Pipeline overload without buffering: Treating all pipeline components as an integrated system rather than isolated tools is what separates a stable observability stack from a brittle one. Collectors, gateways, buffers, storage, and alert routing all need to be sized and monitored together.
- Alert routing gaps: An alert that fires but never reaches an on-call engineer is the same as no alert at all. Test your routing configuration regularly.
Long-term maintenance practices
Monitoring your monitoring stack is not optional. Set up health checks on your Prometheus targets, track scrape duration and sample count over time, and alert on collector failures. You want to know when an endpoint becomes unreachable before a production incident reveals the blind spot.
Pro Tip: Run a quarterly "dark room drill." Disable your dashboards for 30 minutes and attempt to answer three key questions using only your alerts and logs. The gaps you find will tell you exactly where to invest next.
Gradual rollouts matter here too. Expand telemetry coverage incrementally. Enabling opt-in container metrics across all namespaces at once is a fast path to pipeline saturation. Roll out by namespace, validate storage and query performance at each stage, then expand. The 2026 monitoring trends overview from Netverge covers how modern teams are approaching this phased expansion.
My take on where real-time monitoring is heading
I have spent years watching teams build monitoring stacks that look great in architecture diagrams and fall apart under real load. The most common thread: they treat the telemetry pipeline as plumbing rather than a product. They set it up once and assume it works.
What I have found is that the teams with the most reliable real-time visibility are the ones that invest in pipeline design first and dashboards second. Separating always-on baseline signals from opt-in high-cardinality data is not just a performance optimization. It is what gives you confidence that your monitoring will hold up at 2 AM when everything is on fire.
SLO-based alerting transformed the teams I have worked with more than any other single change. Engineers stopped dreading their on-call rotations because the alerts they received actually required their attention. That shift in team morale is hard to quantify but easy to see.
On AI-assisted triage: I was skeptical initially, but the tools have matured. For large distributed environments where correlating signals across dozens of services was the bottleneck, AI SRE tooling genuinely accelerates root-cause identification. It is not a replacement for understanding your systems. It is a force multiplier for teams that already do.
Where I think this goes next: auto-remediation tied to verified SLO burn patterns, and monitoring pipelines that self-tune their collection granularity based on observed system state. The plumbing becomes intelligent. The question is whether your current stack is built to support that evolution or will require a full rebuild to get there.
— Jim
See real-time monitoring in action with Netverge
The methods covered in this article, from tiered telemetry design to SLO-based alerting, require a platform that can unify collection, correlation, and response in one place. Fragmented tools create the exact gaps this guide is designed to eliminate.
Netverge brings together AI-powered monitoring and observability with anomaly detection, automated alert triage, and real-time dashboards built for distributed networks. For MSPs managing multiple client environments, the MSP monitoring platform handles multi-tenant visibility without the overhead of stitching together separate tools. If you run enterprise infrastructure, Netverge's enterprise offering scales to match your environment. Start a free trial or request a demo to see how the platform performs against your current stack.
FAQ
What is real-time monitoring in network management?
Real-time monitoring is the continuous collection and analysis of network telemetry (metrics, logs, and traces) to detect issues as they occur. It gives IT teams immediate visibility into infrastructure health without waiting for batch reports or manual checks.
What are the main real-time monitoring advantages over static approaches?
Real-time monitoring detects anomalies and degradation as they happen, enabling faster incident response and reducing downtime. SLO-based alerting further sharpens this by aligning notifications with actual user impact rather than arbitrary thresholds.
How do you prevent telemetry pipeline overload?
Insert buffering layers between collectors and storage using platforms like Redpanda or Kafka-compatible streaming. Combine this with OTEL Gateway batching and Envoy load balancing to absorb traffic spikes without data loss.
What tools are used to monitor Apache Kafka in real time?
A production-grade Kafka monitoring setup combines JMX Exporter for broker internals, kafka_exporter for topic and consumer metrics, and Burrow for consumer group status classification, all feeding into Prometheus and Grafana.
How many alerts should a well-tuned monitoring system generate?
There is no fixed number, but every alert should require a human action. Teams using SLO burn-rate alerting typically see a 40 to 60 percent reduction in alert volume compared to static threshold approaches, with higher rates of alerts that lead to actual incident response.