
Most IT teams operate under a dangerous assumption: if your internal infrastructure looks healthy, your network is fine. The reality is far more disruptive. Traditional observability covers roughly 30% of owned infrastructure and leaves approximately 70% blind spots across external dependencies. That means DNS failures, CDN outages, ISP routing issues, and third-party API disruptions can take down your services while your monitoring dashboard shows green across the board. This article outlines the key network monitoring trends for 2026 that will help IT decision-makers at MSPs and enterprises close that gap and manage infrastructure with real confidence.
Table of Contents
- Why traditional monitoring misses the mark
- Internet-native telemetry and IPM: Solving external visibility
- Emerging AI and automation trends in network monitoring
- Integrating IPM and AI: Practical applications for IT leaders
- The uncomfortable truth: Why external failures are now your biggest risk
- Streamline your network monitoring with Netverge
- Frequently asked questions
Key Takeaways
| Point | Details |
|---|---|
| External blind spots | Traditional monitoring misses 70% of failures linked to external dependencies. |
| Internet-native telemetry | Collecting performance data from outside the firewall is now essential for complete visibility. |
| IPM distinction | Internet performance monitoring reveals whether an outage is internal or external. |
| AI-driven automation | Automation and AI accelerate detection and response, minimizing manual troubleshooting. |
| Practical integration | Combining IPM, AI, and proactive strategies transforms infrastructure management in 2026. |
Why traditional monitoring misses the mark
Legacy network monitoring was built for a different era. When infrastructure lived entirely on-premises and traffic stayed within controlled data center boundaries, monitoring internal routers, switches, and servers made complete sense. That model no longer reflects how modern distributed networks actually operate.
Today, your applications depend on dozens of external services and providers that sit entirely outside your firewall. When one of those external systems degrades, your users feel the impact immediately, but your internal monitoring tools see nothing unusual. This is the core problem driving demand for new approaches in 2026.
The 2026 network operations trends shaping the industry all point toward one conclusion: internal-only visibility is no longer sufficient for reliable infrastructure management.
Here are the most common external failure points that legacy monitoring consistently misses:
- DNS resolution failures: Slow or failed DNS lookups block users from reaching your applications entirely, yet most internal monitoring tools never check DNS performance from external vantage points.
- CDN degradation: Content delivery network failures affect page load times and application responsiveness. Internal latency metrics won't reflect CDN-side delays.
- ISP routing anomalies: BGP route hijacks or ISP-level congestion can redirect traffic or slow connections without triggering any internal alerts.
- Third-party API timeouts: Payment gateways, authentication providers, and SaaS integrations can fail independently of your infrastructure.
- Cloud provider regional outages: Even partial outages in a cloud region can affect service availability, with no internal signal generated.
"Traditional observability covers roughly 30% of owned infrastructure, leaving approximately 70% as blind spots across external dependencies." This is not a minor gap. It represents the majority of your actual risk exposure.
Legacy systems also struggle with proactive network alerting because they react to symptoms rather than causes. A reactive alert for high latency tells you something is wrong. It does not tell you whether the source is your infrastructure, your ISP, or a third-party service your application depends on. Modern SIEM dashboard features have begun incorporating external data sources, but without internet-native telemetry, even advanced dashboards lack the ground truth needed to accurately triage incidents.
Having established why this blind spot matters, let's break down the new monitoring trend that aims to eliminate it.
Internet-native telemetry and IPM: Solving external visibility
Internet Performance Monitoring, or IPM, is the discipline of collecting real-time telemetry data from external vantage points across the public internet. Rather than only watching what happens inside your network, IPM continuously measures what your users and external systems actually experience. It distinguishes between internal network events and external internet stack failures, giving your team clarity on root cause within minutes rather than hours.
Internet stack failures covering DNS, CDN, ISP routing, and third-party APIs are precisely what traditional internal-only monitoring misses. IPM addresses this by treating internet-native telemetry as ground truth, not a secondary data source.
Implementing IPM effectively requires a structured approach. Here is a practical sequence to follow:
- Audit your external dependencies. Catalog every DNS provider, CDN, third-party API, cloud region, and ISP path your applications rely on. You cannot monitor what you have not identified.
- Deploy synthetic monitoring agents from external locations. These agents simulate user requests from multiple geographic points, measuring real-world performance without relying on internal infrastructure.
- Integrate external telemetry into your existing dashboards. External data needs to flow into the same platform where your internal metrics live, enabling true correlation.
- Set thresholds for external SLA metrics. Define what acceptable DNS resolution times, CDN cache hit rates, and API response times look like for your specific applications.
- Map failures to business impact. Connect each external failure type to the business processes it disrupts, so your team can prioritize response based on actual user impact.
- Automate escalation paths for external failures. Route external failure alerts to teams or partners with authority to engage the relevant third-party provider.
Here is how the two approaches compare across key operational dimensions:
| Monitoring dimension | Legacy internal monitoring | IPM and internet-native telemetry |
|---|---|---|
| Failure detection scope | Internal infrastructure only | Internal and external dependencies |
| DNS visibility | Not measured externally | Continuously monitored from multiple vantage points |
| CDN performance | No direct visibility | Real-time cache hit rates and latency tracked |
| ISP routing anomalies | Invisible | Detected via BGP and traceroute data |
| Third-party API health | Not monitored | Continuous uptime and latency checks |
| Root cause identification | Slow, often manual | Automated correlation of internal vs. external events |
| Mean time to resolution | High | Significantly reduced |
Specialized network sensors that operate from distributed physical locations are becoming essential for MSPs managing multi-site environments. These sensors provide the local vantage points that make IPM data actionable. Paired with AI-powered monitoring platforms, they create a monitoring layer that sees both inside and outside your network simultaneously.
Pro Tip: Always correlate external telemetry back to business impact. A spike in DNS resolution latency only becomes actionable when you know which revenue-generating application or user-facing service it affects. Build that mapping into your alerting logic from day one.
The growing availability of 5G connectivity monitoring also adds a new layer of external telemetry, particularly for enterprises with mobile-first workflows or edge computing deployments where wireless backhaul is a critical path.
With this deeper visibility, network teams gain clarity on issues beyond their firewall.
Emerging AI and automation trends in network monitoring
AI is no longer an optional enhancement for network monitoring. In 2026, it is a core operational requirement. The volume of telemetry data generated by modern distributed networks exceeds what any human team can analyze in real time. AI closes that gap by processing data at scale, detecting anomalies, and triggering automated responses faster than manual processes allow.
Here is how AI and automation are reshaping network monitoring operations right now:
- Anomaly detection at scale: AI models trained on historical network behavior identify deviations that rule-based alerting misses. Subtle performance degradations that precede outages become visible hours before users notice any impact.
- Automated root cause analysis: Rather than generating a flood of correlated alerts, AI platforms analyze the event chain and surface the most probable root cause with supporting evidence, reducing mean time to diagnosis significantly.
- Intelligent ticket triage: AI assigns incoming alerts to the right team or technician based on severity, affected systems, and historical resolution patterns, eliminating manual queue sorting.
- Predictive capacity planning: Machine learning models analyze traffic trends and forecast bandwidth, compute, or connectivity demands before they create performance bottlenecks.
- Self-healing network actions: Automated playbooks can reroute traffic, restart services, or escalate to ISP support without waiting for human intervention.
Using IPM to determine whether failures are internal or external network events is where AI adds the most immediate value. Without that classification, AI anomaly detection generates noise. With it, AI can accurately prioritize which alerts require human action and which can be resolved automatically.
The efficiency gains from this approach are measurable. Consider the operational impact across key metrics:
| Operational metric | Manual process | AI-automated process |
|---|---|---|
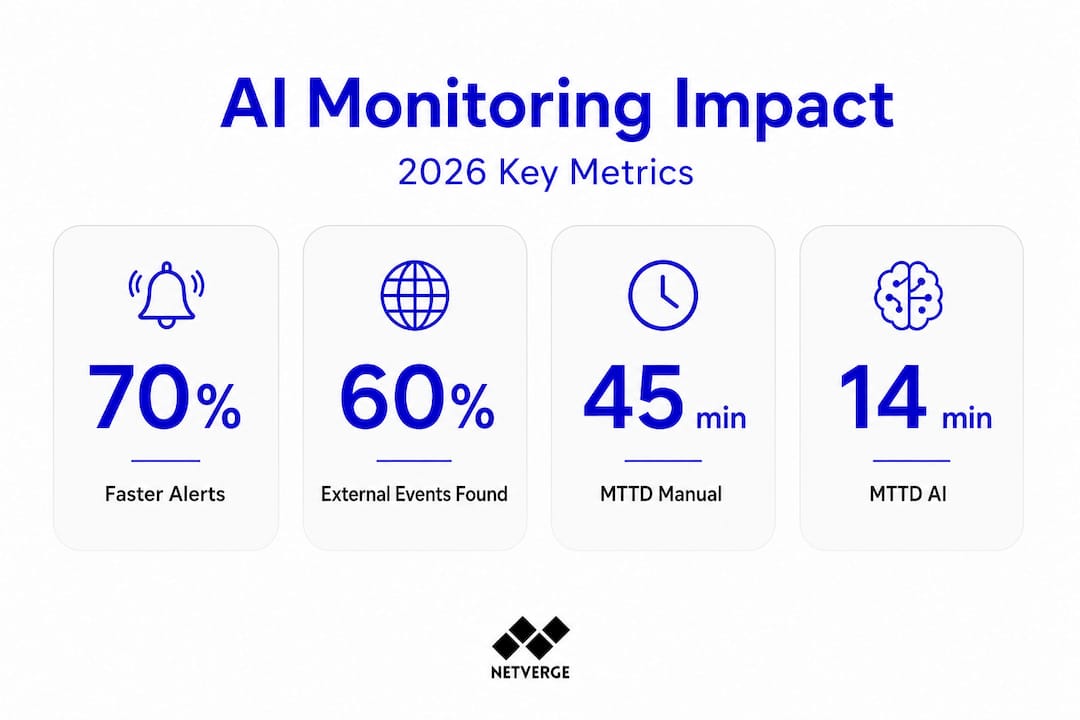
| Mean time to detect (MTTD) | 25 to 45 minutes | Under 5 minutes |
| Mean time to resolve (MTTR) | 2 to 4 hours | 20 to 45 minutes |
| False positive rate | 30 to 40% | Under 10% |
| Alerts requiring manual review | 80 to 90% | 15 to 25% |
| Coverage during off-hours | Limited | Continuous |

Statistic: Organizations using AI-driven network monitoring report up to a 70% reduction in time spent on manual alert triage, freeing engineering resources for proactive infrastructure improvements.
AI-driven network operations are also reshaping how MSPs deliver service to their clients. When AI handles first-level triage and automated remediation, MSP technicians shift from reactive firefighting to proactive advisory roles. This is a meaningful competitive differentiator in 2026.
Real-time network monitoring fed through AI correlation engines also improves network dashboard functions by surfacing only the signals that matter. Rather than overwhelming NOC teams with raw data, AI-enriched dashboards show contextualized, prioritized intelligence that accelerates decision-making. General AI technology insights across the industry confirm this trend toward context-aware, automated systems as the new standard for operational infrastructure management.
Automation and AI make these changes actionable, but the transition itself presents new organizational challenges.
Integrating IPM and AI: Practical applications for IT leaders
Understanding the value of IPM and AI is straightforward. Operationalizing them inside an existing IT organization takes deliberate planning. The following steps provide a practical roadmap for IT decision-makers moving from fragmented monitoring tools to an integrated, intelligent infrastructure management model.
- Consolidate your monitoring data into a single platform. Fragmented tools create correlation gaps. Every external telemetry feed, internal sensor, and log source should flow into one interface so your team sees the full picture without switching contexts.
- Establish baseline performance profiles for external dependencies. Before AI anomaly detection can work accurately, you need historical data on normal behavior for each DNS provider, CDN region, and critical API endpoint.
- Run IPM alongside existing monitoring for 30 days before full cutover. This parallel operation period reveals gaps in your current coverage and validates that external telemetry accurately reflects user experience.
- Train your team to read external failure signals. Most network engineers are highly skilled at diagnosing internal failures. Interpreting ISP routing anomalies or CDN degradation requires a different mental model and often different tooling.
- Integrate external failure workflows with your service desk. When internet performance monitoring detects an external event, your ticketing system should automatically open a vendor engagement workflow rather than a standard internal escalation.
- Review external SLA compliance monthly. Use IPM data to hold DNS providers, CDN vendors, and ISPs accountable to their contracted performance levels. This data is also valuable in vendor renewal negotiations.
Pro Tip: Train your team to pivot from reactive to proactive troubleshooting by scheduling weekly reviews of external dependency health trends. Patterns in CDN performance or DNS latency often appear days before they cause user-visible outages. Catching these early eliminates incidents before they happen.
The real-time monitoring guide for modern networks emphasizes that integration is not just a technical exercise. It requires process redesign and team training to realize the full benefit of new tooling. Enterprise network automation deployments that skip the process redesign step consistently underperform relative to their technical potential.
Understanding key SaaS platform features is also relevant here, since most IPM and AI monitoring platforms are delivered as SaaS products. Evaluating API flexibility, data retention policies, and integration depth should be part of your platform selection criteria.
Exploiting these trends lets you transform monitoring from reactive defense to proactive strategy.
The uncomfortable truth: Why external failures are now your biggest risk
Here is a perspective most vendors avoid stating plainly: the majority of the outages your team will troubleshoot in 2026 will not originate inside your network. They will come from the internet stack, and specifically from internet stack failures covering DNS, CDN, ISP routing, and third-party APIs that traditional internal-only monitoring misses entirely.
Most IT teams still operate with a mental model that treats external dependencies as someone else's responsibility. If the CDN fails, that is the CDN vendor's problem. If DNS is slow, that is the DNS provider's issue. But from your users' perspective, it is always your problem. And from a business continuity standpoint, it is your team that gets called at 2 a.m.
Consider a real-world scenario that plays out repeatedly across enterprise IT environments. A major e-commerce platform experiences a 40-minute checkout failure during a high-traffic period. Internal dashboards show no anomalies. Application servers are healthy. Database performance is normal. The actual failure was a BGP route hijack affecting one ISP path used by a significant portion of users in a specific region. Without external telemetry, the team spent 35 of those 40 minutes eliminating internal causes before escalating to their ISP.
Another common scenario: a SaaS company's authentication service becomes unreliable. Users report intermittent login failures. Internal monitoring shows the authentication service responding normally to internal health checks. The actual cause was degraded performance from a third-party identity provider that sat entirely outside the monitoring perimeter. With complete network visibility that includes external dependencies, this failure would have been identified and escalated to the identity provider within minutes.
The shift required here is not just technical. It is a change in organizational ownership. External dependencies must be treated as critical infrastructure assets subject to the same monitoring rigor as your internal servers. Define owners, set SLA thresholds, and build vendor escalation playbooks for every critical external dependency in your environment. Teams that make this shift outperform those that do not, across every reliability metric that matters.
Streamline your network monitoring with Netverge
Closing the observability gap requires a platform built to see both inside and outside your network simultaneously. Netverge delivers exactly that, combining AI-powered anomaly detection, specialized hardware sensors, and unified dashboards into one platform designed for MSPs and multi-location enterprises.
Netverge's monitoring solutions continuously collect telemetry from internal infrastructure and external dependencies, correlating signals across both to identify root cause faster. The network observability hardware from Vergepoints deploys at distributed locations to provide the physical vantage points that make external performance data actionable. For MSPs, the MSP monitoring platform consolidates client infrastructure visibility into a single interface with AI-driven triage and automated remediation built in. Request a demo to see how Netverge closes the observability gap across your entire network environment.
Frequently asked questions
What is internet-native telemetry in network monitoring?
Internet-native telemetry collects performance data from all layers including external dependencies like DNS, CDN, and ISP routing, providing a unified ground truth for monitoring. As research confirms, internet-native telemetry and IPM are increasingly presented as ground truth for modern observability.
How does IPM help IT teams identify network failures?
IPM distinguishes between internal and external network events so IT teams can pinpoint whether outages stem from infrastructure or outside sources. This classification, using IPM to determine internal versus external failure origin, is what accelerates root cause analysis and reduces resolution time.
Why are external dependencies critical in 2026 network monitoring?
Because 70% of network blind spots are now in external dependencies like DNS and APIs that traditional monitoring misses entirely. Ignoring external visibility means your monitoring covers only a fraction of your actual risk exposure.
What are the hardest failures to detect in modern network environments?
Internet stack failures, including DNS, CDN, ISP routing, and third-party APIs, are the most challenging to detect without external-centric telemetry. These failures produce no internal signal, making them invisible to legacy monitoring tools until users report service degradation.