Kubernetes Network Monitoring: What to Track and How
Published
- kubernetes network monitoring
- k8s network monitoring

Kubernetes network monitoring means measuring traffic, latency, drops and DNS behavior between pods, services, nodes and the outside world, then tying those signals to the network underneath the cluster. Start with four signals: pod-to-pod traffic, service latency, DNS performance and packet loss. Add flow-level visibility for policy and encrypted traffic. Then connect it all to the physical and WAN paths your nodes run on.
This guide is for MSP engineers and multi-site IT teams who run or support clusters. It covers what to watch, where the data comes from, how to check NetworkPolicy behavior, and where in-cluster tools stop and infrastructure monitoring begins.
TL;DR
- Track four core signals: pod-to-pod traffic (bytes, drops, connections), service latency, DNS request rate and response time, and retransmissions or packet loss.
- Use a CNI with flow visibility, kernel counters and a metrics stack for in-cluster data. Use a service mesh or proxy when you need HTTP and HTTPS detail.
- NetworkPolicy does not report denied traffic by itself. You need a policy-aware CNI with flow logs to see blocked connections.
- Cluster symptoms often start outside the cluster: WAN links, DNS, node uplinks. Monitor those paths too.
- Netverge covers the infrastructure side with unified monitoring, correlation and AI-assisted troubleshooting. Start a free trial.
Table of Contents
- What Kubernetes network monitoring observes
- The metrics that matter
- Data sources for cluster traffic
- Monitoring HTTP and HTTPS traffic between services
- Watching NetworkPolicy and blocked connections
- Cross-node and cross-zone traffic
- Limits and setup requirements
- Connecting cluster symptoms to the underlying network
- Perspective: why we treat the cluster as part of the network
- Monitor the network under your clusters with Netverge
- A starting checklist
- FAQ
- Sources
What Kubernetes network monitoring observes
A Kubernetes cluster has several network layers, and a problem in any one looks like "the app is slow." Monitoring has to cover each:
- Pod to pod. Traffic between pods on the same node and across nodes, carried by the CNI plugin.
- Pod to service. Requests that go through a Service virtual IP and get load balanced to backends.
- Cluster DNS. Every service lookup depends on it. Slow or failing DNS shows up as application latency.
- Node networking. The NICs, switches, VLANs and uplinks the nodes use.
- North-south traffic. Ingress, egress, VPN and WAN links to users, other sites and cloud services.
Most in-cluster tooling sees the first three. The last two sit in your wider infrastructure, and for MSPs and multi-site teams they are where many tickets actually originate. We come back to that below.
The metrics that matter
The research we reviewed groups the essential Kubernetes network metrics into three families: pod-to-pod traffic (bytes transmitted, packet drops and connection counts), service latency, and DNS query performance. The same source points to CoreDNS counters for request counts and response times. Linux kernel counters add the lower-level detail: packet drops, packet loss, throughput, latency, jitter, TCP retransmissions, error rate and connection failures.
Here is how to use them in practice.
| Signal | What it tells you | Typical first question |
|---|---|---|
| Bytes in/out per pod | Which workloads generate or receive the load | Is one namespace saturating a node uplink? |
| Packet drops | Congestion, full queues or policy denies | Are drops on the node, the CNI or the physical NIC? |
| Connection counts and failures | Exhausted ports, refused connections, conntrack pressure | Do failures cluster on one node? |
| Service latency | Round-trip time from client pod to backend | Is the slowdown in the app or in the network path? |
| DNS request rate and response time | Resolver health and query storms | Did a deploy trigger a spike in lookups? |
| TCP retransmissions | Loss somewhere on the path | Which node pair shows the most retransmits? |
| Jitter | Variability in delay | Does it hit real-time or database traffic? |
Baselines come before thresholds
A metric means little without a baseline. Record a normal week for each cluster: peak throughput, typical p95 service latency, usual DNS query rate. Alert on deviation from that pattern instead of a number copied from another environment. This is also the simplest way to cut alert noise, because a busy batch window then stops looking like an incident.

Why DNS deserves its own panel
Every pod-to-service call begins with a name lookup. When resolution slows, every service looks slow. Watch CoreDNS request counts and response times, and compare them with the resolvers upstream of the cluster. Our DNS monitoring checklist walks through the checks that catch silent failures, and the DNS outage troubleshooting guide shows what to test first when lookups break.
Data sources for cluster traffic
There is no single source. Most teams combine several.
- CNI plugin metrics. CNIs that use eBPF or iptables expose counters for drops, connections and bytes per pod or namespace. The research above cites Cilium and Calico as sources for pod-to-pod figures.
- Kernel counters. Per-interface drops, errors and TCP retransmissions from the node, as described in the kernel-level metrics list above.
- A metrics stack. Prometheus scrapes exporters and dashboards visualize them. This is the common baseline for time-series data.
- Flow observability. Tools built on the CNI datapath export flow logs and metrics at namespace and service level. Hubble on Cilium is one example, exporting flow-level telemetry from eBPF hooks.
- Service mesh or proxy telemetry. Sidecars or gateways produce L4 and L7 metrics: request counts, response codes and latencies per service.
- Infrastructure monitoring. SNMP, flow and probe data from the switches, firewalls and WAN links under the cluster.
Pick the smallest set that answers your questions. Every extra agent consumes CPU, memory and operator attention.
Monitoring HTTP and HTTPS traffic between services
A common question: how do I see the HTTP and HTTPS requests a service sends and receives? Plain metrics from the CNI give you L3 and L4 data (bytes, connections, drops). Request-level detail needs an L7-aware layer.
One write-up on observing egress traffic describes three ways to see encrypted traffic:
- Instrument the services themselves so they emit request metrics.
- Use a network proxy for TLS origination, so the app speaks plain HTTP to the proxy and the proxy encrypts outbound.
- Terminate TLS in a proxy to read L7 data, then originate a new TLS connection to the destination.
The same article shows a service mesh egress gateway exposing L7 metrics to Prometheus. Treat it as one worked example, not a rule. The tradeoff is the same in any design: the more of the request you want to see, the more of the path your monitoring has to sit in. If you only need to know whether traffic is flowing, how much, and how fast, L4 metrics are cheaper and have less impact on the data path.
Watching NetworkPolicy and blocked connections
NetworkPolicy is the built-in Kubernetes API for controlling traffic between pods and between pods and the outside world. It defines what is allowed. It does not tell you what was denied. One tutorial notes that the standard NetworkPolicy API does not define observability, and that many CNIs enforce allow and deny rules without exposing which flows were dropped or why.
The same source adds that policies remain allow-all by default unless a policy-aware CNI enforces them. Two practical consequences:
- Confirm enforcement first. If your CNI does not enforce policy, a policy object gives you a false sense of safety, and no "blocked" events will ever appear.
- Use flow logs for rollout. Before tightening a policy in production, watch the flows it would affect. Look for dropped verdicts by namespace and service, fix the policy, and then enforce.
A workable rollout looks like this:
- Enable flow visibility on the CNI.
- Capture a representative period of traffic, including batch jobs and backups.
- Write the policy for one namespace.
- Watch denied flows and connection failures for that namespace.
- Adjust, then move to the next namespace.
When a team reports "the app cannot reach the database after the change," this record shows in minutes whether a policy dropped the connection or something else did.
Cross-node and cross-zone traffic
Traffic that crosses nodes uses the physical network. In cloud clusters, traffic that crosses availability zones can also add latency and cost. Open-source tooling now exists to identify and measure cross-zone pod traffic, which helps explain surprising bandwidth bills.
To find bottlenecks:
- Rank node pairs by throughput and retransmissions.
- Check whether the busy pairs span zones, racks or sites.
- Compare in-cluster latency with probe latency measured between the same hosts, outside the cluster.
- If the two disagree, the problem is likely in the CNI overlay or node configuration. If both show the same degradation, look at the physical or WAN path.
That last comparison is the reason in-cluster and infrastructure monitoring should be read side by side. Our guide on what latency monitoring actually measures explains how to set up the second half of that comparison.
Limits and setup requirements
Plan for these realities before you roll out:
- Overhead. Agents, sidecars and eBPF programs use node resources. Start with one cluster and measure the effect.
- Kernel and CNI requirements. eBPF-based tools depend on kernel versions and the CNI in use. Check compatibility before choosing.
- Ephemeral workloads. Pods come and go. Labels such as namespace, workload and service are more useful than pod IPs for dashboards and alerts.
- Encrypted traffic. L7 visibility requires instrumentation or a proxy, as covered above.
- Cardinality. High-cardinality labels can overload a metrics backend. Aggregate by namespace or service for long-term retention.
- Scope. Cluster tools see cluster traffic. They do not see the switch, firewall or WAN link that carries it.
Connecting cluster symptoms to the underlying network
Many Kubernetes network incidents begin below the cluster. A saturated site uplink, a flapping WAN circuit or a resolver problem all surface as pod timeouts. Teams that only watch the cluster end up chasing application ghosts.
For MSPs and multi-site enterprises, the practical approach is:
- Monitor the network devices and links that connect nodes and sites.
- Correlate loss and latency events across those links, so one root cause creates one alert instead of dozens. Our piece on correlated packet loss monitoring describes the approach.
- Track WAN quality for the sites that host clusters or reach cloud regions. See WAN performance monitoring for SD-WAN environments.
- Watch the path into hybrid and cloud environments, covered in our hybrid cloud network monitoring guide.
- Keep server health in the same view. The server performance guide lists what to track on the hosts that run your nodes.
Perspective: why we treat the cluster as part of the network
We see the same pattern in support queues. A team sets up solid in-cluster dashboards, then spends hours on an incident because the cause was a degraded link, a slow resolver or a switch port, and those sat in a different tool.
Our view is that the cluster is one part of a distributed network, and the people who support it need one place to see all of it. That is why Netverge brings monitoring, documentation, ticketing and automation into a single platform. Real-time monitoring, anomaly detection and correlation reduce alert noise, and our AI agents help diagnose issues so a technician starts from context instead of a blank ticket.
For MSPs, this matters more because every client has a different mix of sites, circuits and workloads. Multi-tenant management and role-based access keep that manageable. Our Vergepoints add on-site visibility at locations where you have no other vantage point.
Our advice: use your CNI and metrics stack for pod-level detail, and use Netverge for the infrastructure those pods depend on. Read the two together.
Jim
Monitor the network under your clusters with Netverge
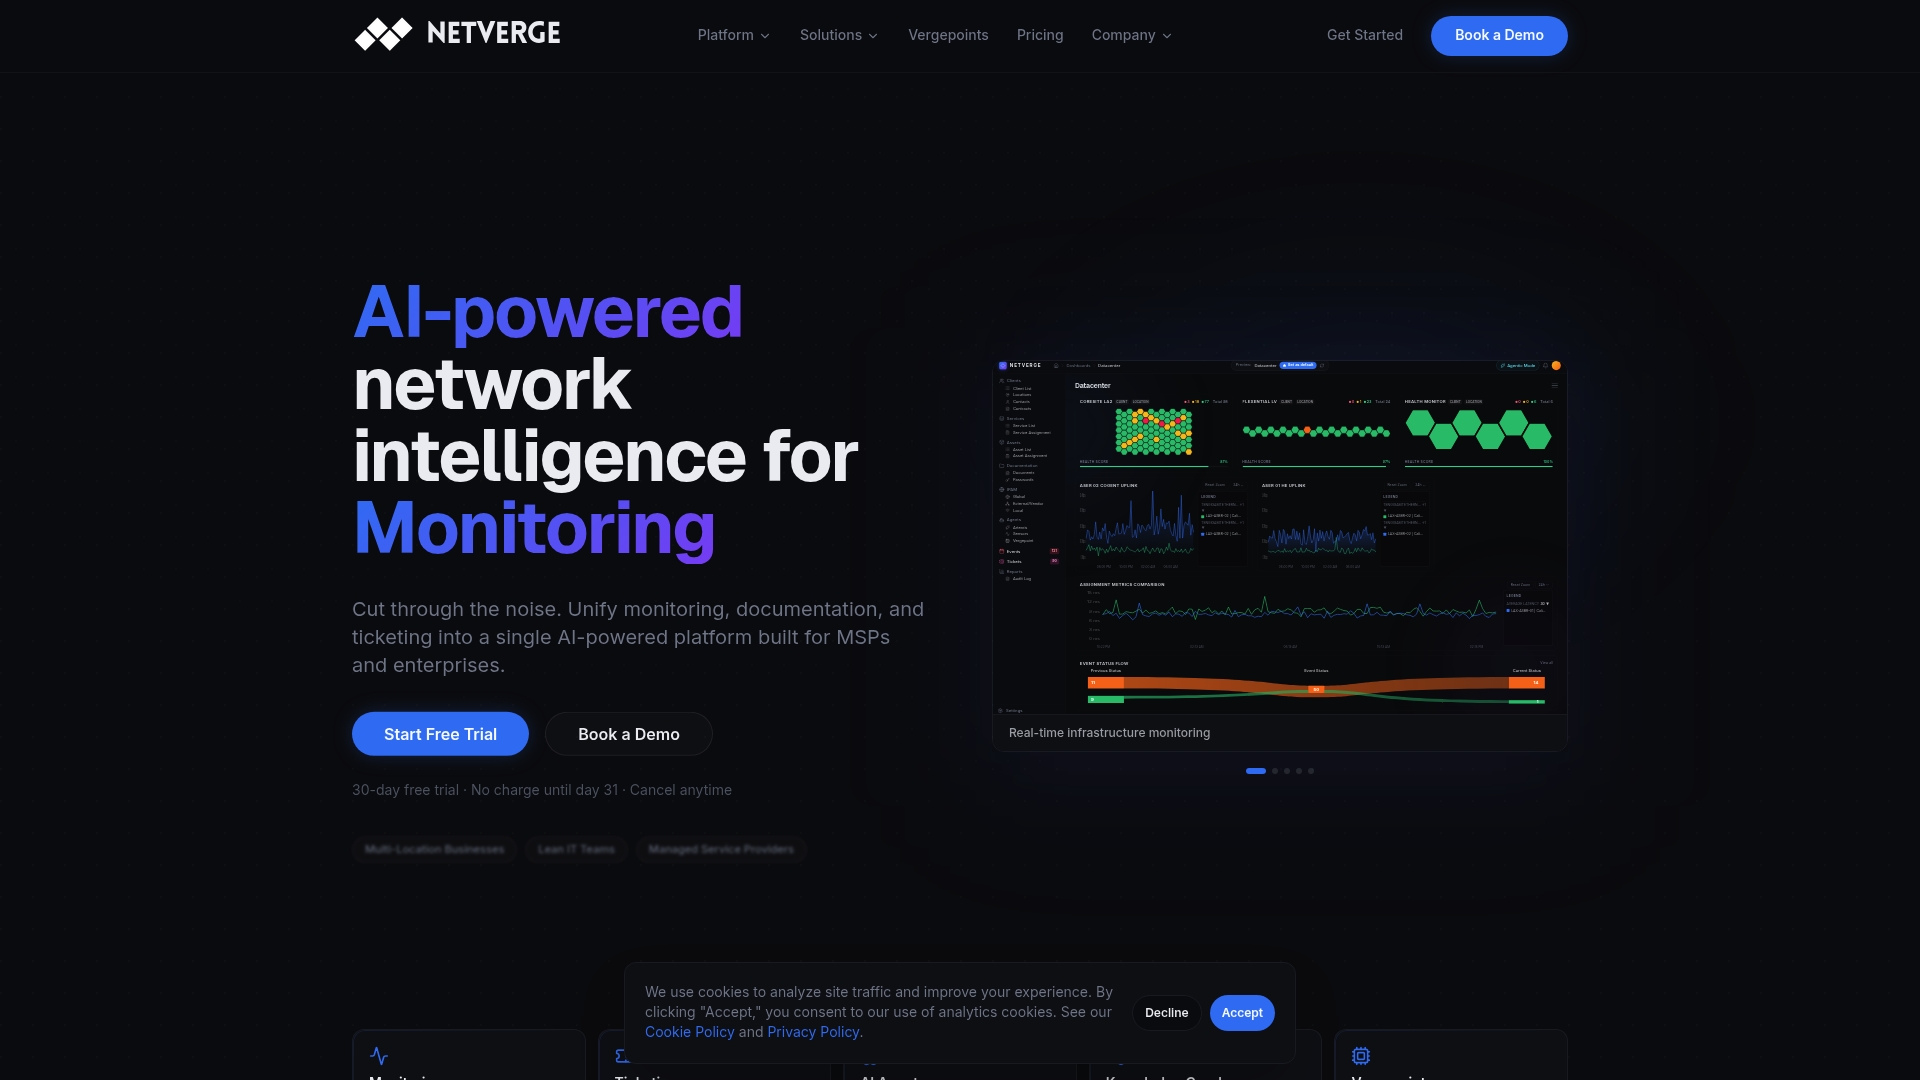
Netverge is a unified network monitoring and management platform for MSPs and multi-location enterprises. It brings real-time infrastructure monitoring, anomaly detection, AI-powered ticket triage, network documentation and automated troubleshooting into one interface, so the links, sites and DNS your clusters rely on are visible next to everything else you manage.
Published pricing starts with the Starter Package at $299 per month. Hardware Vergepoints, which give plug-and-play visibility at a site, are $49 per month per device, and a software Vergepoint is $29 per month. Extra capacity is listed on the pricing guide: 100 additional sensors, clients or sites are each $100 per month, and 10 additional AI agents are $100 per month. Use the pricing calculator to estimate your monthly cost, read about Vergepoints, or start your free trial. You can also request a demo from the site.
A starting checklist
Use this order when you set up monitoring for a new cluster:
- Confirm which CNI runs and whether it enforces NetworkPolicy.
- Collect pod-to-pod bytes, drops and connection counts per namespace.
- Add CoreDNS request rate and response time to the same dashboard.
- Measure service latency for your top five services and record a one-week baseline.
- Enable flow visibility before you write or tighten policies.
- Add L7 metrics only for the services that need request-level detail.
- Monitor the node uplinks, site links and resolvers outside the cluster, and correlate their alerts.
- Review alert rules monthly against real incidents. Retire the noisy ones.
FAQ
What is the difference between Kubernetes monitoring and Kubernetes network monitoring?
Kubernetes monitoring covers the whole cluster: nodes, workloads, resource use and logs. Network monitoring focuses on traffic, latency, drops, DNS and connectivity. It is the part that explains why healthy pods still cannot talk to each other.
Which metrics should I set up first?
Start with pod-to-pod bytes and drops, service latency and DNS request rate and response time. Add TCP retransmissions and connection failures next. Together they separate application problems from network problems for most incidents.
How do I see which connections a NetworkPolicy blocked?
The NetworkPolicy API itself does not report denied traffic. Use a policy-aware CNI that exports flow logs with allow and drop verdicts, and review them by namespace and service before and after each policy change.
Can I monitor encrypted HTTPS traffic between services?
Yes, but not from L4 counters alone. You need services that emit their own request metrics, or a proxy that originates or terminates TLS so it can report L7 data. Without either, you see volume and connection data but not request details.
Do I still need infrastructure monitoring if my cluster has good observability?
Yes. Cluster tooling cannot see the switches, firewalls, WAN circuits and upstream DNS that carry the traffic. Watching both lets you tell quickly whether a slowdown starts inside the cluster or on the network around it.
Sources
- Kubernetes Network Monitoring: Prometheus, Grafana and eBPF
- Network Observability, Kubernetes Networking: A Bottom-Up Approach
- Observing egress traffic with Istio
- Kubernetes NetworkPolicies with Cilium and Hubble