
To monitor server performance at scale, consolidate all telemetry into a single pipeline, apply AI-driven baselining with predictive alerts on critical servers, and automate low-risk remediation through governed runbooks. That is the operational plan. For MSPs and multi-location enterprises, the platform built to execute it is Netverge, with Vergepoints for on-site visibility, autonomous AI agents for diagnosis, and multi-tenant governance across every site.
Three actions to start today:
- Consolidate telemetry from all sites into one ingestion layer before tuning any alert policy.
- Enable baseline and anomaly detection on your highest-criticality servers first.
- Configure one automated remediation runbook (service restart or log rotation) to prove the model before expanding.
Table of Contents
- What metrics should you monitor for server performance?
- How should you instrument servers across distributed sites?
- How do predictive alerts reduce noise and catch failures earlier?
- How do you govern monitoring across multiple sites without fragmentation?
- What should you automate, and what requires human approval?
- What KPIs and reporting cadence prove monitoring ROI?
- What security and compliance controls does monitoring data require?
- How do you evaluate and choose a server monitoring platform?
- What does a 90-day pilot look like in practice?
- Key Takeaways
- The part most teams get wrong about monitoring at scale
- Netverge gives you the full monitoring architecture, ready to deploy
- Useful sources and further reading
What metrics should you monitor for server performance?
Every MSP needs a minimal but sufficient metric set. Collecting too little leaves blind spots; collecting everything without correlation creates noise. The core set:
- CPU: utilization, run queue depth, steal time (critical in virtualized environments)
- Memory: used, cached, swap consumption, and page fault rate
- Disk: I/O operations per second, read/write latency, queue depth, and free space per volume
- Network: throughput, error rate, packet drops, and interface latency
- Process/service health: process count, service state, and restart frequency
- Filesystem: inode usage (a full inode table halts writes even when disk space remains)
- Kernel: context-switch rate and kernel wait time (high waits signal I/O or lock contention)
- Application-level: HTTP response time, database slow-query count, and connection pool saturation
CPU and disk I/O are leading indicators; free disk space and swap usage are lagging ones. Correlating all three pillars of observability (metrics, logs, and traces) is what separates a monitoring program from a dashboard. For network downtime patterns that map to these metrics, the failure modes are well-documented.
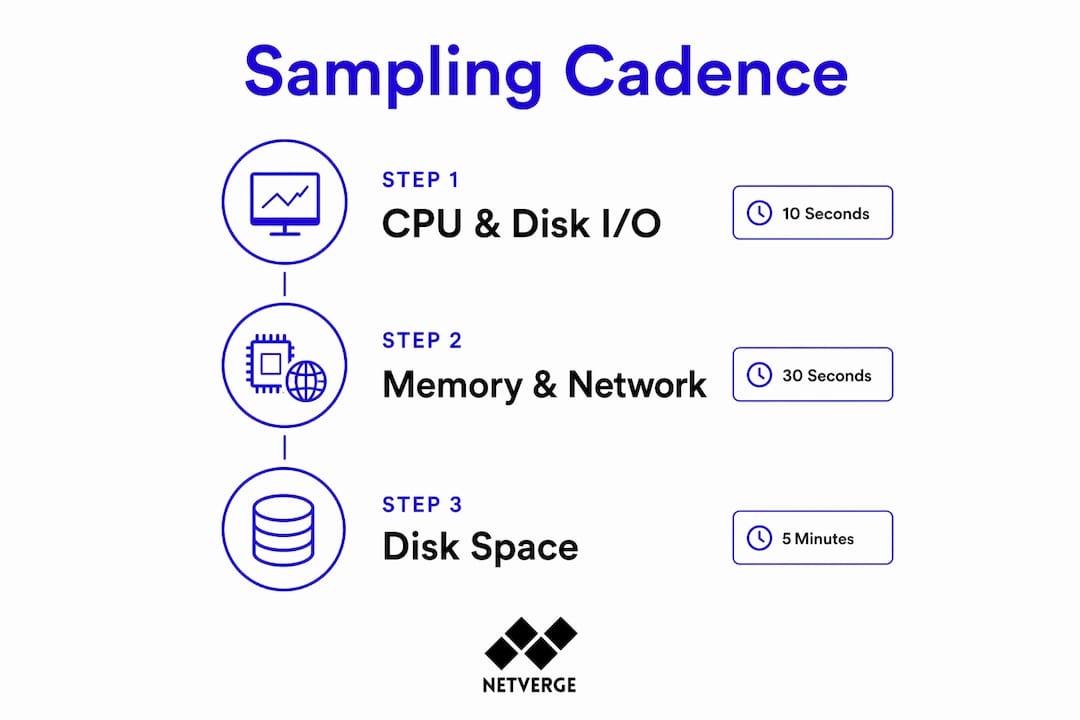
Sampling cadence by criticality: poll CPU and disk I/O every 10 seconds, memory and network every 30 seconds, disk space and inode usage every 30–60 seconds, and capacity-planning telemetry every 5–15 minutes.
How should you instrument servers across distributed sites?
Architecture choice determines what you can see and how fast you can act. Three models apply at scale:
| Model | Telemetry Depth | Bandwidth Impact | Offline Resilience | Best Fit |
|---|---|---|---|---|
| Agent-based | High (process, kernel, app) | Moderate | Local buffering possible | Primary sites, critical servers |
| Agentless (SNMP/WMI) | Low to moderate | Low | None | Network devices, legacy hosts |
| Hybrid (agents + collectors) | High where needed | Controlled | Partial | Distributed estates |
Agent-based deployment gives you process-level telemetry and local inference, but requires bootstrapping, certificate management, and version governance across every host. Agentless collection via SNMP or WMI is lighter but misses kernel-level detail. A hybrid model places agents on critical servers and lightweight collectors everywhere else.
Edge hardware fills the gap that software alone cannot. Vergepoints sit on-site to provide packet-level telemetry, local synthetic checks, and offline buffering when WAN connectivity is intermittent. A resilient multi-site architecture centralizes policy while decentralizing execution, with local buffering as a non-negotiable design requirement.

Pro Tip: Deploy a site canary (a lightweight synthetic check from each site's collector) before rolling agents to every host. If the canary fails, you know the site has a connectivity or configuration issue before it affects production telemetry.
How do predictive alerts reduce noise and catch failures earlier?
Static thresholds fail in multi-site environments because load profiles differ by site, time of day, and workload type. A CPU alert set at 80% fires constantly on a batch-processing server and never on an idle one. AIOps for server management has shifted the industry from reactive alerting to predictive operations that forecast failures days in advance by analyzing the slope of resource usage.
The workflow:
- Raw telemetry ingested and normalized
- ML baseline model trained (typically 7–14 days of representative data)
- Anomaly detected against dynamic threshold
- Correlated incident group formed across related signals
- Slope-based predictive alert fires when trend projects exhaustion within a defined window
- Preemptive remediation option presented or triggered automatically
Slope-based alerts are most valuable for disk fill rate, memory growth under memory leaks, and queue depth trends. Apply them first to your highest-criticality servers.
Statistic: An AI-driven monitoring deployment across five MSP clients reduced weekly alert noise from 70–75 notifications to 10–14, filtering out 80–85% of false positives.
How do you govern monitoring across multiple sites without fragmentation?
Fragmentation caused by shadow IT and inconsistent tooling is the top failure mode for distributed monitoring programs. A layered architecture prevents it: local collectors handle site-level telemetry, regional aggregators normalize and buffer data, and a central governance layer enforces policy.
Governance checklist:
- Multi-tenant role definitions (MSP admin, site owner, NOC operator, read-only auditor)
- Site profiles by criticality (critical, standard, remote, regulated) with distinct alert and patching cadences
- Policy templates applied automatically on site onboarding
- SLA tiers mapped to site profiles and service classes
- Audit evidence captured and retained per site for compliance reviews
- Escalation paths defined per site and per service class before go-live
For intermittent WAN links, signed telemetry with local buffering and delayed reconciliation prevents data loss. A unified monitoring layer that correlates metrics from headquarters, branches, and cloud workloads is the baseline requirement for any serious multi-site program.
Pro Tip: Map a named owner and a documented escalation path for every site and every service class before you enable automated remediation. Automation without ownership accountability creates confusion when something goes wrong.
What should you automate, and what requires human approval?
Automation taxonomy by risk level:
- Read-only diagnostics: always safe to automate (log collection, health checks, telemetry snapshots)
- Low-risk fixes: automate with verification (service restart, log rotation, cache flush)
- Conditional rollbacks: automate with approval gate or change-window check
- High-risk changes: require human approval (host reboots, configuration changes, network policy updates)
Integration checklist for a complete remediation workflow:
- Ticketing/ITSM: map alerts to ServiceNow or Jira tickets with severity and site context
- CMDB sync: pull asset relationships to enrich incident context automatically
- Runbook automation hooks: trigger scripts or playbooks from alert conditions
- ChatOps notifications: route alerts and remediation status to Slack or Teams channels
Every automated action needs an audit trail, a change-window awareness check, and a verification step after execution. If the verification fails, the ticket escalates to a human. AI-powered network management examples show how this loop works in practice for MSP environments.
What KPIs and reporting cadence prove monitoring ROI?
Operational KPIs for monitoring success include MTTD, MTTR, alert-to-incident ratio, prevented incidents, false-positive rate, automation success rate, and agent coverage percentage. Track them on a structured cadence:
- Daily: health dashboards showing open incidents, alert volume, and automation outcomes
- Weekly: incident review covering MTTD/MTTR trends and top recurring alerts
- Monthly: capacity forecasts, rightsizing recommendations, and false-positive rate trends
- Quarterly: ROI review comparing prevented incidents against monitoring investment
For capacity planning, use baseline trend data to forecast resource exhaustion 30–90 days out. Integrate with cloud cost controls to rightsize instances before over-provisioning becomes a budget problem.
| Day Range | Milestone | Success Criteria |
|---|---|---|
| — | Telemetry consolidated, baselines established | 90%+ agent coverage on critical servers |
| — | Predictive alerts live, first runbooks active | Alert volume down, first automated fix verified |
| — | Capacity forecasts running, ROI baseline set | MTTR trending down, quarterly report ready |
What security and compliance controls does monitoring data require?
Monitoring data carries sensitive infrastructure detail and must be protected accordingly:
- Transport: TLS for all telemetry in transit; mTLS for agent-to-collector communication
- Encryption at rest: apply to all stored metrics, logs, and configuration data
- Role-based access: least-privilege for every role, including automated remediation service accounts
- Immutable logs: signed and append-only audit logs for all remediation actions and configuration changes
- Data retention: retain audit evidence and change records per site; align retention periods with your compliance obligations (SOC 2, HIPAA, or PCI DSS as applicable)
- Incident integration: feed monitoring evidence directly into incident response and forensic workflows so post-incident analysis has a complete record
For AWS-hosted workloads, apply the same controls to cloud-native telemetry pipelines. Access to remediation runbooks should require the same approval gates as production change requests.
This article is general operational guidance, not legal or compliance advice. Confirm your specific retention and security requirements with a qualified compliance professional.
How do you evaluate and choose a server monitoring platform?
Evaluation checklist for MSPs and multi-site enterprises:
- Multi-tenancy with site-aware role separation
- Telemetry buffering for intermittent WAN sites
- AI-driven baselining and predictive (slope-based) alerts
- Runbook automation with approval gates and audit trail
- Native integrations: ITSM, CMDB, cloud providers, SD-WAN, virtualization
- Edge hardware option for on-site packet-level visibility
- Pricing model clarity (per-agent, per-site, or tiered subscription)
Vendor questions to ask during proof-of-concept:
- What is the onboarding time for a 50-site deployment?
- What are the data retention and egress costs at scale?
- What is the SLA for telemetry ingestion latency?
- Which third-party ITSM and CMDB integrations are native vs. webhook-only?
- How does the platform support 24/7 NOC coverage across time zones?
Red flags: opaque per-alert pricing, no offline buffering for remote sites, no native API or ITSM integration, and a vendor unwilling to run a site canary during the POC. Netverge is built to pass every item on this checklist, with Vergepoints for edge visibility and AI agents for triage and remediation.
What does a 90-day pilot look like in practice?
| Phase | Days | Owner | Key Activities | Success Criteria |
|---|---|---|---|---|
| Discovery & inventory | 7–14 | Program manager + site owners | Asset discovery, site profiling, agent bootstrapping | Full inventory of critical servers |
| Telemetry consolidation | 15–30 | NOC lead + vendor | Ingest normalization, baseline training begins | 90%+ coverage, baselines forming |
| POC alerts & automation | — | NOC lead + security owner | Predictive alerts live, first runbooks tested | Alert noise down, one automated fix verified |
| Canary rollout & tuning | — | All owners | Policy tuning, capacity forecasts, ROI baseline | MTTR trending down, quarterly report ready |
Start with alert noise reduction and event correlation before adding anomaly detection. That sequencing builds operator trust in the AI system before you ask operators to act on its predictions. Include rollback rules in the pilot agreement: if a runbook causes a verified outage, it reverts to human-approval mode automatically.
Key Takeaways
Effective server performance monitoring at scale requires consolidated telemetry, AI-driven baselining, predictive alerts, and governed automation deployed in a phased 90-day rollout.
| Point | Details |
|---|---|
| Consolidate telemetry first | Unified ingestion across all sites is the prerequisite for reliable baselining and alert correlation. |
| AI baselining needs time | ML baseline models typically require 7–14 days of representative data before dynamic thresholds are reliable. |
| Predictive alerts cut noise | An AI-driven deployment reduced weekly alert volume from 70–75 notifications to 10–14 in a documented MSP deployment. |
| Automate by risk tier | Automate read-only diagnostics and low-risk fixes first; gate reboots and config changes behind human approval. |
| Netverge delivers the full stack | Netverge combines Vergepoints for on-site visibility, AI agents for triage, and multi-tenant governance for distributed MSP and enterprise deployments. |
The part most teams get wrong about monitoring at scale
The conventional wisdom says: deploy monitoring everywhere, then tune. That order is backwards. Teams that instrument every server on day one end up drowning in alert noise before they have established a single reliable baseline. Operators lose trust in the system fast, and once they start ignoring alerts, the monitoring program is functionally dead regardless of how much was spent on it.
The smarter path is to start narrow and prove value. Pick your five most critical servers, consolidate their telemetry, let the baseline model train for two weeks, and then show your NOC team a week where alert volume dropped by half and one incident was caught before users noticed. That single win does more for adoption than any training session.
The other pitfall is treating monitoring data as a substitute for change control. Monitoring tells you what is happening; it does not authorize what should happen next. Every automated remediation action needs to be registered in your change management process, even if it is a low-risk service restart. The audit trail is not bureaucracy. It is the evidence you need when something goes wrong at 2 AM and you need to reconstruct exactly what the system did and why.
Alert-policy sprawl is the slow killer. Every team adds their own thresholds, nobody removes old ones, and within six months you have hundreds of rules nobody owns. Assign a named owner to every alert policy and review the full list monthly. Policies without owners get disabled.
Netverge gives you the full monitoring architecture, ready to deploy
Fragmented tools and disconnected documentation are the two fastest ways to lose visibility across a distributed estate. Netverge replaces both with a single platform that covers the entire architecture described in this guide: AI-driven network monitoring with predictive alerts, Vergepoints for on-site edge visibility and offline buffering, autonomous AI agents for triage and runbook execution, multi-tenant governance with site-aware role separation, and native integrations with ServiceNow, Jira, and major cloud providers.

For MSPs, Netverge's MSP monitoring platform includes inventory assistance, site profiling templates, and sample runbooks so your 90-day pilot starts with working infrastructure, not a blank slate. The measurable targets are clear: reduced alert noise, lower MTTR, and a documented prevented-incident count within the first 60 days. Start your pilot at netverge.com/monitoring and set your first KPI baseline before the end of the week.
Useful sources and further reading
- AIOps for Server Management: Predictive IT Ops in 2026 — covers ML-based grouping, predictive failure detection, and recommended rollout sequencing
- AI- and IoT-Driven Monitoring for MSP Multi-Tenant Networks (MDPI) — peer-reviewed deployment study with documented alert noise reduction and MTTR outcomes
- Distributed Network Monitoring: Challenges & Solutions — fragmentation risks and the case for unified multi-tenant governance
- Resilient Multi-Site Monitoring Architecture Guide — layered telemetry design, offline buffering, and site profile patterns
- AI Log Analysis for MSP and Hosting Management — baseline training windows and log normalization best practices
- Network Visibility Challenges Across Remote Locations — layered telemetry requirements for distributed estates
- Tips for MSPs Managing Distributed Networks in 2026 — Netverge operational checklists for multi-site deployments
- Why Use AI for Network Monitoring in 2026 — ROI and operational benefits of AI-driven monitoring