Latency monitoring tracks the delay between when a packet leaves one point in your network and when a response confirms it arrived, capturing round-trip time, jitter, and tail percentiles rather than single-point pings.
Start with three moves before you touch a dashboard. First, establish a baseline for every path that carries production traffic, measured over at least a week to capture daily and weekly cycles. Second, pick your percentiles. Tail percentiles matter more than the mean for almost every workload, and high-performance data center teams track tail percentiles specifically because spikes hide inside averages. Third, instrument synthetic tests on your critical paths so you catch degradation before a user does.
Your priority checklist for week one:
- Baseline first. Run continuous probes for 5 to 7 days minimum before setting any alert threshold.
- Define an SLO per service. Tie a percentile target (an appropriate percentile target tied to business outcomes) to a specific business outcome, not a round number.
- Deploy scheduled synthetic probes. Use active tests on the paths that carry revenue-generating traffic, not just the easy ones.
Key Takeaways
Latency monitoring works when teams pair percentile-based baselines with layered tools, from active probes to packet capture, and treat tail events as the real signal.
| Point | Details |
|---|---|
| Baseline before alerting | Run continuous probes for at least a week before setting any percentile threshold. |
| Track P95/P99, not averages | Tail percentiles reveal the spikes that hide inside a comfortable-looking mean. |
| Layer your tools | Use ping and mtr first, TCP/UDP synthetic tests second, packet capture last for verification. |
| Test both directions | Asymmetric routing hides the true source of delay when you only measure one way. |
| Consolidate with Netverge | Netverge unifies distributed probes, Vergepoints edge hardware, and automated correlation into one platform. |
Table of Contents
- Core Latency Metrics You Must Track
- What Causes Elevated Latency in the First Place?
- Which Tools Actually Measure Network Latency?
- How Do You Troubleshoot a Latency Spike Step by Step?
- How Do You Build Continuous Latency Monitoring at Scale?
- How Do You Read Latency Commands in Practice?
- How Do You Monitor Latency for VoIP and Real-Time Apps?
- What Do Experienced Engineers Watch For That Others Miss?
- What Operational Habits Actually Cut Resolution Time?
- How Netverge Consolidates Latency Monitoring and Troubleshooting
- Where to Go for Deeper Technical Reference
- Frequently Asked Questions
- Sources
Core Latency Metrics You Must Track
Round-trip time (RTT) is the delay between sending a packet and receiving its acknowledgment, and it's the metric most engineers reach for first because tools like ping report it natively. One-way delay measures a single leg of that trip, and it requires synchronized clocks on both ends to compute accurately. RFC 6374 defines timestamp-based delay measurement procedures specifically because one-way metrics matter for use cases like financial trading, where knowing which direction carries the delay changes your remediation entirely.
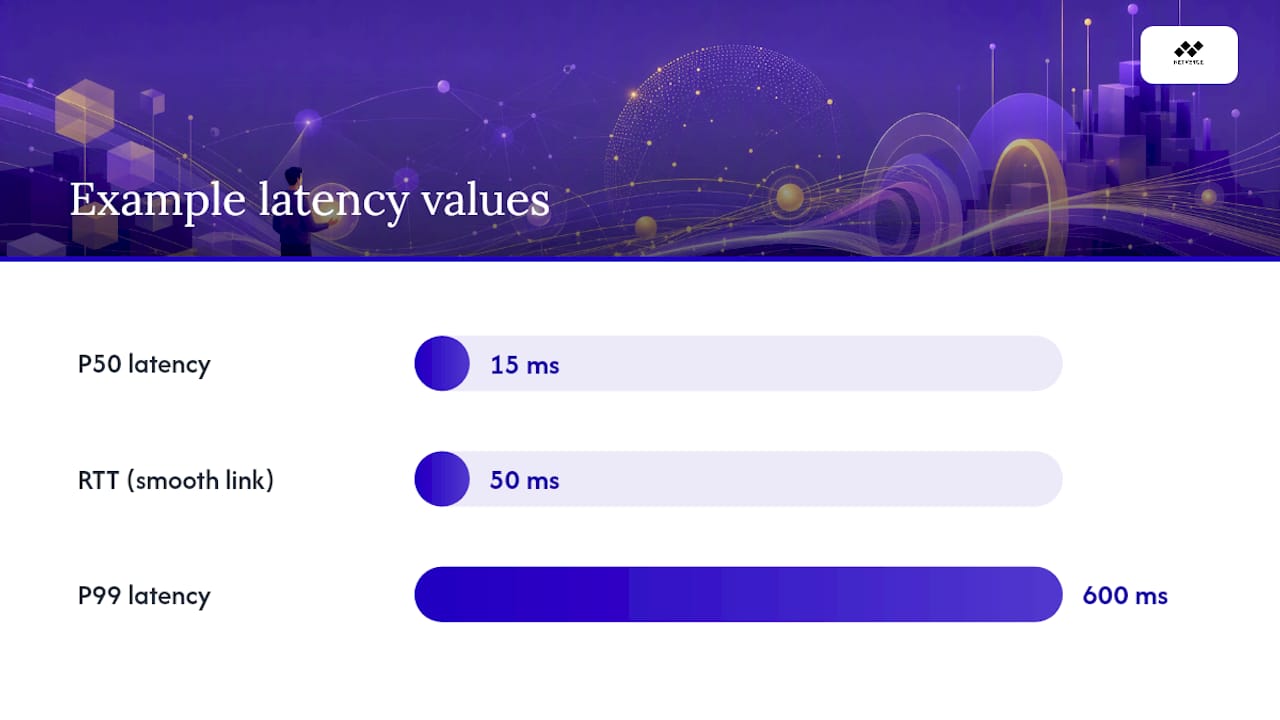
Jitter is the variation in delay between consecutive packets, not the delay itself. A link with 50ms RTT and near-zero jitter feels smooth. A link with the same average RTT but jitter swinging between 10ms and 90ms will break VoIP calls even though the average looks fine on a dashboard. Packet loss, separately, tracks the percentage of packets that never arrive. Serialization delay, propagation delay, and queuing delay are the three components that sum into the RTT you observe. Serialization is the time to push bits onto the wire, propagation is the physical transit time bound by distance and the speed of light in fiber, and queuing is the time a packet waits in a buffer during congestion.
Percentiles beat averages because they show you what your worst-affected users actually experience. RFC 8912 and related IANA performance metric registries recommend reporting round-trip delay at the 95th percentile specifically to standardize how operators compare measurements across networks. A P50 of 15ms with a P99 of 600ms describes a network with a serious intermittent problem that a simple average would completely hide.
Pro Tip: Set your primary alert on P95 or P99, not the average. An average can sit comfortably inside your SLO while 3% of your transactions time out, and nobody gets paged until the support queue does.
The link between a metric and a symptom is usually direct once you know where to look:
- Rising jitter shows up as robotic or choppy audio on VoIP calls before it shows up anywhere else.
- Packet loss above 1% on a bulk transfer link manifests as retransmit storms visible in a packet capture.
- A climbing P99 with a flat P50 usually points to intermittent congestion or a noisy neighbor on shared infrastructure, not a broken link.
What Causes Elevated Latency in the First Place?
Propagation delay is the one cause you cannot fix. It's a function of physical distance and the speed of light through fiber, so a round trip across continents has a hard floor determined by physics no matter how good your gear is. Everything else on this list is fixable, and each leaves a distinct fingerprint in your measurements.
Congestion and queuing show up as latency that climbs specifically during peak traffic windows and drops back down overnight. Run mtr during a congestion event and you'll see RTT increase at one hop and stay elevated at every hop after it, because queuing delay accumulates downstream. Device CPU or interrupt saturation on a router or firewall produces a different pattern: latency spikes that correlate with CPU utilization graphs rather than traffic volume, often visible in SNMP polling before users notice anything.
Storage or host-side delays get misdiagnosed as network problems constantly. An application server with a disk I/O bottleneck adds delay to every response, and from the client's perspective that looks identical to network latency until you check application-level timing. Debugging distributed systems often reveals that multiple dependent service calls, each individually fast, compound into a slow user-facing response, which is why instrumenting application timing matters as much as instrumenting the network.
MTU mismatches and fragmentation cause a specific, recognizable pain: connections that work fine for small payloads but stall or hang on larger transfers. Routing asymmetry, where traffic takes one path outbound and a different path back, hides the true source of delay because a one-directional test only sees half the picture. QoS policers and rate limiters cause latency that looks like random loss, but shows up as consistent drops once traffic crosses a specific bandwidth threshold.
Diagnostic signs worth memorizing:
- Hop-by-hop RTT increase that persists at every subsequent hop signals queuing upstream of that point.
- Rising queue depth in interface telemetry, even without packet loss yet, predicts loss that's about to happen.
- Interface errors (CRC, runts, giants) point to a physical layer or duplex mismatch problem, not congestion.
- Retransmits visible in a packet capture confirm loss the network layer alone won't show you.
Which Tools Actually Measure Network Latency?
No single tool answers every latency question, and the SERP consensus around this topic exists because engineers genuinely need a mental map of which tool proves what. Lightweight active probes like ping, traceroute, and mtr are your first move on any incident: fast, universally available, and good for confirming reachability and getting a rough read on where delay accumulates hop by hop. mtr in particular combines the two, giving you a continuously updating traceroute with loss and latency stats per hop.
TCP and UDP synthetic tests fill the gap ICMP leaves open. hping3 lets you craft TCP SYN probes against a specific port, which matters because ICMP responses are frequently deprioritized or rate-limited by routers and firewalls, producing latency and loss numbers that don't reflect what your actual application traffic experiences. iperf measures throughput and latency under sustained load, which exposes congestion issues that a single ping packet will never trigger.
Continuous probing platforms close the visibility gap between one-off tests and 24/7 monitoring. smokeping has run in production networks for over two decades because it graphs latency distribution over time rather than a single snapshot, making transient spikes visible in a way a manual ping never will. Pairing Prometheus with blackbox_exporter gives you the same continuous-probing philosophy in a modern, alertable stack: blackbox_exporter runs the ICMP, TCP, or HTTP probes, Prometheus stores the time series, and Grafana turns that into dashboards your team actually looks at during an incident. TestMy.net offers a simpler, browser-based option for one-off bandwidth and latency spot-checks when you need a quick outside-in read without deploying agents.
Packet capture with tcpdump or Wireshark is your verification layer, not your first move. Capture only after active tests and telemetry have narrowed the problem to a specific segment, because full packet capture on a busy link generates more data than any human should sift through blind.
What each category actually proves, and where it falls short:
- Ping and traceroute confirm reachability and rough path latency fast, but ICMP can be deprioritized, producing misleading numbers on some networks.
- mtr and hping3 isolate the hop or port where delay appears, but a single test run can miss intermittent issues that only show up under load.
- smokeping, Prometheus, and blackbox_exporter catch trends and recurring spikes over time, but need proper alert tuning or they generate noise instead of signal.
- tcpdump and Wireshark prove exactly what happened at the packet level, but only for the window you captured, and only after you know where to point them.
How Do You Troubleshoot a Latency Spike Step by Step?
A defensible workflow gets you to root cause faster and gives you something to show in the post-mortem. This is the sequence most large-network teams converge on, and it exists because skipping steps to jump straight to packet capture wastes more time than it saves.
- Detect. An alert fires on a percentile breach, not a raw threshold. Confirm the alert against your baseline before doing anything else.
- Confirm scope. Determine who is affected: one site, one service, one region, or everyone. Scope determines whether you're chasing a local link or a core infrastructure issue.
- Isolate the segment. Run
mtrfrom the affected endpoint toward the destination and watch for the hop where RTT jumps and stays elevated at every hop after it. - Run synthetic TCP/UDP tests. Confirm the ICMP-based finding with
hping3oriperfagainst the actual service port, since ICMP alone can mislead. - Pull flow and telemetry data. Check interface counters, queue depth, and flow records (sFlow or IPFIX) for the isolated segment to confirm congestion or errors.
- Capture packets for verification. Run
tcpdumpon the narrowed segment to catch retransmits, out-of-order packets, or protocol-level anomalies. - Remediate and validate. Apply the fix, then rerun your synthetic tests against the same baseline window to confirm the percentile has actually recovered.
Before escalating to another team, collect timestamps of the first alert, the affected path or service, any recent changes (deploys, config pushes, maintenance windows), and a side-by-side comparison against your baseline. Escalating without this package is how incidents drag on for hours instead of minutes.
Pro Tip: Test from both directions whenever you suspect asymmetric routing. A path that looks clean outbound can be carrying all the delay on the return leg, and a one-directional test will never reveal it.
Close every incident with a short post-mortem that checks whether your SLO threshold held up. If the alert fired too late, or too often, tune the percentile window or the alert's business-impact threshold rather than just raising the number until it stops paging you. Netverge's network troubleshooting runbook guidance covers how to formalize this sequence into a repeatable team process.
How Do You Build Continuous Latency Monitoring at Scale?
A monitoring architecture that scales past a handful of sites needs distributed probes at the edge, not just a single monitoring server pinging everything from headquarters. Edge collectors, whether hardware appliances or lightweight software agents, measure latency from the vantage point that actually matters: the branch office, the remote data center, the customer-facing edge. That data feeds into a centralized time series store where it's correlated against APM traces and host-level metrics like CPU, memory, and disk I/O.

Alerting rules built on raw thresholds generate noise. Composite alarms that require a percentile breach to persist across a trend window (say, P95 above target for 10 consecutive minutes) filter out transient blips while still catching genuine degradation. Tie the threshold to business impact rather than a convenient round number: an SLO of "P99 checkout latency under 500ms" means something to a business stakeholder in a way that "ping under 50ms" never will.
Retention strategy matters more than most teams plan for. High-resolution traces needed for P99 root-cause investigation eat storage fast, so most architectures keep full-resolution data for a shorter window (days) and roll up to coarser aggregates for longer-term trend analysis (weeks or months). You need the high-resolution window to be long enough to catch the incident before someone asks "what happened last Tuesday at 3am."
Practices worth building into any monitoring rollout:
- Correlate network telemetry with host metrics and application traces in the same dashboard, not three separate tools.
- Use trend-window composite alarms instead of instant single-sample thresholds to cut alert fatigue.
- Keep high-resolution data long enough to investigate any P99 spike reported within your incident SLA.
- Review SLO thresholds quarterly against actual traffic patterns, not once at initial deployment.
Pro Tip: When investigating a tail-latency incident, stitch your packet capture timestamps, flow records, and application trace IDs onto one timeline before drawing conclusions. Isolated data sources each tell part of the story, and the correlation is usually where the real root cause hides.
Netverge's guidance on infrastructure monitoring and management covers how distributed monitoring architectures map onto multi-site environments where a single pane of visibility replaces a dozen disconnected point tools.
How Do You Read Latency Commands in Practice?
Commands only help if you know what the output is telling you. Here's the minimal set worth memorizing.
mtr combines traceroute and ping into a continuously updating hop-by-hop view:
mtr -rwzbc 100 8.8.8.8
Watch the "Loss%" and "Avg" columns per hop. A jump in average RTT that persists at every hop after a specific router points to queuing or congestion at that hop. If loss appears at one hop but disappears at the next, that hop is likely rate-limiting ICMP rather than actually dropping traffic, a common false positive worth knowing before you escalate.
traceroute (or tracert on Windows) gives a single-pass hop list:
traceroute -n -q 3 example.com
ping remains the fastest reachability check:
ping -c 20 -i 0.2 example.com
hping3 sends TCP SYN packets to a specific port, bypassing ICMP deprioritization entirely:
hping3 -S -p 443 -c 10 example.com
This matters specifically because production services often deprioritize or block ICMP while leaving the actual application port wide open, so a ping test can show 40% loss on a link that's serving HTTPS traffic without a hiccup.
tcpdump to catch retransmits and out-of-order packets:
tcpdump -i eth0 'tcp[tcpflags] & (tcp-syn|tcp-fin) != 0' -w capture.pcap
In Wireshark, filter for tcp.analysis.retransmission to isolate every retransmitted segment in a capture, or tcp.analysis.out_of_order to find sequencing problems. Both patterns typically map directly to application-level retries. If your application logs show a request retried three times before succeeding, cross-referencing the capture timestamp against those retries usually confirms whether the network or the application caused the delay.
Pro Tip: When ICMP results and application complaints disagree, trust neither until you've run a TCP or UDP synthetic test against the actual service port. Replicating production traffic is the only way to rule out ICMP-specific artifacts.
How Do You Monitor Latency for VoIP and Real-Time Apps?
Real-time applications punish tail latency and jitter in a way batch workloads never will. A web page that loads in 300ms instead of 200ms is barely noticeable. A VoIP call with jitter spiking to 100ms produces audible stutter that users notice immediately and complain about within seconds.
Jitter, formally packet delay variation (PDV), is the metric that determines whether a call sounds clean or broken. One-way delay matters more than RTT for VoIP because humans notice conversational lag well before they'd notice the equivalent round-trip number on a data transfer. Packet loss above roughly 1% starts degrading perceived call quality noticeably, and Mean Opinion Score (MOS), a 1 to 5 scale derived from measured jitter, loss, and delay, gives you a single number that approximates what a human caller would actually rate the call.
Realistic targets for a VoIP-quality path: one-way delay under 150ms, jitter under 30ms, and packet loss under 1%. Tail percentiles matter enormously here because a P50 that looks fine can still deliver a P99 jitter spike that ruins one call in twenty, and averages will never surface that pattern on a dashboard.
Points worth building into any real-time monitoring setup:
- Measure with UDP-based synthetic probes that mimic RTP traffic, not ICMP, since ICMP behaves nothing like the media stream you're actually protecting.
- Track jitter and MOS continuously, not just during reported incidents, since call-quality complaints often lag the actual degradation by hours.
- Set alert thresholds on the tail (P95/P99), not the mean, because a handful of bad calls out of thousands is exactly what tail percentiles are built to catch.
Netverge's real-time monitoring methods guide goes deeper into telemetry patterns specific to VoIP and video infrastructure.
What Do Experienced Engineers Watch For That Others Miss?
The single biggest time sink in latency troubleshooting is trusting ICMP results without a TCP or UDP cross-check. Ping tells you a device is reachable. It does not reliably tell you what your application is experiencing, because routers along the path frequently treat ICMP as lower priority than the traffic you actually care about.
Asymmetric routing is the second trap. Testing only in one direction can leave the real source of delay completely invisible, since the outbound path and the return path can traverse entirely different infrastructure. Always test from both endpoints when a latency complaint doesn't match what your one-directional monitoring shows.
Microbursts deserve more attention than they usually get. A link can average well under capacity over a five-minute polling interval while still saturating for a few hundred milliseconds multiple times a second, and high-frequency telemetry on queue depth and per-interface counters is often the only way to catch that pattern before it causes visible packet loss. Standard five-minute SNMP polling will average right past it.
Before reaching for a packet capture, run through this quick checklist:
- Compare current metrics against your established baseline, not against a gut feeling of "normal."
- Check the recent change log: deploys, firmware updates, routing changes, and maintenance windows.
- Confirm the scope: one user, one site, one service, or a wider blast radius.
- Note the exact time window the issue started and whether it correlates with a traffic pattern.
- Check interface error counters before assuming the problem is purely a bandwidth or congestion issue.
Pro Tip: Correlate telemetry, flow data, and host metrics on one timeline before you draw a conclusion. Validating a fix against application transaction timing and control-plane events like deploys prevents the false confidence that comes from a graph that just happens to look better.
What Operational Habits Actually Cut Resolution Time?
Most teams treat latency monitoring as a tooling problem. It's really a habits problem, and the tooling only pays off once the habits are in place.
Maintaining a live baseline is the habit that separates fast resolution from guesswork. A team that knows what "normal" looks like for every critical path can spot an anomaly in the first two minutes of an incident. A team without one spends the first twenty minutes just arguing about whether the current numbers are actually bad.
Running periodic synthetic tests, not just monitoring passively, catches degradation before a customer does. A synthetic probe that fires every 60 seconds against your top five service paths costs almost nothing to run and buys you an early warning that passive monitoring alone won't give you, since passive monitoring only sees the traffic that happens to be flowing at that moment.
Quarterly SLO reviews matter more than teams give them credit for. Traffic patterns shift, infrastructure changes, and a threshold set eighteen months ago against a smaller footprint stops meaning anything relevant. Automating post-change validation, running your synthetic test suite automatically after every deploy or config push, catches regressions before they become customer-facing incidents rather than after.
Runbook ownership matters as much as the runbook itself. A troubleshooting workflow nobody owns goes stale fast: steps reference tools that got decommissioned, escalation contacts that changed teams, thresholds that no longer match current traffic. Assign an owner, test the runbook against a simulated incident twice a year, and treat gaps found during that test as bugs to fix immediately, not backlog items.
Automation and shared knowledge systems reduce how much of this depends on one engineer's memory. A knowledge graph that links a symptom (rising P99 on a specific service) to historical incidents and their root causes turns tribal knowledge into something the whole team can query, instead of something that walks out the door when one senior engineer changes jobs.
How Netverge Consolidates Latency Monitoring and Troubleshooting
Everything covered here (baselines, percentile-driven alerts, synthetic probes, packet-level verification, telemetry correlation) usually lives in five or six disconnected tools, each with its own dashboard and its own login. Netverge consolidates that stack into a single platform built specifically for MSPs and multi-location enterprises that need continuous, edge-to-core latency visibility without stitching together smokeping, Prometheus, and a packet-capture tool by hand.

The platform maps directly onto the workflow in this article:
- Distributed probes and edge collectors give you the site-by-site vantage point that catches latency where users actually experience it, not just from a central monitoring server.
- Vergepoints hardware provides plug-in, on-site network visibility for locations where a software agent alone won't cut it.
- Integrated telemetry and anomaly detection correlate network, host, and application signals automatically, replacing the manual timeline-stitching that root cause analysis usually demands.
- AI-powered ticketing and automated troubleshooting cut the time between an alert firing and a technician having enough context to act.
If your team is currently juggling separate tools for probing, alerting, and packet-level verification, exploring the monitoring platform is a reasonable next step, and scheduling an architecture review is the fastest way to see how your existing probes and telemetry sources would map onto it.
Where to Go for Deeper Technical Reference
A handful of standards and technical references are worth bookmarking for anyone building a serious latency monitoring practice:
- RFC 6374 defines timestamp-based delay measurement for MPLS networks and is the reference point for understanding one-way versus two-way delay computation and clock synchronization requirements.
- RFC 7928 covers AQM characterization guidelines, including sampling strategy and the latency-versus-goodput trade-off that matters when tuning queue management.
- RFC 8912 documents the IANA registry of IP performance metrics and is the best source for standardized percentile-based reporting definitions.
- The AWS networking and content delivery blog offers practical guidance on why ICMP misleads and how to build synthetic tests that mirror production traffic.
- Rivell's overview of network monitoring importance is a useful primer for framing the business case behind continuous latency visibility to non-technical stakeholders.
- For packet capture strategy specifically, Rivell's comparison of network taps versus SPAN ports is worth reading before deciding how to get visibility into a segment you plan to capture from.
Frequently Asked Questions
What's the difference between latency and jitter? Latency is the delay a single packet takes to travel from source to destination and back. Jitter is the variation in that delay across consecutive packets. A network can have moderate latency and near-zero jitter and feel smooth, or the same average latency with high jitter and feel completely broken for real-time traffic like voice calls.
Why does ping sometimes show packet loss when the application works fine?
Many routers and firewalls deprioritize or rate-limit ICMP traffic, the protocol ping uses, while passing the actual application traffic (usually TCP or UDP) without issue. Running a TCP-based probe like hping3 against the real service port gives a far more accurate picture than ICMP alone.
What percentile should I alert on for latency? P95 and P99 are the standard starting points for most SLO-backed services. Averages hide the spikes that actually generate support tickets, so alerting on the 95th or 99th percentile catches degradation affecting your worst-served users well before it shows up in a mean.
How often should I run synthetic latency tests? For critical, revenue-affecting paths, probes running every 30 to 60 seconds give you early warning without generating excessive traffic overhead. Less critical paths can run on a longer interval, but any path with a customer-facing SLO deserves frequent, scheduled synthetic checks rather than reactive monitoring alone.
Is high latency always a network problem? No. Storage bottlenecks, CPU or interrupt saturation on a host, and slow application-layer processing can all add delay that looks identical to network latency from the client's perspective. Instrumenting application-level timing alongside network probes is the only way to tell the two apart reliably.
Sources
- RFC 8912 — IANA Registry of Performance Metrics (IPPM)
- Network latency concepts and best practices for a resilient architecture | Networking & Content Delivery
- Measuring and monitoring latency in high-performance data centers
- Debugging network induced latency round trips | ADHDecode