
Effective packet loss monitoring reliably detects loss, localizes it by correlating active probes with device and host metrics, and triggers actionable alerts that include ownership context. The minimum confirmation signal is three-sided: active probe loss, interface drops on the affected devices, and host-level retransmits pointing the same direction. When those three agree, run ping and mtr, pull SNMP counters, and take a quick packet capture before you touch anything else.
TL;DR:
- Effective packet loss monitoring requires correlating active probes, passive telemetry, and host metrics, not relying on a single signal that can produce false positives.
- Use multiple vantage points for active checks like mtr and iperf3, alongside interface counters and packet captures, to accurately localize the loss source.
- Loss episodes and burst patterns matter more than average loss percentage, especially for real-time applications such as VoIP and video, which are highly sensitive to even low loss levels.
- Alerts should be based on persistent signals across multiple metrics and require confirmation from at least two sources before escalation to reduce false alarms.
- Troubleshooting workflows include reproducing symptoms, narrowing scope with multi-point testing, analyzing two-sided packet captures, and addressing physical, congestion, or MTU issues specifically.
Table of Contents
- What Is Packet Loss Monitoring and Why Single Metrics Fail
- Active Vs. Passive Monitoring: Which Tools Fit Each Stage
- What Metrics Actually Matter, and What Thresholds Make Sense
- How Do You Troubleshoot Packet Loss Step by Step?
- How Wireless, Tunnels, and Provider Links Change the Diagnosis
- Building Alerts That Engineers Actually Trust
- How a Unified, AI-Assisted Approach Handles This in Practice
- When to Escalate to Your Provider
- Get Cross-Layer Visibility Without Stitching Tools Together
- Sources
- FAQ
What Is Packet Loss Monitoring and Why Single Metrics Fail
Packet loss monitoring is the ongoing practice of measuring, correlating, and alerting on dropped packets across every layer of a network path, not just the one metric that happens to be easiest to check. Most teams start with a single ping check and stop there. That's a mistake. A ping timeout tells you loss occurred somewhere between two points, but it says nothing about where, why, or whether it matters to the applications running over that link.
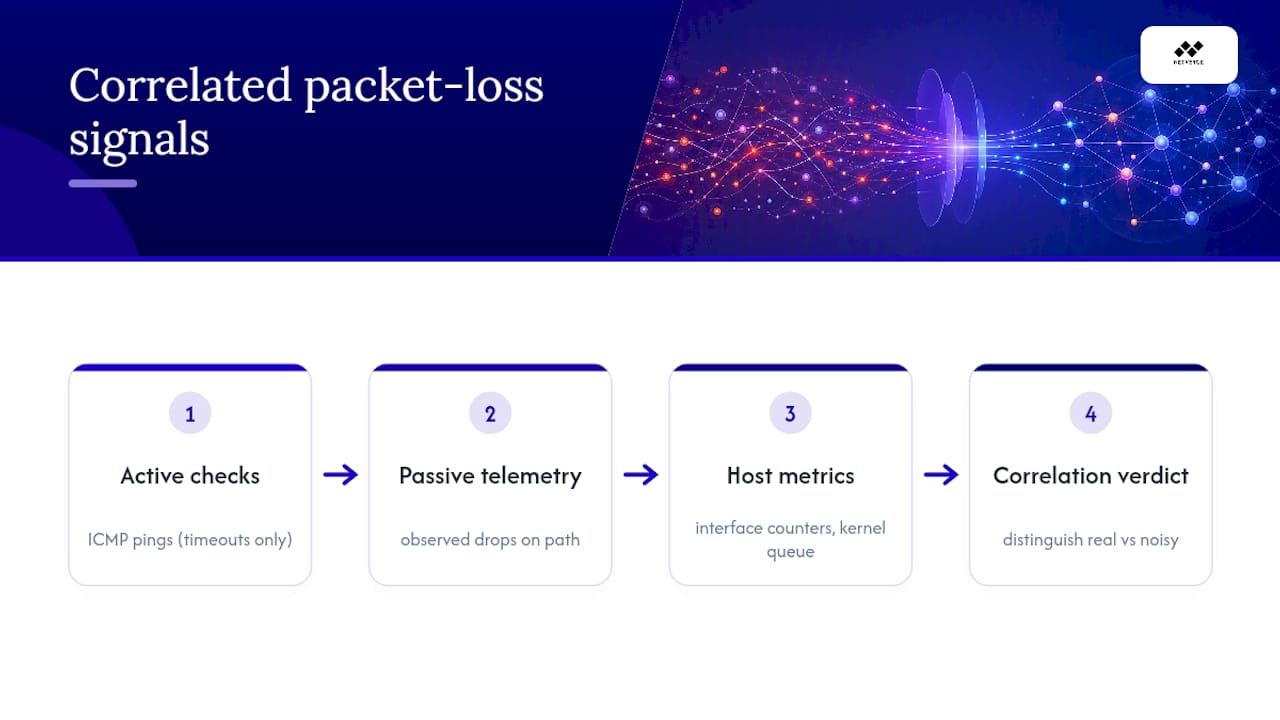
A reliable approach combines active checks, passive telemetry, and host metrics, because relying on any single signal tends to produce false positives and wasted troubleshooting cycles. If your monitoring stack only watches ICMP loss, you'll chase phantom outages caused by router-side rate limiting. If it only watches interface counters, you'll miss loss happening inside a host's kernel queue where the interface itself reports clean. Packet loss detection has to work across layers, or it doesn't work at all.
Active Vs. Passive Monitoring: Which Tools Fit Each Stage
Active probes generate their own traffic to test a path; passive telemetry reads counters and flow data the network already produces. You need both, and they answer different questions.
- Ping confirms basic reachability and gives a rough loss percentage over a fixed interval, but a single ping run is a snapshot, not a trend.
- mtr combines traceroute and ping into a continuous per-hop view, which is why it's the better tool for catching intermittent path instability that a one-time ping would miss, according to NetBeez's testing guidance.
- iperf3 pushes real throughput across a link, and its UDP mode is the standard way to baseline loss under load rather than idle-state loss.
- SNMP interface counters (errors, discards, output drops) tell you whether a specific device port is dropping traffic, independent of what any probe reports.
- NetFlow or sFlow records show which conversations are consuming bandwidth when congestion is the suspected cause.
- Wireshark or tcpdump captures give you the packet-level proof: retransmissions, out-of-order segments, and TCP resets that confirm loss instead of just implying it.
For packet capture to mean anything during troubleshooting, capture on both sides of the suspected problem, not just one. A capture at the sender showing clean transmission alongside a capture at the receiver showing gaps is the clearest evidence you can bring to a root-cause discussion. Agent-based monitoring (installed software reporting host metrics) gives deeper visibility than agentless polling, but agentless SNMP and flow collection scale better across large device counts. Run synthetic checks every 30 to 60 seconds on WAN links and provider circuits. LAN segments can tolerate a longer interval since congestion there tends to be bursty rather than sustained.
What Metrics Actually Matter, and What Thresholds Make Sense
Loss percentage alone hides the pattern that determines whether users notice anything. RFC 6534 defines loss-episode metrics precisely because two links with identical 1% average loss can produce wildly different user experiences: one drops packets in a steady trickle, the other in bursts that wipe out entire VoIP frames. Episode duration and frequency matter as much as the average.
By the numbers: RFC 6534's probing methodology exists specifically because bursty, episode-shaped loss tends to damage real-time applications more severely than the same average loss rate spread evenly across time.
Track these alongside your loss percentage:
- Device counters: rx_errs, rx_dropped, tx_dropped, and output drops, pulled via
show interfaceson Cisco gear or the SNMP equivalent on other vendors. - Host metrics: TCP retransmit counts and socket drop counts, which reveal loss the network layer never reports because it happened inside the kernel.
- Loss episodes per hour, not just percentage, especially on links carrying voice or video traffic.
Practical thresholds depend on what's riding the link. Inside a datacenter or LAN, very low loss is worth investigating immediately because that environment should be nearly lossless. On a WAN circuit, small loss percentages are the range where you start asking questions, though many WAN links run acceptably at low loss rates. VoIP and video conferencing can show noticeable degradation at low loss levels, because a single dropped packet can wipe out a syllable or a frame. Tie every threshold to service impact, not to a number that feels round.
Avoid chasing false positives caused by ICMP rate-limiting on routers (which throttles ping replies under load, not actual traffic), asymmetric routing (where the return path differs from the forward path and skews loss attribution), and probe packet size (small ping packets can sail through paths that would drop larger, real-world frames). Correlating TCP retransmits with interface counters helps you tell the difference between host-side congestion and an actual physical link failure before you escalate.
How Do You Troubleshoot Packet Loss Step by Step?
A repeatable workflow beats improvising under pressure every time. Here's the sequence that gets you to root cause fastest:
- Validate the symptom. Reproduce the loss, timestamp it precisely, and pull whatever probe or alert data already exists for that window. If you can't reproduce it, you're troubleshooting a ghost.
- Narrow the scope. Run mtr from multiple vantage points toward the affected destination. Compare hop-by-hop loss patterns and check the interface counters on devices adjacent to where loss appears to start.
- Confirm with iperf3 and packet captures. Run a UDP iperf3 test to establish a throughput-grade loss baseline, then take two-sided packet captures. Comparing sender and receiver captures is the definitive way to prove where packets actually disappear.
- Remediate by cause. Congestion calls for QoS policy or added capacity. NIC and kernel-level drops often respond to increasing ring buffers, enabling multi-queue, and tuning sysctl values like
net.core.netdev_max_backlogand the TCP read/write memory buffers. Physical issues mean checking cables and SFP modules for errors. MTU mismatches on tunnels need a DF-bit ping test to confirm. Wireless problems need an RF-specific fix, covered below. - Document and adjust. Write the root cause analysis, update your alert baselines if the incident revealed a threshold that was too loose or too tight, and schedule any capacity or configuration change the incident exposed.
Pro Tip: Keep a standing packet capture template ready for each core segment of your network. When loss hits at 2 a.m., you don't want to be building a capture filter from scratch. Have the interface names, filter syntax, and destination file paths pre-staged so a two-sided capture takes minutes, not twenty.
Cisco's own troubleshooting documentation for Catalyst switches emphasizes checking queue metrics and flow-control behavior at the device level, since output drops and buffer exhaustion often point directly to the congested hop before you ever open a packet capture. This step alone resolves a surprising share of escalations without needing a full capture at all.
How Wireless, Tunnels, and Provider Links Change the Diagnosis
Wireless loss almost never responds to the fixes that work on wired congestion. Treating a Wi-Fi problem like a switch-port problem wastes time and usually makes the wrong change.
- Wireless indicators: check SNR, retransmissions at the 802.11 layer, and co-channel interference from neighboring access points. Wi-Fi troubleshooting genuinely needs an RF measurement lens, including site surveys, rather than the QoS or buffer tuning that fixes wired congestion.
- MTU and tunnel issues: ping with the DF (Don't Fragment) bit set and vary packet size incrementally to find the actual path MTU. Encapsulation overhead on VPN or SD-WAN tunnels routinely shrinks usable MTU below the 1500 bytes engineers assume by default.
- Provider-edge links: test from multiple vantage points before opening a ticket with your ISP. A single-location ping test rarely convinces a carrier's support desk of anything.
For sites depending on SD-WAN overlays, multi-vantage testing matters even more, since overlay performance can mask underlying transport loss until you test from both sides of the tunnel independently.
Building Alerts That Engineers Actually Trust
An alert that fires on a single missed ping trains your on-call team to ignore alerts. Gate every packet-loss alert on persistence across a rolling window, not a single failed check, and require agreement across at least two signal types before paging anyone.
- Combine signals: probe loss persistence, interface counter trends, and host retransmit counts should all point the same direction before an alert escalates to high severity.
- Include context in the payload: affected target or service, the vantage point that detected it, supporting metrics, how long the condition has persisted, and the likely owning team.
- Use confirmation retries: a probe that fails once retries within seconds before counting as a real event, which filters out transient blips.
- Map severity to service impact: loss on a VoIP trunk deserves a faster escalation path than the same loss percentage on an overnight backup link.
By the numbers: Actionable alerts, according to practitioner guidance on packet loss detection, need to name the affected target, the vantage point, supporting metrics, and likely ownership. An alert missing any of those fields forces the on-call engineer to spend the first ten minutes just figuring out what the alert is telling them.
A workable rule looks like this: if probe loss exceeds a low, service-dependent threshold persistently and interface output drops rise on the same device during that time, escalate as high severity and page the network on-call directly. Anything short of that double confirmation stays at a lower severity tier and waits for daytime review. Building this logic into a structured monitoring workflow keeps false pages from eroding trust in the alerting system itself.
How a Unified, AI-Assisted Approach Handles This in Practice
The cross-layer correlation this article recommends, active probes, device counters, and host telemetry read together, is an effective operating model for network monitoring platforms. Its platform pulls interface counters, flow data, and host metrics into one telemetry stream, then applies AI-driven anomaly detection to flag the combination of signals that actually indicates a real problem rather than a single noisy metric.
Network monitoring hardware extends visibility to the physical edge, allowing teams a local vantage point for active probing without deploying separate appliances for every test type. When correlated signals cross a threshold, a platform's ticketing and triage layer can open a ticket automatically, pre-populated with the supporting metrics and likely ownership, mirroring the alert payload structure described earlier in this guide. That mapping from raw telemetry to an actionable, triaged ticket is what turns a detection workflow into a resolution workflow. Teams evaluating this approach can review the monitoring platform directly.

When to Escalate to Your Provider
Escalation is a judgment call, but the evidence bar shouldn't be. If loss shows up consistently across multiple vantage points and stops right at your edge router's WAN interface, the problem almost certainly sits upstream, and it's time to open a ticket rather than keep tuning your own gear.
Bring the provider three things: mtr output from at least two source locations showing the same hop failing, two-sided packet captures if you have them, and precise timestamps tied to the impacted service. Vague tickets get vague responses. A ticket that says "intermittent loss around 3 p.m., confirmed via mtr from two sites, VoIP quality degraded during that window" gets escalated internally on the provider's side far faster than "internet seems slow."
Keep a short checklist ready before you call: reproducible evidence, affected service named explicitly, and a clear ask (credit, escalation, or a scheduled maintenance window).
— Jim
Get Cross-Layer Visibility Without Stitching Tools Together
Most teams cobble packet loss monitoring together from three or four disconnected tools: a ping-based uptime checker, a separate SNMP poller, and a packet capture tool nobody remembers how to configure under pressure. Some platforms replace that stack with one solution that correlates active probes, interface counters, and host telemetry as recommended, so alerts include ownership context and supporting metrics.

If you're evaluating a monitoring platform, run it through a short checklist: does it support multiple vantage points for active probing, does it ingest passive telemetry alongside synthetic checks, and does its alert schema include persistence windows and likely ownership out of the box? Netverge's monitoring platform is built around exactly that structure, with Vergepoints hardware handling on-site visibility and AI-driven triage feeding straight into automated ticketing. Start a trial and point it at a link you already suspect is lossy. You'll see within a day whether the correlated view catches something your current tools have been missing.
Sources
- RFC 6534 — Loss Episode Metrics for IPPM
- Master packet loss detection: Monitor and alert your network
- How to Run a Packet Loss Test: 6 Tools for Testing Packet Loss — NetBeez
- Packet loss explained: causes, detection & how to fix it — Flowtriq
FAQ
How Do I Monitor Packet Loss?
Combine active probes (ping, mtr, iperf3) with passive telemetry (SNMP interface counters, flow records) and host-level metrics (TCP retransmits), then correlate all three before alerting. Single-metric monitoring produces frequent false positives and misses loss that happens inside a host's kernel.
Is 2.7% Packet Loss Bad?
Yes, for most applications. On a WAN link, anything above roughly 1% is worth investigating. VoIP and video conferencing can show noticeable degradation at low loss levels because a single dropped packet can wipe out a syllable or a frame, even though bulk file transfers might tolerate loss with retransmission overhead.
Why Am I Getting 90% Packet Loss?
Loss that severe usually points to a near-total link failure, a misconfigured routing path, ICMP rate-limiting skewing your ping results, or a saturated interface dropping nearly everything. Run mtr from a second vantage point immediately to confirm whether the loss is real or a probe artifact from rate limiting.
How Do I Check if I Am Getting Packet Loss?
Run a sustained ping or mtr session against a stable target for several minutes, then cross-check the result against SNMP interface counters on the relevant devices. If both the probe and the counters show drops in the same window, the loss is confirmed and not a probe artifact.
What Loss Threshold Should Trigger an Alert?
Thresholds depend on the service: datacenter and LAN links should alert above 0.1% loss, WAN circuits typically alert in the 0.5% to 1% range, and VoIP or video traffic warrants alerting at loss rates as low as 0.1% because of how sensitive real-time media is to dropped packets.