WAN performance monitoring means continuously measuring latency, jitter, packet loss, and Mean Opinion Score (MOS) across every link that carries business traffic, then correlating that telemetry against SLA thresholds. The immediate action for most teams: deploy distributed monitoring points at each site, run synthetic tests against your critical applications, and build a baseline before you touch alert thresholds. Skip the baseline and every alert configuration you write afterward is a guess.
TL;DR:
- Baseline data over two weeks at each site to account for different circuit types before setting alert thresholds.
- Monitoring should include synthetic tests, passive traffic capture, device SNMP polling, and flow analysis, layered for comprehensive insights.
- Separate overlay and underlay metrics to detect issues in SD‑WAN tunnels before they impact end-user experience.
- Deploy monitoring points at remote sites, data centers, cloud egress points, and upstream of NAT or encapsulation for full-path visibility.
- Use automated tools with AI-driven anomaly detection and correlation to reduce manual troubleshooting time and improve incident response.
Table of Contents
- What Are the Core WAN Performance Metrics?
- How Does WAN Monitoring Actually Work?
- Why Separate Overlay and Underlay Metrics in SD‑WAN?
- Where Should You Deploy Monitoring Points?
- How Do You Set Thresholds Without Causing Alert Fatigue?
- How Do You Troubleshoot a WAN Performance Incident?
- Operational Checklist for Enterprise WAN Monitoring
- Should WAN Monitoring and Security Tools Share Data?
- How Do 5G and Cloud Services Change WAN Monitoring?
- How Do You Scale Monitoring Across Large or Dynamic Networks?
- Can Automation and Machine Learning Make WAN Monitoring Proactive?
- Netverge Perspective: Where Automated Tooling Actually Helps
- See What Netverge Catches Before Your Team Does
- Sources
What Are the Core WAN Performance Metrics?
Five metrics carry almost all the diagnostic weight in enterprise WAN performance analysis. Latency (RTT) measures round-trip delay between two points and directly affects how responsive an application feels. Jitter captures the variation in that delay, which matters enormously for voice and video because inconsistent spacing between packets causes audio glitches even when average latency looks fine. Packet loss measures the percentage of packets that never arrive, and even small amounts (1 to 2 percent) degrade VoIP call quality noticeably. Throughput tracks how much data actually moves across a link versus its provisioned capacity. MOS, scored 1 to 5, distills the first three into a single number a help desk technician can act on without a networking background.
Latency, jitter, packet loss, and MOS are the same figures WAN teams use to drive SD‑WAN path selection and SLA-based switching for latency-sensitive traffic.
Rough thresholds worth baselining against:
- VoIP and conferencing: latency under a moderate threshold for good VoIP quality, jitter low enough to avoid audio glitches, and packet loss under a minimal level acceptable for voice quality
- Interactive apps (ERP, database queries): latency kept low to maintain responsiveness, and packet loss minimized to avoid noticeable issues
- Bulk file transfer: throughput matters more than latency; tolerate higher RTT
- MOS below 3.5 usually means users are already complaining
Pro Tip: Don't set thresholds from vendor defaults. Pull two weeks of baseline data per site first, since a satellite branch and a metro data center have completely different "normal."
How Does WAN Monitoring Actually Work?
Four collection methods feed WAN performance dashboards, and each answers a different question. Synthetic testing sends manufactured probe traffic along a path on a schedule, giving you consistent, comparable measurements even when real user traffic is light. Passive capture watches actual production traffic, which reflects real experience but only when traffic is already flowing. SNMP polling pulls interface counters and device health from routers and switches, useful for utilization trends but blind to end-to-end path quality. Flow analysis (NetFlow, IPFIX, sFlow) reveals which applications and conversations are consuming bandwidth, which matters when a monitoring alert fires and you need to know why.
- Synthetic tests: consistent, proactive, works even with no live traffic
- Passive capture: reflects real user experience, requires SPAN/tap access
- SNMP: cheap and near-universal, but device-centric, not path-centric
- Flow data: explains "who" and "what," not "how well"
Most enterprise deployments run a hybrid: lightweight agents for synthetic probing at every site, SNMP for device health, and flow analysis layered on top for capacity and security context.
Pro Tip: Run core synthetic tests frequently and reserve full bandwidth tests for periodic intervals; continuous lightweight probing plus periodic deep tests catches degradation before users notice, without flooding the link you're trying to measure.
Why Separate Overlay and Underlay Metrics in SD‑WAN?
SD‑WAN adds a layer of abstraction that makes monitoring both more useful and more confusing. The overlay is the logical tunnel mesh your SD‑WAN controller builds and steers traffic across; the underlay is the physical broadband, LTE, or MPLS circuit actually carrying the bits. A tunnel can look healthy in the controller dashboard while the underlying circuit it rides on is degrading, because SD‑WAN's own path steering is masking the problem in real time. That's exactly the failure mode monitoring exists to catch.
Tunnel-level metrics worth tracking separately from raw circuit stats:
- Per-tunnel latency, jitter, and packet loss (not just the aggregate)
- Path-change count, which flags instability before a full outage happens
- BFD and OMP session state, since flapping sessions precede visible degradation
- SLA compliance percentage per tunnel against policy thresholds
Frequent path steering is an early-warning signal most teams overlook, since rising path-change counts often precede a complete tunnel failure by hours or days. To confirm your SLA-based steering policy is actually working, run independent synthetic probes across each underlay circuit, not just the controller's own telemetry. Distributed monitoring points that measure end-user experience separately from vendor dashboards give you the vendor-agnostic view needed to hold carriers to their SLAs and settle disputes with data instead of a hunch.
Where Should You Deploy Monitoring Points?
Monitoring coverage has to reach every place traffic actually degrades, not just the data center core. That means:
- Remote offices and branches — place a monitoring point at each site to measure last-mile ISP quality and inter-site path performance independently of the SD‑WAN controller's own reporting.
- Data centers and hub sites — deploy at aggregation points where multiple branch tunnels terminate, since that's where a single bad uplink can mask itself as many separate branch problems.
- Cloud egress points — monitor the path from your network edge to SaaS and IaaS providers, since that leg is often outside your carrier's SLA entirely.
- Ideally, capture upstream of NAT or encapsulation using a switch SPAN port so you see raw path behavior before SD‑WAN wraps it; where SPAN access isn't available, inline agents are the fallback.
Plan for scale early: an SD‑WAN migration typically multiplies the number of monitored paths, since every site now has multiple tunnels instead of one static circuit. Vergepoints handle this as physical, plug-and-play probes for branches that lack IT staff on-site, while lighter agentless options fit data centers where you already control the switching fabric.
How Do You Set Thresholds Without Causing Alert Fatigue?
Baselining comes before thresholding, always. Pull at least two weeks of per-site data before deciding what "normal" looks like at that location, because a branch running over cable broadband has a different baseline than one on dedicated fiber, and applying the same threshold to both guarantees false alarms at one and missed problems at the other.
- Set graduated thresholds (warning, then critical) rather than a single trip wire
- Require a violation to persist for a defined duration window before firing an alert, since a two-second latency spike that self-corrects isn't an incident
- Route alerts by type and severity, not to a single shared inbox everyone eventually mutes
- Re-baseline after any circuit upgrade, carrier change, or major traffic shift
Pro Tip: When your SD‑WAN policy changes, update your monitoring thresholds in the same change window. Monitoring configurations that drift out of sync with orchestrator policy are one of the most common causes of both alert fatigue and missed SLA violations. If the controller's policy says failover triggers at 5% loss, your monitoring threshold should not still be set at 2%.
Push threshold changes to every tenant view at once. A dashboard that shows different thresholds to different teams looking at the same circuit erodes trust in the whole monitoring stack fast.
How Do You Troubleshoot a WAN Performance Incident?
Start from user impact, not from a device alarm. A site health score that aggregates tunnel, link, and application metrics tells you scope in seconds, before you touch a single command line.
- Confirm scope — is this one site, one application, or a shared upstream path affecting several sites at once?
- Correlate telemetry — line up tunnel metrics, device health, flow data, and recent configuration changes on the same timeline; correlating controller data with independent flow analysis cuts investigation time dramatically versus checking each system separately.
- Check signatures in order — broadband brownouts first (intermittent loss without full outage), then tunnel flapping, then policy drift after a recent push, then asymmetric routing, then cloud egress congestion.
Most incidents resolve fastest when the signature check happens in that sequence, since brownouts and flapping account for the majority of SD‑WAN performance complaints.
Operational Checklist for Enterprise WAN Monitoring
A monitoring program is only as good as its weakest gap. Before calling coverage complete, verify:
- Every site has a monitoring point and an established baseline, not a default threshold
- Synthetic tests run against your actual critical apps and cloud endpoints, not just a generic ping target
- Flow capture is active alongside synthetic testing for the "who's using this link" context
- Overlay and underlay metrics are tracked and reported separately
- SLA reporting, alert routing, and capacity planning reviews run on a fixed schedule, not ad hoc
Miss any one of these and you'll find out during an outage, which is the most expensive time to discover a monitoring gap.
Should WAN Monitoring and Security Tools Share Data?
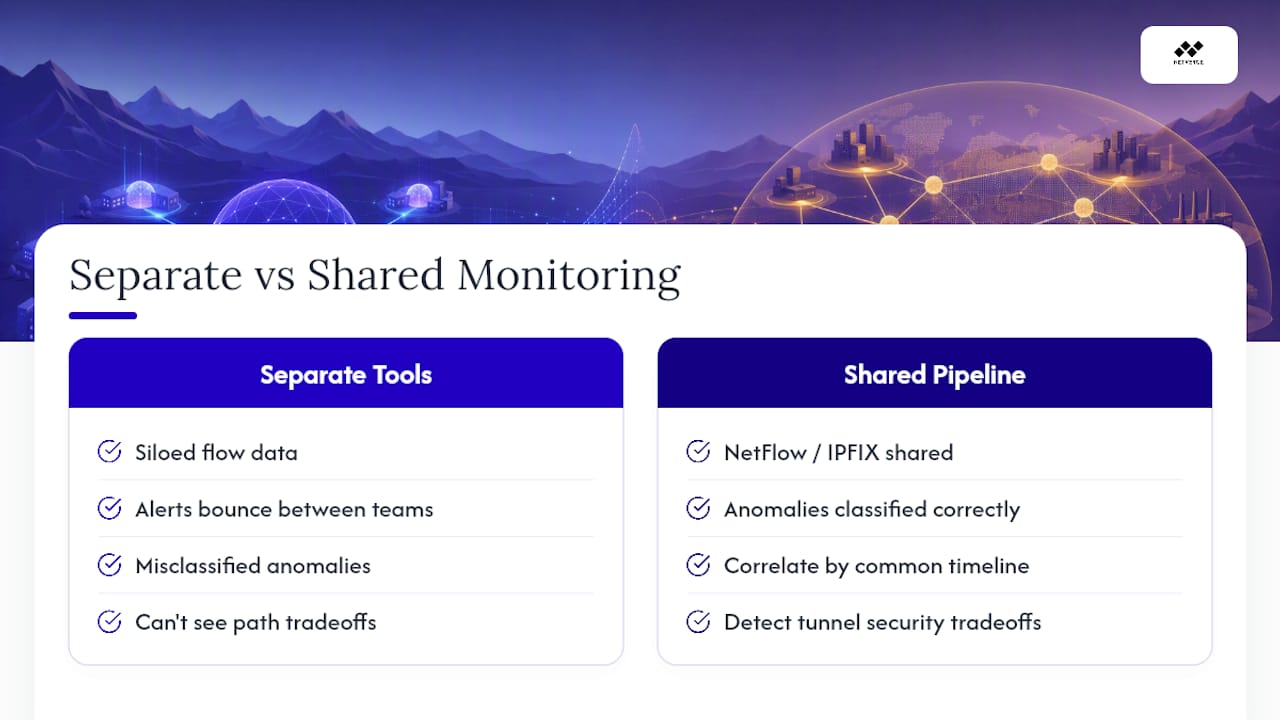
WAN performance and network security stopped being separate disciplines the moment traffic started routing through multiple internet paths instead of one hardened MPLS circuit. A packet loss spike and a security event can look identical on a graph, and treating them as unrelated wastes hours during an incident.
Flow data is the natural bridge. The same NetFlow or IPFIX records that reveal bandwidth hogs for capacity planning also reveal a compromised device suddenly exfiltrating data to an unfamiliar destination, or a DDoS attempt saturating a branch circuit and masquerading as an ordinary throughput problem. When WAN monitoring and security tooling pull from the same flow and telemetry pipeline, an anomaly gets classified correctly the first time instead of bouncing between two teams that each assume it's the other's problem.
There's a practical SD‑WAN angle too: policy-based path steering interacts directly with security posture. A tunnel that fails over to an unencrypted broadband path during a brownout might solve the latency problem while quietly creating a data exposure one, and only integrated monitoring catches that tradeoff as it happens. Secure web gateways and firewalls sitting at SD‑WAN branch edges generate their own performance overhead too, and that overhead shows up in your latency and throughput numbers, not in the security console.
The practical move is correlating WAN telemetry with security event logs on a shared timeline rather than in two dashboards nobody cross-references. When a tunnel metric and a security alert share a timestamp, that correlation alone often points straight to root cause.
How Do 5G and Cloud Services Change WAN Monitoring?
Cellular failover used to mean a slow, expensive fallback nobody wanted to use for long. 5G changes that math. Branches now run 5G as a legitimate primary or active-secondary WAN path, not just backup, which means monitoring has to treat a cellular circuit with the same rigor as fiber, tracking signal quality, carrier handoffs, and data caps alongside the standard latency and jitter figures.
Cloud adoption shifted the destination of most enterprise traffic too. A decade ago, the WAN mostly connected branches to a data center. Now a large share of that traffic heads straight to SaaS platforms and cloud infrastructure, which means the path you most need visibility into often isn't inside your network at all. Monitoring the "last mile" now frequently means monitoring the path from your edge to a cloud provider's front door, a leg that sits outside any carrier SLA and outside most legacy monitoring tools built for on-premises circuits.
Application performance also depends increasingly on infrastructure you don't control. A slow SaaS login page might be your WAN, or it might be the provider's own load balancer three network hops past your edge. Distinguishing the two requires synthetic tests that measure specifically to cloud application endpoints, not just to a generic internet target, and requires treating end-user experience, rather than any single device's up or down state, as the metric that actually matters. That shift toward full-stack observability correlating network and application performance is the direct result of traffic patterns that no longer stop at a data center.
How Do You Scale Monitoring Across Large or Dynamic Networks?
Monitoring architecture that works for 20 sites tends to buckle at 200. The math is unforgiving: every SD‑WAN site typically runs multiple tunnels across multiple underlay circuits, so a migration that looks like a 3x site increase can produce a 10x increase in monitored paths.
A few practices hold up as networks grow:
- Standardize deployment templates so every new branch gets the same monitoring point configuration, the same baseline period, and the same threshold profile structure on day one, not three weeks after go-live when someone remembers.
- Tier your alerting by business impact, not by raw metric severity. A 200-person regional office and a five-person satellite location shouldn't generate equally urgent pages for the same packet loss percentage.
- Automate baseline recalculation on a rolling schedule rather than a one-time setup, since traffic patterns shift as a business grows, adds applications, or changes carriers.
- Centralize dashboards without centralizing decisions — a network operations center needs a single-pane view across every site, but threshold tuning still has to happen locally, because a satellite office on cable broadband and a headquarters site on dedicated fiber will never share a sensible threshold.
- Build in multi-tenancy from the start if you manage networks for multiple business units or client organizations, since retrofitting tenant separation into a monitoring platform after the fact is far more disruptive than designing for it up front.
The dynamic part matters as much as the large part. Networks that add and remove sites frequently, or that shift traffic between circuits based on cost or availability, need monitoring that can onboard a new location in hours, not weeks, or the gap between deployment and visibility becomes its own operational risk.
Can Automation and Machine Learning Make WAN Monitoring Proactive?
Traditional WAN monitoring is fundamentally reactive: a threshold breaches, an alert fires, someone investigates. Machine learning changes the sequence by learning what normal looks like for each specific site and flagging deviation before it crosses a hard threshold at all.
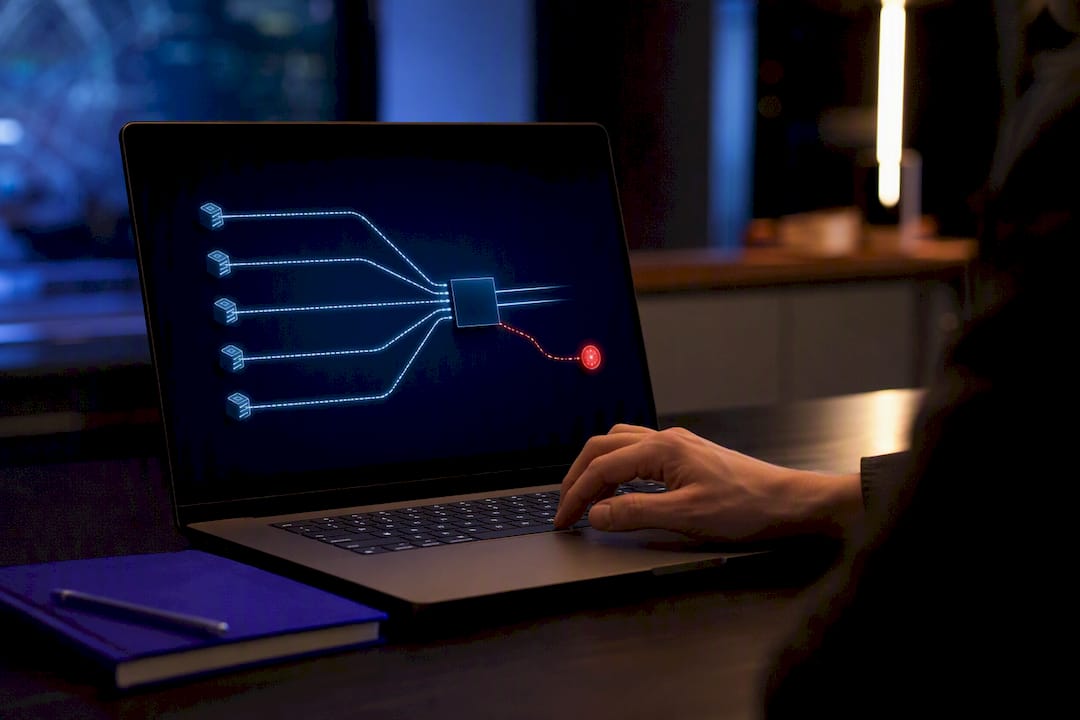
The clearest win is noise reduction. A network generating thousands of metric points per site per day produces far more signal than any team can review manually, and machine learning models trained on historical baselines can separate a genuine anomaly from routine variance, cutting the alert volume a network operations team actually has to act on. Pattern recognition also catches slow degradation that a static threshold misses entirely, like a circuit that's been gradually trending worse for three weeks without ever crossing the alert line.
Automated triage extends that further. Instead of a human reading five correlated graphs to confirm scope and likely cause, an AI agent can run that correlation automatically, flag the probable root cause, and draft the initial ticket before a technician even opens the dashboard. That doesn't replace the technician's judgment. It replaces the fifteen minutes of manual correlation that used to happen before judgment could even start, which is exactly where most mean time to resolution gets lost in a busy network operations center.
Netverge Perspective: Where Automated Tooling Actually Helps
The gap between a good WAN monitoring setup and a great one usually isn't more dashboards. It's how fast telemetry turns into an answer. Vergepoints at the branch edge, paired with AI triage and a knowledge graph connecting tunnel, device, and app data, turn a fifteen-minute correlation exercise into something closer to instant. That's the real leverage point in day-to-day operations.
— Jim
See What Netverge Catches Before Your Team Does
Netverge replaces the patchwork of SNMP tools, spreadsheet baselines, and separate security dashboards this article just walked through with one observability layer built for exactly this job. Distributed Vergepoints handle branch and data center placement automatically, AI-driven anomaly detection flags degrading tunnels before they breach SLA, and a knowledge graph correlates telemetry across sites so root cause shows up in the ticket, not buried in five separate graphs your team has to line up by hand.

If you're managing WAN performance across more than a handful of sites, manual correlation is the bottleneck, not the network itself. Visit the Netverge monitoring platform to request a demo and see how automated triage handles a real incident from your own network in minutes instead of hours.
Sources
- Key SD-WAN Performance Metrics That Matter
- Monitoring an SD‑WAN Installation (AppNeta)
- SD‑WAN monitoring and policy configuration (white paper)