
Traceroute monitoring runs path traces on a schedule, from fixed source points to fixed targets, and records every router hop, its latency and its loss over time. A single manual traceroute tells you what the path looks like right now. A monitored one tells you when the path changed, which hop changed with it, and whether the change lines up with the slowdown a user reported. For MSPs and multi-site IT teams, that history is what turns a vague "the internet is slow at the branch" ticket into a specific diagnosis. Netverge builds this kind of context into its monitoring platform: path and performance signals sit next to sensors, documentation and tickets instead of in separate tools.
TL;DR
- Traceroute monitoring repeats path traces on a schedule and stores per-hop latency, loss and route changes, so you can compare a bad moment with a good one.
- A timeout or a latency spike at one middle hop is often not a fault. A problem that continues through every later hop to the destination is the one that matters.
- Traceroute is strong for validation and for narrowing a search, but weak as sole proof of root cause. Confirm it against latency, packet loss and routing data.
- Run traces from every site and probe that represents a real user path, not just from one central location.
- Automate the collection and the first diagnosis. Keep a human approval step before any change to production.
Table of Contents
- What traceroute monitoring is
- How a traceroute works
- What to configure for recurring traces
- How to read the results
- What a timeout means
- Limits of traceroute, and how to compensate
- A practical workflow for incident diagnosis
- Where Netverge fits
- Picking your first traces
- Escalating to a provider with evidence
- FAQ
- Sources
What traceroute monitoring is
A traceroute lists the routers, called hops, that packets cross between a source and a destination. Each hop shows the round-trip time (RTT) to that router. Traceroute monitoring takes the same measurement and repeats it: every minute, every five minutes, every hour, whatever the path deserves. Results are stored, graphed and compared.
The value comes from comparison. On its own, "hop 7 answers in 38 ms" means nothing. Next to last Tuesday's trace, which went through a different carrier and answered in 12 ms, it explains a complaint.
For a distributed environment, this matters in three places:
- Branch to headquarters or data center. Site-to-site tunnels and SD-WAN overlays hide the underlay. The trace shows which provider path the tunnel actually rides.
- Site to SaaS and cloud. Your users reach Microsoft 365, a payment gateway or a cloud region over paths you do not own. The trace is your only view into them.
- Client to client, for MSPs. Many customers hit the same upstream provider. Repeated traces show when several tenants share one degraded hop.
How a traceroute works
Traceroute exploits the time-to-live (TTL) field in every IP packet. Each router decrements the TTL by one. When it reaches zero, the router drops the packet and usually sends back an ICMP "Time Exceeded" message. Traceroute sends probes with TTL 1, then 2, then 3, and so on. Every Time Exceeded reply reveals one more hop and its RTT. When the probe reaches the destination, the trace ends.

The command is traceroute on Linux and macOS and tracert on Windows. Both map the hosts along a route using probes with increasing TTL values. They differ mainly in default probe type: Windows sends ICMP echo requests, while Linux traditionally sends UDP. Many tools, including the monitoring kind, let you choose ICMP, UDP or TCP and the port.
That choice matters in practice. A firewall that drops UDP high ports will make a UDP trace look broken, while a TCP trace to port 443 follows the same treatment your real application traffic gets.
What to configure for recurring traces
A monitored trace needs a handful of decisions. Getting them right is most of the work.
Targets
Pick targets that represent something a user or service depends on: the HQ firewall's public address, a cloud region endpoint, a SaaS hostname, a customer's primary application. Avoid tracing to random public DNS resolvers only because they are easy; they tell you about a path nobody uses.
Source locations
A path that is clean from your data center can be broken from a branch on a different ISP. Run traces from each site type you operate, ideally from a device that sits on the real user network segment. Edge probes help here because they measure from where the user is rather than from a central server. Netverge's Vergepoints are on-site hardware for that kind of visibility, and our guide to how to deploy network probes with checklists covers rollout without repeat site visits.
Protocol and port
Use the protocol that matches the traffic you care about. TCP to the application port is the closest to a real session. ICMP is the most widely understood and the most likely to be rate-limited. If you have doubts, run two protocols to the same target and compare.
Frequency
Match the interval to the decision it feeds. Business-critical paths, such as a primary WAN link or a payment endpoint, warrant traces every minute or so. Secondary paths can run every 15 to 60 minutes. Probing too often adds load and noise, and some providers rate-limit repeated probes.
Maximum hops
Thirty hops is the common default and covers nearly every internet path. Raise it only for unusual routes.
Alert thresholds
Alert on the things that matter to users, not on every hop:
- The destination is not reached.
- Average RTT at the final hop crosses a degraded or failed threshold.
- Packet loss at the final hop persists across several consecutive runs.
- The path changes, for example a new ASN or provider appears in the sequence, and the change coincides with a latency shift.
Alerting on middle-hop loss or latency is the most common way to create false alarms, for reasons covered next.
How to read the results
A traceroute table lists each hop with its address, loss and RTT statistics. Reading it takes one rule: judge the path by what happens from a hop onward, not by a single hop.
Latency

A hop with high latency that is followed by hops with normal latency is almost always a router that is slow to answer probes, not a slow path. Routers handle forwarding in hardware and generate Time Exceeded replies in a slower path, so they often deprioritize or rate-limit those replies. Netskope's traceroute analysis documentation makes the same point: a spike at one hop can come from ICMP deprioritization rather than congestion, while latency that carries through the following hops to the destination may point to a real problem.
A worked example:
| Hop | Address role | RTT | Reading |
|---|---|---|---|
| 1 | Branch gateway | 1 ms | Normal |
| 2 | ISP edge | 9 ms | Normal |
| 3 | ISP core | 85 ms | Looks bad, but hop 4 is fine |
| 4 | Transit peer | 14 ms | Normal |
| 5 | Destination | 18 ms | Normal |
Hop 3 is slow to reply, yet the traffic that continued through it reached the destination in 18 ms. No action is needed. Now change hop 4 to 82 ms and hop 5 to 88 ms. The delay is carried forward, so the trouble starts at or just before hop 3. That is a path problem, and the provider whose network contains that hop is where to escalate.
Packet loss
The same logic applies. Loss shown at one hop that disappears by the next hop is a reply-rate limit. Loss that begins at a hop and continues through the destination is real. For a deeper treatment of how to correlate loss across sites without drowning in alerts, see our article on correlated packet loss monitoring, and for what latency figures actually represent, what latency monitoring measures.
What a timeout means
Asterisks in a traceroute mean a hop did not answer within the wait period. That is not the same as an outage. Lumen's network troubleshooting documentation explains that a trace can show timeouts when ICMP messages are blocked even though connectivity between the hosts is unaffected.
Common causes of timeouts at a hop:
- A firewall or access list drops the probe or the reply.
- The router is configured not to generate Time Exceeded messages.
- The reply is rate-limited under load.
- Return traffic takes a different path that filters the reply.
The diagnostic question is whether the trace completes. If later hops respond and the destination is reached, the timeout at an earlier hop is cosmetic. If every hop after a certain point times out and the destination is never reached, you have a candidate failure, and the last responding hop is where to look first. Check whether the destination itself filters the probe type before you escalate; retry with TCP to an open port.
Limits of traceroute, and how to compensate
Traceroute is a sampling tool and it has known weaknesses. Lecture material from Carnegie Mellon's networking course on measurement strategies and pitfalls lists the main ones: ICMP messages may be filtered or rate-limited, probes may take different paths under load balancing, and traceroute cannot unambiguously identify one-way outages. Its advice is to cross-validate measurements with consistency checks and several overlapping measurements.
An APNIC Blog post, "PSA: Traceroute, safe and effective to use", adds a practical perspective. Traceroute suits validation and reconnaissance, but it should generally not be the basis for determining the root cause of a performance issue or for validating an SLA, unless the end-to-end path is part of the SLA.
For your operations, that translates into four habits:
- Treat the trace as a pointer. It tells you which provider or segment to examine, not the verdict.
- Pair it with end-to-end measurements. Latency and loss to the destination, measured continuously, confirm whether users are affected at all.
- Expect multiple paths. Equal-cost load balancing can send consecutive probes down different routes, producing a hop list that mixes two paths. Repeated runs and consistent source and destination ports reduce this.
- Add routing context. If the path changed, the cause may be a routing event. Our piece on BGP monitoring with BMP streaming shows how to see route changes and hijacks as they happen, which explains why a trace suddenly crosses a new network.
A practical workflow for incident diagnosis
Here is a repeatable routine for a distributed network, from alert to resolution.
- Start from the symptom, not the trace. Something users feel triggers it: a latency alert, a loss alert, a ticket from a site. Confirm scope. One site, several sites on one provider, or one application everywhere?
- Pull the recent path history. Compare the current trace with the baseline from a healthy day. Note any new hops, new providers or changed hop counts.
- Find where degradation begins and persists. Use the rule above: the first hop after which latency or loss stays elevated through the destination. Ignore isolated middle-hop spikes and timeouts.
- Cross-check. Compare against the end-to-end latency and loss series, and against tunnel or VPN health if an overlay is involved. Our site-to-site VPN monitoring guide covers separating tunnel faults from underlay faults.
- Scope the blast radius. Check whether other sites or tenants traverse the same hop or provider. A shared hop turns many tickets into one incident.
- Decide the action. Options include opening a provider ticket with the trace evidence attached, failing over to a secondary link, or changing a route preference.
- Get approval for changes. Failover and routing changes affect production traffic. A named person should approve them, with the evidence in front of them and a rollback plan written down.
- Record the outcome. Attach the traces, the cause and the fix to the ticket and to the site's documentation so the next occurrence takes minutes.
Where automation helps, and where it stops
Steps 1 to 3, 5 and 8 are good candidates for automation: collecting traces when a threshold trips, comparing against baseline, listing affected sites and drafting the ticket. These are read-only tasks that save time and carry little risk. Steps 6 and 7 involve changing the live network. Keep a human approval gate there, define which actions an automated agent may take on its own (usually none that change production) and log every automated action. Automation should shorten the path to a decision, not remove the decision.
Where Netverge fits
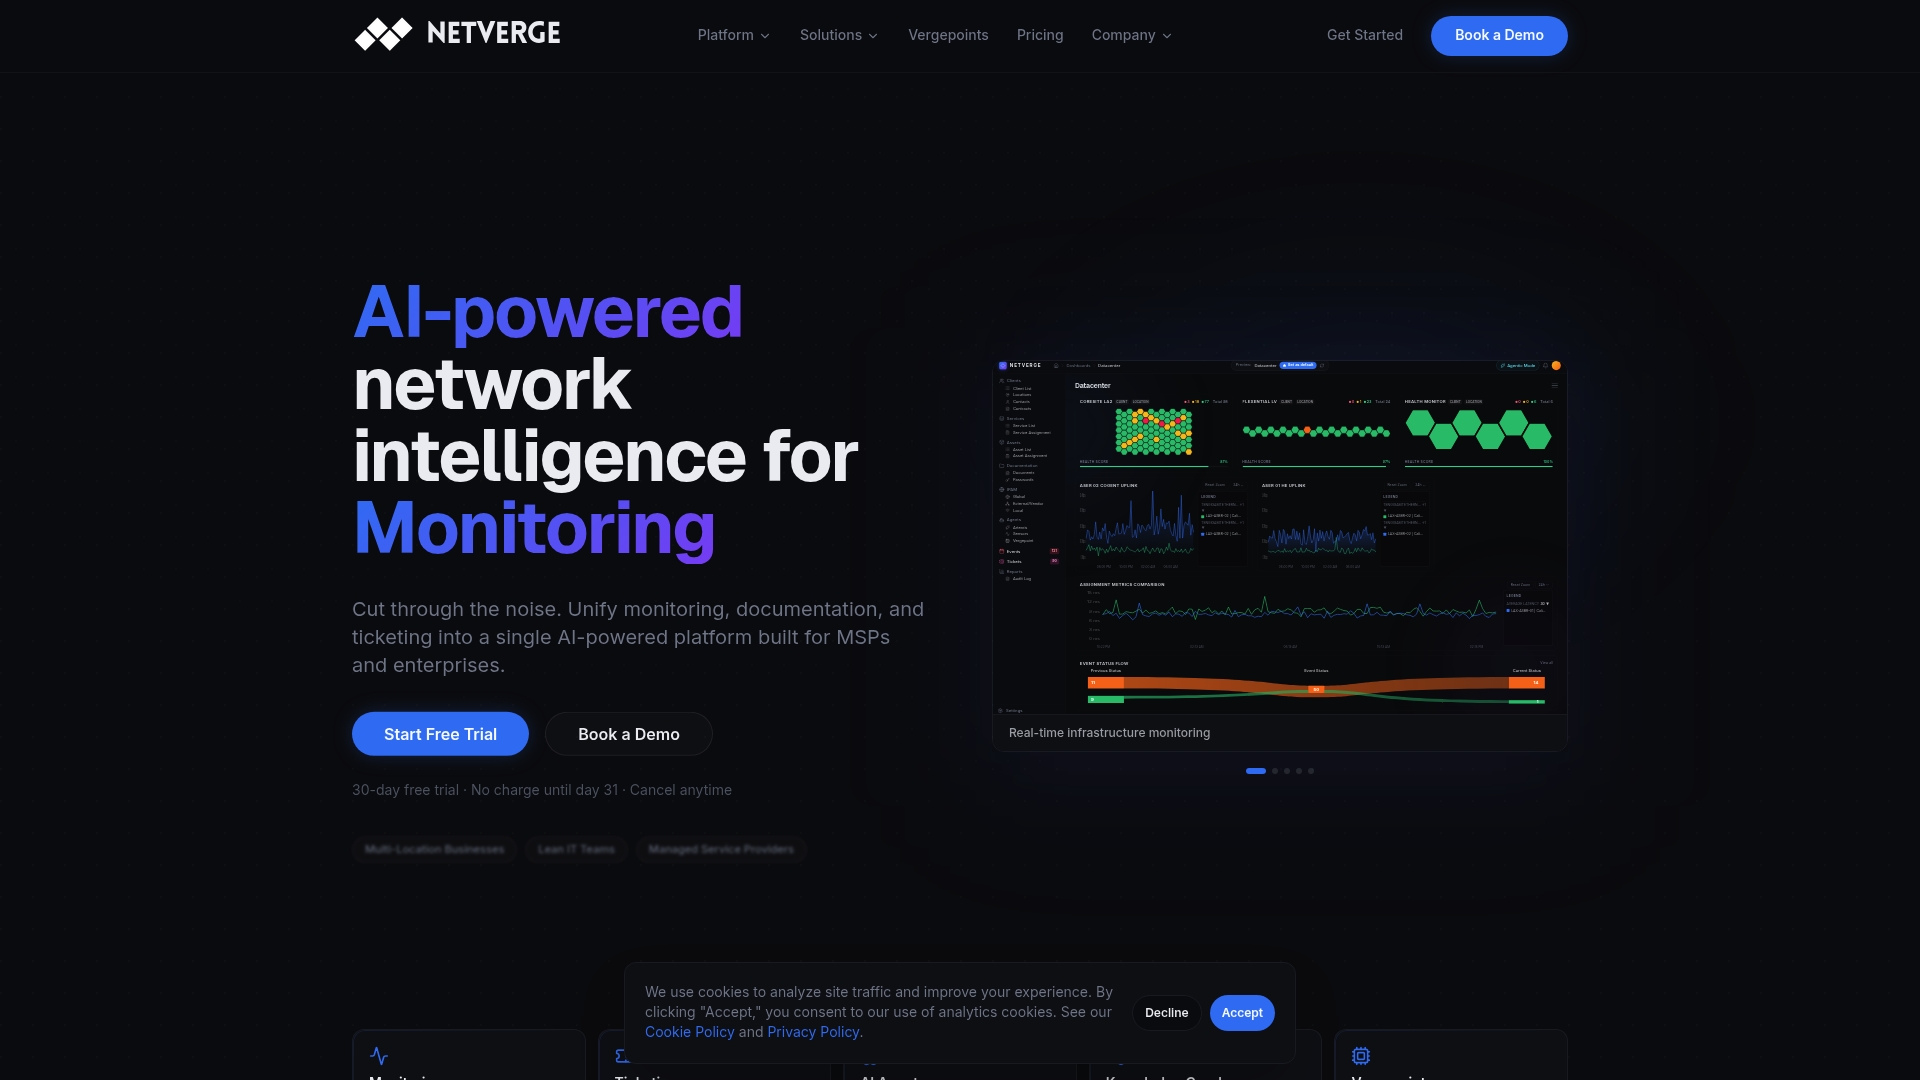
Traceroute monitoring is one signal among several, and most teams lose time when that signal lives in one tool, the tickets in another and the network documentation in a third. Netverge unifies network monitoring, documentation, ticketing and automation in one AI-powered platform. It offers real-time infrastructure monitoring, anomaly detection, a knowledge graph, AI-powered ticket triage and autonomous AI agents that diagnose issues, with multi-tenant management and role-based access for MSPs and multi-site teams. Its Vergepoint hardware provides on-site visibility at each location. See the AI network monitoring platform for the details.
Pricing is published. The Starter Package is $299 per month. Hardware Vergepoints are $49 per month per device and Software Vergepoints are $29 per month per Vergepoint. Capacity add-ons are $100 per month each for 100 additional sensors, 100 additional clients, 100 additional sites, 10 additional AI agents or 500GB of storage. Use the pricing calculator to estimate a deployment, or see the pricing guide for every line item.
If you manage many sites or many clients, start with the Netverge monitoring overview and map it to the sites where path problems cost you the most tickets.
Picking your first traces
Do not trace everything at once. A sensible rollout for a distributed network:
- Week one: one trace per site to the primary data center or cloud region, from the on-site probe, over TCP to a real service port.
- Week two: add the top three SaaS or customer-facing applications per site type.
- Week three: add a second protocol on your most critical path to see whether ICMP behaves differently from TCP.
- Ongoing: review which alerts led to action, tighten thresholds on final-hop metrics, and drop alerts on middle hops that never mattered.
Once a baseline exists, path changes become informative. You will see seasonal behavior, provider maintenance patterns and the difference between a path that flaps and one that is merely long. For wider infrastructure context, our guide on network infrastructure monitoring strategies and the one on 90-day path visibility for hybrid cloud show how to keep that history useful across environments.
Escalating to a provider with evidence
Carriers respond to specifics. A good escalation includes:
- Source and destination addresses and the protocol used.
- Two traces: one from the healthy baseline and one from the incident, with timestamps and time zone.
- The hop where degradation starts and the evidence it persists to the destination.
- The end-to-end latency or loss graph showing when users were affected.
- Whether other sites or tenants crossing the same hop show the same symptoms.
This package avoids the first reply a provider usually sends, which is a request to prove the problem. Because the trace history is already stored, you can assemble it in minutes rather than reproducing the fault later.
FAQ
Is traceroute the same as tracert?
They do the same job under different names. Traceroute is the Linux and macOS command and tracert is the Windows one. Both send probes with increasing TTL values to map the hosts along a route. Defaults differ: Windows uses ICMP echo, Linux typically UDP, so the same target can give slightly different results.
What does it mean when a traceroute times out?
The hop did not answer the probe in time. Firewalls, router settings that suppress ICMP replies and rate limiting can all cause it, and connectivity may be unaffected. It is only a concern if the trace never reaches the destination or every hop after a point stays silent. Retry with TCP to an open port before escalating.
How often should I run monitored traceroutes?
Match frequency to the importance of the path. Run critical paths about every minute and secondary paths every 15 to 60 minutes. More frequent probing adds load and may trigger rate limits, without improving decisions.
Can traceroute prove the root cause of slow performance?
It can point to where to look, but it should not stand alone. Routers may rate-limit replies and load balancing may split probes across paths. Confirm with end-to-end latency and loss data and routing information, then act on the combined evidence.
Sources
- Traceroute Analysis, Netskope Technical Documentation
- Timeouts and unreachables in traceroute, Lumen
- Measurement Strategies and Pitfalls, Carnegie Mellon University lecture notes, 2007
- PSA: Traceroute, safe and effective to use, APNIC Blog, 2025