How to Reduce Monitoring False Positives Without Missing Real Incidents
Published
- reduce monitoring false positives
- reduce false positives

To reduce monitoring false positives, measure which alerts waste the most time, fix their thresholds and evaluation windows, add dependency and maintenance context, and review every change on a schedule. Do not mute alerts to get quiet. Quiet that comes from suppression hides real incidents. Quiet that comes from better signal does not.
This guide is for MSPs, multi-site IT teams and NOC staff who get paged for things that turn out to be nothing. It walks through a repeatable process you can run this month.
TL;DR
- A false positive is an alert that flags benign activity as a problem. A false negative is a real problem that raises no alert. Reduce the first without creating the second.
- Rank alerts by count, investigation time and the share that were real. Fix the loud, low-value ones first.
- Most noise comes from thresholds set too tight, evaluation windows set too short, stale telemetry and missing dependency context.
- Correlation, deduplication, dependency suppression and maintenance windows cut volume without cutting coverage.
- Test every rule change in a review loop across sites, and keep a rollback path.
Table of Contents
- What a false positive means in network monitoring
- Why monitoring systems raise false alerts
- Step 1: Measure the noise before you touch a rule
- Step 2: Tune thresholds, durations and baselines
- Step 3: Add context so alerts understand the network
- Step 4: Protect detection while you cut noise
- Step 5: Review changes across multiple sites
- Where AI helps, and where rules still matter
- Reduce alert noise with Netverge
- A 30-day plan
- FAQ
- Sources
What a false positive means in network monitoring
NIST defines a false positive as an alert that incorrectly indicates a problem is present, and in its malware guidance as a tool classifying benign content as malicious. In network operations the same idea applies to a ping check that fails once, a bandwidth alert during a nightly backup, or a "device down" page for a switch that was rebooted on purpose.
The opposite error matters more. Microsoft's endpoint documentation describes a false negative as a malicious entity the solution does not detect. OWASP calls false negatives the most serious state, because nobody knows an attack happened, while false positives can be adjudicated with enough effort.
That asymmetry sets the rule for the whole article. Every change you make to cut false positives must be checked against what it could hide.
| Term | What happens | Operational cost |
|---|---|---|
| True positive | Alert fires, problem is real | Work worth doing |
| False positive | Alert fires, nothing is wrong | Wasted triage time, alert fatigue |
| False negative | No alert, problem is real | Outage or breach found late |
| True negative | No alert, nothing wrong | None |
Why monitoring systems raise false alerts
Before tuning, know the usual causes. ONES lists sensitive thresholds, short evaluation windows, wrong aggregation, missing filters and stale telemetry, and notes that one failure can produce many notifications when alerts do not understand dependencies.
In multi-site networks, these show up in recognizable ways:
- Static thresholds on variable metrics. A WAN link at 85% utilization is normal at a branch that runs video calls all day and abnormal at one that does not.
- Single-sample triggers. One lost ICMP packet pages someone.
- Upstream failure, downstream storm. A core switch fails and every device behind it alerts separately.
- Planned work. Firmware updates, reboots and ISP maintenance fire alerts nobody needed.
- Duplicate coverage. Two tools, or two checks in one tool, report the same condition.
- Stale or incomplete data. An asset inventory that is out of date produces alerts about devices that no longer exist or are mislabeled.
- Flapping links. A marginal circuit goes up and down, producing an alert on each transition. Here the alert is correct but the notification pattern is not useful. Treat it as a separate problem from a false positive.
These causes need different fixes. Treating all of them as "too many alerts" leads to blanket suppression, which is how false negatives begin.
Step 1: Measure the noise before you touch a rule
You cannot tune what you have not measured. Pull the last 90 days of closed alerts and record, per alert rule: name, source, count, total time spent investigating, median investigation time, and the percentage that were real. Prophet Security suggests plotting count against efficacy so the high-volume, low-efficacy rules stand out as the best tuning candidates.
If you want a rate, use the standard formula. Check Point defines the false positive rate as false positives divided by the sum of false positives and true negatives. In day-to-day operations, most teams find a simpler number more useful: the share of pages that required no action, per rule.
A worked example for a ten-site MSP client:
| Alert rule | Alerts (90 days) | Real | Median triage | Verdict |
|---|---|---|---|---|
| Branch WAN latency > 100 ms | 412 | 9% | 6 min | Tune first |
| Device unreachable (ICMP) | 268 | 31% | 9 min | Add duration and dependency |
| Core switch port down | 41 | 88% | 12 min | Leave alone |
| Disk > 80% on file server | 95 | 15% | 4 min | Use a trend-based rule |
The figures are illustrative, not benchmarks. The point is the method: the first two rules cost the most hours and carry the lowest value, so they get attention before the rule that is usually right.
Tag every closed alert with a disposition: real issue, benign, duplicate, planned work or bad data. Without dispositions, you cannot tell which fix applies. Our guide to a monthly alert review covers a lightweight cadence for this.

Step 2: Tune thresholds, durations and baselines
Start with the cheapest changes.
Require the condition to persist
A single bad sample is rarely an incident. Most monitoring tools let you require a condition to hold for a set time before firing. In Prometheus-style rules this is the for clause. Without it, one anomalous data point can trigger a page. One practitioner write-up found that three consecutive one-minute evaluations was the shortest duration that suppressed transient spikes in their setup without masking real incidents. Treat that as a starting point for your own testing, not a universal value. A core router needs a shorter window than a branch printer.
Set thresholds per site and per role
One global threshold guarantees noise somewhere. Group devices by role and site profile, then set thresholds from observed behavior. A baseline built from two to four weeks of normal traffic, including weekly cycles, beats a number picked from a vendor datasheet.
Tune the score, not just the sensitivity
If you use anomaly detection, lowering sensitivity across the board is the blunt option. It reduces false positives and false negatives alike. A better approach is to calibrate how anomaly scores map to severity, so low-confidence anomalies become low-priority tickets and only high-confidence ones page someone. We cover this in anomaly detection tuning.
Know the trade-off in detection methods
OWASP notes that signature-based intrusion detection tends to produce fewer false positives and is easier to adjudicate, while behavioral detection produces many more false positives but can identify novel attacks such as zero-day exploits. The practical lesson is to keep both and route them differently: signature hits can page, behavioral hits can open a ticket for review.
Step 3: Add context so alerts understand the network
Tuning numbers only goes so far. The largest reductions usually come from giving alerts context about what depends on what, and what is supposed to be happening.
Correlation and deduplication
Deduplication combines identical alerts into one notification, so a check that fails every minute for an hour yields one alert with a count instead of sixty. Grouping goes a step further. The Prometheus Alertmanager documentation describes grouping similar alerts into a single notification, so an operator gets one page while still seeing which instances were affected.
Correlation links alerts that share a cause, even when they come from different tools or different layers. A WAN circuit drop, a VPN tunnel down event and forty unreachable hosts are one incident. Our event correlation plan breaks this into six stages.

Dependency-aware suppression
When an upstream device is down, downstream alerts add nothing. The same Alertmanager documentation describes inhibition, which suppresses notifications for certain alerts when other alerts are already firing, for example when an entire cluster is unreachable. This only works if you know the dependencies. A current map of which devices, links and services depend on which is the foundation. See our service dependency mapping guide.
Maintenance windows
Planned work should not page anyone. Schedule suppression for the specific devices and the specific time of the change, not for a whole site or a whole night. Tie windows to change tickets where you can, so a window closes when the work does. A device that is still down after the window ends should alert immediately.
Asset and site context
An alert that says "switch unreachable" is less useful than one that says which site, which role, which client and which services sit behind it. Context makes it faster to dismiss a benign alert and faster to confirm a real one. It also lets you set severity by business impact instead of by metric alone.
Validate impact before escalating
Not every alert is an incident. Separate the two with a short validation step: is a user, service or site affected? Our piece on alert vs. incident describes how IT and security teams do this.
Step 4: Protect detection while you cut noise
This is where teams get hurt. A few safeguards keep tuning honest.
- Change one thing at a time. If you alter five rules and an outage slips through, you will not know which change caused it.
- Run shadow mode first. Let the new rule evaluate alongside the old one for one to two weeks. Compare what each would have fired. Any real incident the new rule would have missed is a reason to adjust.
- Replay history. Check the new rule against past real incidents. If it would not have caught them, it is not ready.
- Downgrade before you delete. Move a noisy rule from page to ticket or dashboard. You keep the signal and lose the interruption.
- Keep a rollback. Record the old threshold and the date. Revert quickly if a miss appears.
- Reserve the top severity. An alert marked critical should represent a credible, time-sensitive risk. If critical labels routinely describe low-impact activity, responders stop trusting them.
- Add a canary. Keep at least one synthetic or known-bad test that proves the alert path still works end to end.
For teams that care about the other side of the ledger, reducing detection time should be tracked alongside alert volume. If volume falls and time to detect rises, you have cut too deep.
Step 5: Review changes across multiple sites
Multi-site and multi-client environments add a risk: a rule that is right for one site is wrong for another. A safe process looks like this.
- Pilot at two or three representative sites. Pick a large site, a small site and one with a known quirk, such as a satellite or LTE backup link.
- Compare outcomes by site profile. Look at pages fired, pages actioned and incidents found by other means.
- Roll out in stages. Move to the next group of sites only after a clean review period.
- Keep site-level overrides documented. Exceptions without notes become tomorrow's mystery.
- Hold a monthly review. Re-run the Step 1 measurement. Rules drift as networks change.
- Feed back from closed tickets. Technicians who close an alert as benign should be able to flag the rule in one click.
Site-to-site tunnels are a good example of where context matters. A brief tunnel renegotiation is not an outage. Our guide to VPN monitoring with SNMP shows how to stop false alarms on those checks.
Where AI helps, and where rules still matter
AI-assisted monitoring can help with three of the jobs above: clustering related alerts into one incident, learning per-device baselines, and triaging tickets so likely-benign ones are handled differently from likely-real ones. It works best when it has good inputs: accurate inventory, dependency data and reliable telemetry. Poor data produces poor correlation, whatever the model.
Keep explicit rules for the things that must never be missed: a core link down, a critical service unreachable, a security-relevant change. Use learned behavior to reduce noise around them, not to replace them. For examples of what well-scoped detection finds, see these network anomaly detection examples.
Our perspective
We built Netverge because most false positives are not a threshold problem. They are a context problem. A tool that sees one metric on one device cannot know the switch was rebooted on purpose, or that forty alerts share one failed uplink.
That is why we put monitoring, documentation, ticketing and automation in a single platform. When the knowledge graph links a device to its site, its dependencies and its open tickets, an alert can be judged in context before it reaches a person. Our AI agents are designed to diagnose and triage issues so engineers see fewer pages that need no action.
Our Vergepoints add on-site visibility, so a link that looks down from the cloud can be checked from inside the site. Fewer blind spots mean fewer guesses, and fewer guesses mean fewer false alarms.
Jim
Reduce alert noise with Netverge
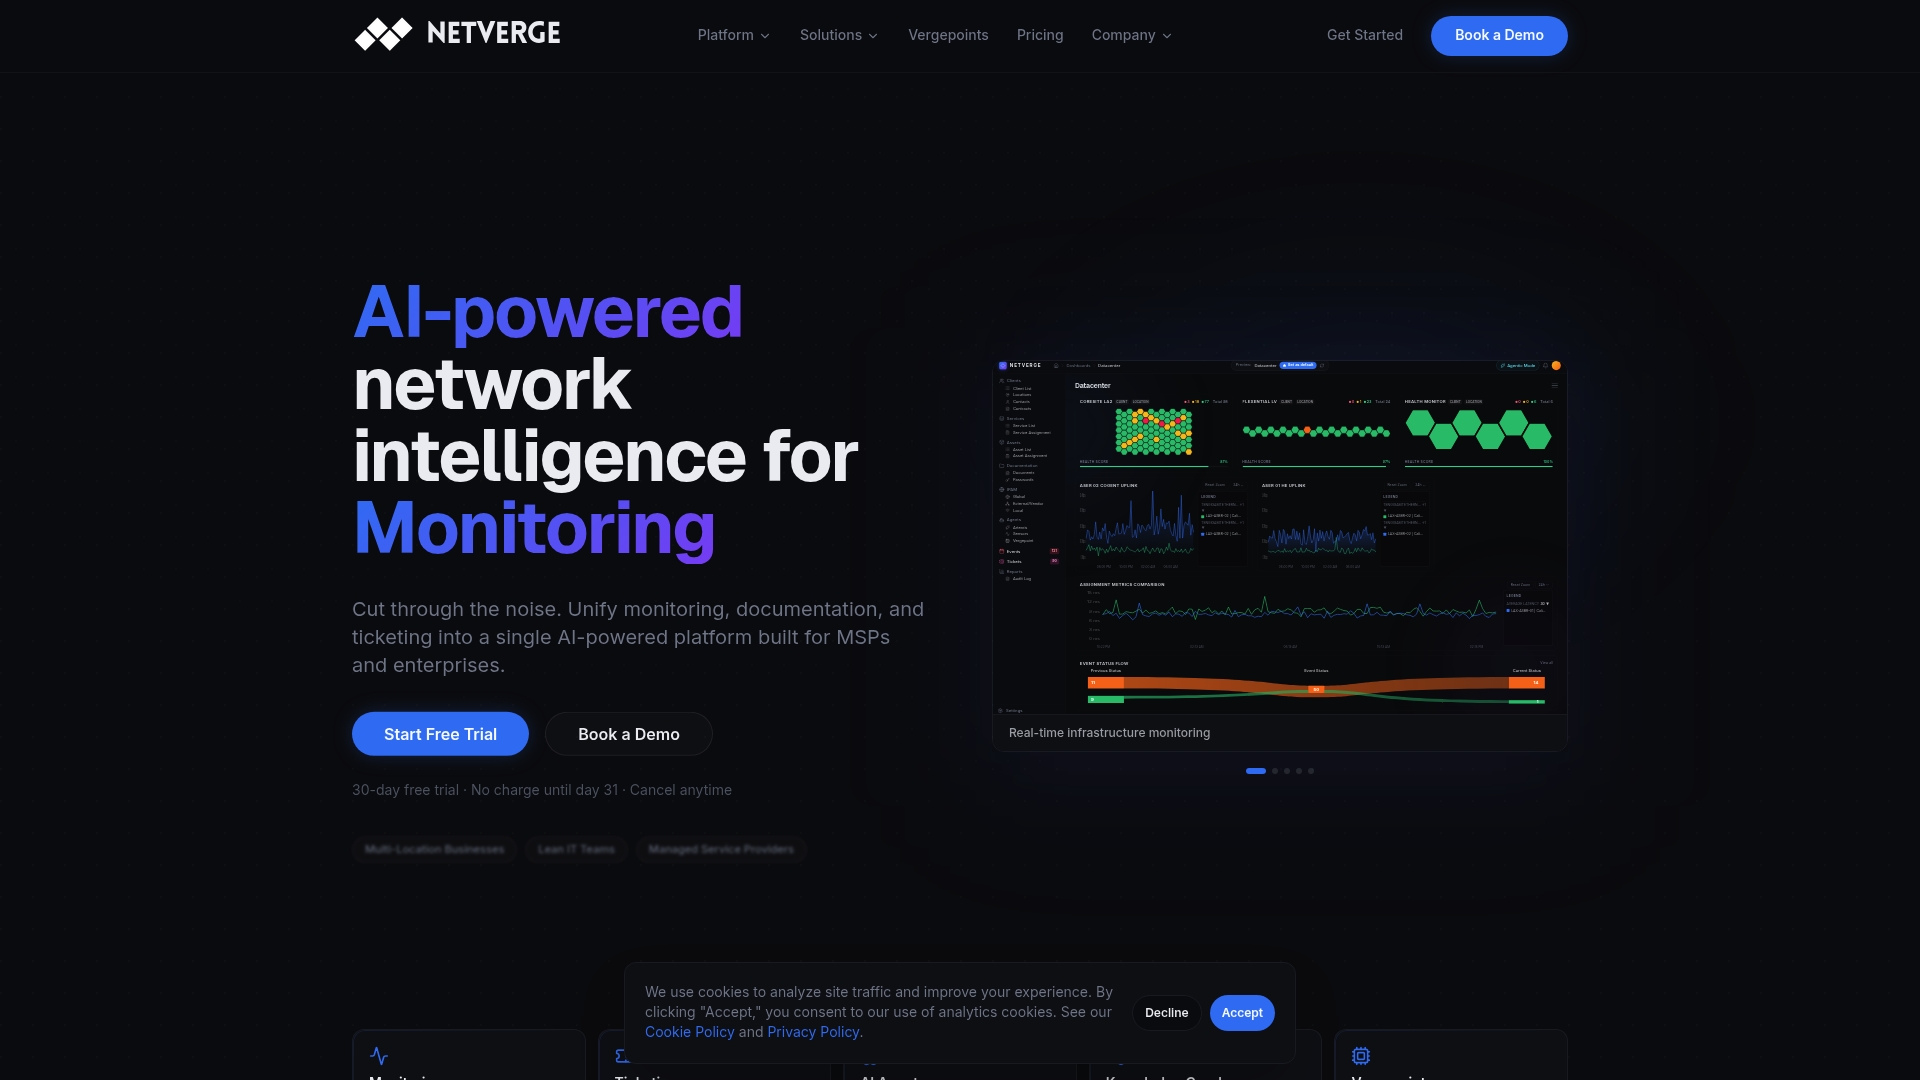
Netverge is built for MSPs and multi-location teams that want monitoring, documentation, ticketing and AI-powered automation in one place, with multi-tenant management and role-based access. You can see how it handles alerting on the AI network monitoring page, or read about Vergepoints, the plug-and-play hardware for on-site visibility.
The Starter Package is 299 USD per month. Hardware Vergepoints are 49 USD per month per device, and a Software Vergepoint is 29 USD per month. Extra sensors, clients, sites, AI agents and storage are listed on the pricing guide, and the pricing calculator estimates your monthly cost. When you are ready, start your free trial or request a demo.
A 30-day plan
| Week | Action | Output |
|---|---|---|
| 1 | Export 90 days of alerts, tag dispositions | Ranked list of noisy rules |
| 2 | Add durations, per-role thresholds and deduplication to the top five rules | Shadow-mode comparison |
| 3 | Map dependencies, add suppression and maintenance windows | Fewer cascade alerts |
| 4 | Pilot at representative sites, review, roll out in stages | Documented changes and rollback notes |
Repeat the cycle each month. Teams that treat tuning as routine work, not a one-time cleanup, keep the noise down as the network grows.
FAQ
What is the most common cause of false positives in network monitoring?
Overly sensitive static thresholds combined with short evaluation windows are the most frequent causes. A single bad sample or a normal traffic peak crosses a fixed line and fires. Stale telemetry and missing dependency context add to it. Measure your own alerts to see which cause dominates in your environment.
How do I reduce false positives without missing real incidents?
Change one rule at a time, run the new logic in shadow mode, and replay past incidents against it. Downgrade noisy alerts from page to ticket before deleting them. Keep the top severity for credible, time-sensitive risk, and keep a rollback for every change.
How do I calculate a false positive rate?
Divide false positives by the sum of false positives and true negatives. In practice, many operations teams track a simpler metric per rule: the percentage of alerts closed as benign over a 90-day period. Either way, you need a disposition recorded on every closed alert.
Do maintenance windows create blind spots?
They can if they are too broad. Scope each window to the specific devices and the specific change, tie it to a change ticket, and make sure it ends when the work ends. A device still down after the window closes should alert at once.
Sources
- False Positive - Glossary, NIST CSRC
- Address false positives/negatives in Microsoft Defender for Endpoint
- Intrusion Detection, OWASP Foundation
- Why Is Infrastructure Monitoring Showing False Alerts?
- Alert Tuning Best Practices for Security Operations
- What is a False Positive Rate in Cybersecurity?
- AI Anomaly Detection in Grafana: 3 Mistakes We Made
- Alertmanager, Prometheus documentation