
Service dependency mapping is the practice of discovering, recording, and visualizing every relationship between services, infrastructure components, and data flows in your environment so you can answer operational questions in seconds rather than hours. The single most important action you can take: implement continuous, multi-source mapping and use it for blast-radius checks before every significant change. Netverge provides integrated visibility, knowledge graphs, and proof-of-concept support to get your team there quickly.
Here is what this guide covers:
- What service dependency mapping is and why modern IT teams need it
- Core map types and when to use each
- Discovery techniques, data sources, and confidence scoring
- A procurement checklist and POC success metrics
- A phased implementation plan with roles and cost drivers
- Operational use cases, best practices, and a concrete walkthrough
- How Netverge implements these capabilities in practice
Key Takeaways
Continuous, multi-source dependency mapping with confidence scoring and ownership metadata is the most reliable way to reduce investigation time, prevent blast-radius surprises, and keep topology data accurate in fast-moving environments.
| Point | Details |
|---|---|
| Start with a critical-domain pilot | Scope your first map to 10–20 critical services; validate coverage before expanding. |
| Use multi-source discovery | Combine traces, network flows, and CMDB data; single-source maps have significant blind spots. |
| Score edge confidence | Mark edges as "potential" until confirmed by runtime evidence to keep operator noise low. |
| Measure POC KPIs explicitly | Track freshness, coverage percentage, false-positive rate, and time-to-root-cause from day one. |
| Netverge for integrated visibility | Netverge's knowledge graphs, 28+ sensors, and Vergepoints hardware provide topology coverage across software and physical-site layers. |
Table of Contents
- What Service Dependency Mapping Covers and Why IT Teams Need It
- What Types of Dependency Maps Should You Build?
- How Dependency Mapping Works: Techniques and Data Sources
- What to Evaluate in a Dependency-Mapping Tool
- Steps to Implement Dependency Mapping: Project Plan, Timeline, and Cost Drivers
- Primary Use Cases and How to Apply Dependency Maps in Your Workflows
- Best Practices and Common Pitfalls in Dependency Mapping
- A Concrete Walkthrough: Build and Use a Dependency Map for a Web App
- How Netverge Implements Service Dependency Mapping in Practice
- What to Prioritize First When Adopting Dependency Mapping
- Netverge Gives You a Topology-Aware Starting Point, Not a Blank Canvas
- Sources
What Service Dependency Mapping Covers and Why IT Teams Need It
Dependency mapping builds a living inventory and an interactive graph that lets your team answer operational questions faster and reduces investigation time during incidents. That is the core value proposition, and it holds across environments from a single data center to a distributed multi-cloud estate.
In practice, a dependency map is three things at once: a real-time inventory of services and infrastructure, a visual graph of how those components connect and communicate, and a source of truth that replaces scattered Confluence pages, stale Visio diagrams, and tribal knowledge. It covers application-to-application calls, network-layer connections, database dependencies, third-party API integrations, and cloud-managed service relationships.
The operational benefits are concrete:
- Faster MTTR: When an alert fires, engineers navigate directly to the affected service's upstream and downstream nodes instead of manually tracing connections across multiple tools.
- Safer change management: Pre-deployment blast-radius checks surface every service that a proposed change could affect, reducing the chance of unplanned outages.
- Risk and compliance visibility: Security teams can trace how a compromised service propagates risk through the graph, and compliance teams can verify data-flow boundaries.
- Capacity planning: Hotspots and bottlenecks become visible at the topology level, not just at the individual host level.
The operational payoff is direct: PagerDuty's mapping workflow shows that teams using structured dependency maps speed root-cause analysis during incidents by navigating relationships rather than reconstructing them under pressure.
A concrete example: without a map, a database latency spike triggers a cascade of alerts across five dependent microservices, and an engineer spends 40 minutes tracing which services call that database. With a map, the same engineer opens the database node, sees all upstream callers in one view, and begins targeted remediation in under three minutes. That difference compounds across every incident your team handles.
What Types of Dependency Maps Should You Build?
Not every map serves every purpose. Using the wrong map type for a given task adds noise and slows decisions. The five core types each have a distinct operational role.
- Network-flow maps capture Layer 3/4 traffic between hosts and services using eBPF, NetFlow, or packet capture. Use these for incident triage when you need to confirm whether two components are actually communicating, and for network segmentation audits.
- Application/IPC maps show service-to-service calls at the application layer, typically derived from service mesh telemetry or application metrics. Use these for architecture reviews and identifying tight coupling between services.
- Trace/request maps are built from distributed tracing data (OpenTelemetry, Jaeger, Zipkin) and show the exact path a request takes through your system, including latency at each hop. Use these for performance investigations and SLO breach analysis.
- Static/config maps are derived from Infrastructure as Code (Terraform, CloudFormation), CI/CD pipeline definitions, and CMDB records. Use these for migration planning and compliance documentation where you need a point-in-time snapshot.
- Business-service maps aggregate lower-level technical dependencies under a business-service label (e.g., "Payments" or "Customer Portal"). Use these for executive reporting, SLA management, and change advisory board (CAB) reviews.
Netflix engineers emphasize that network connectivity alone is insufficient. You must overlay health status, ownership metadata, and business domain context onto connections to make maps usable for operations. A node showing a service name with no owner, no environment tag, and no health indicator is nearly as unhelpful as no map at all.
On naming: keep environment metadata as a separate attribute (e.g., env: production) rather than embedding it in the service name (payments-prod). Embedding environment in the name fragments your logical service identity across lifecycle stages and makes cross-environment queries unnecessarily complex.
How Dependency Mapping Works: Techniques and Data Sources
Accurate maps require multiple data sources. No single signal gives you complete coverage, and each source has trade-offs in freshness, accuracy, and deployment cost.

| Data Source | Coverage | Strengths | Weaknesses |
|---|---|---|---|
| Distributed traces (OTel/Jaeger) | Application call graph | High fidelity, latency data, request context | Requires instrumentation; misses non-traced paths |
| Network flows (eBPF/NetFlow) | Layer 3/4 connections | Agentless options; broad coverage | No application context; noisy at scale |
| IPC/service mesh metrics | Service-to-service calls | Low overhead; sidecar-based | Mesh adoption required |
| Static analysis (IaC/CI/CD) | Config-declared dependencies | Stable; good for compliance | Stale if infra drifts from code |
| DNS query logs | Service discovery patterns | Lightweight; widely available | Indirect; misses direct IP calls |
| CMDB/asset inventory | Ownership, hardware, CI records | Authoritative for ownership | Often stale without active sync |
Netflix's production design uses three independent topology graphs (network flows, IPC metrics, and distributed traces) and merges them at query time to produce a real-time, queryable service topology. Storing each layer separately keeps each graph scalable while enabling unified traversal with sub-second response times.
Agent vs. agentless discovery is a real trade-off. Agents (eBPF probes, OpenTelemetry SDKs, sidecar proxies) deliver richer application-layer context and lower false-positive rates. Agentless approaches (NetFlow collectors, passive DNS, SNMP) reduce deployment friction but miss application-layer semantics. Most production environments use both: agentless for broad initial coverage, agents for critical service paths where accuracy matters most.
Confidence scoring prevents false positives from polluting your graph. Mark edges as "potential" when they come from static analysis or DNS alone, and promote them to "confirmed" only after runtime evidence (a trace or a network flow) corroborates the relationship. This approach, documented in OneUptime's dependency mapping guide, keeps operator noise low and prevents engineers from chasing phantom dependencies during incidents.
Pro Tip: Set a minimum confidence threshold (e.g., "confirmed by at least two independent sources") before displaying an edge in your operational view. Keep potential edges in a separate layer for architecture review, not incident triage.
What to Evaluate in a Dependency-Mapping Tool
Procurement decisions for dependency-mapping tools often stall because teams lack a structured checklist. Use the criteria below to score candidates and define your POC success metrics before you start a trial.
Capability checklist:
- Real-time discovery with configurable refresh intervals (target: sub-5-minute staleness for critical services)
- Multi-source ingestion: traces, network flows, CMDB, IaC, service mesh
- Distributed trace integration (OpenTelemetry, Jaeger, or vendor-native APM)
- CMDB bidirectional sync (ServiceNow, Jira Service Management, or equivalent)
- Visual graph with filters by environment, owner, domain, and health status
- Ownership and metadata fields: team, tier, SLO, on-call rotation
- Time-travel / historical topology view for post-incident review
- API access for programmatic queries and CI/CD pipeline integration
- Scalability: tested node/edge counts relevant to your environment size
Suggested scoring weights for evaluation:
POC success metrics to measure during a trial:
- Freshness: average time between a topology change and map update
- Coverage: percentage of your pre-defined critical services appearing in the map
- False-positive rate: percentage of displayed edges that do not reflect actual runtime communication
- Time-to-root-cause: compare incident investigation time before and after map availability
Pro Tip: Define your critical-service list before starting a POC. Without a baseline, you cannot measure coverage or compare investigation times objectively.
Steps to Implement Dependency Mapping: Project Plan, Timeline, and Cost Drivers
A phased rollout reduces risk and builds organizational confidence before you commit to full-scale deployment.
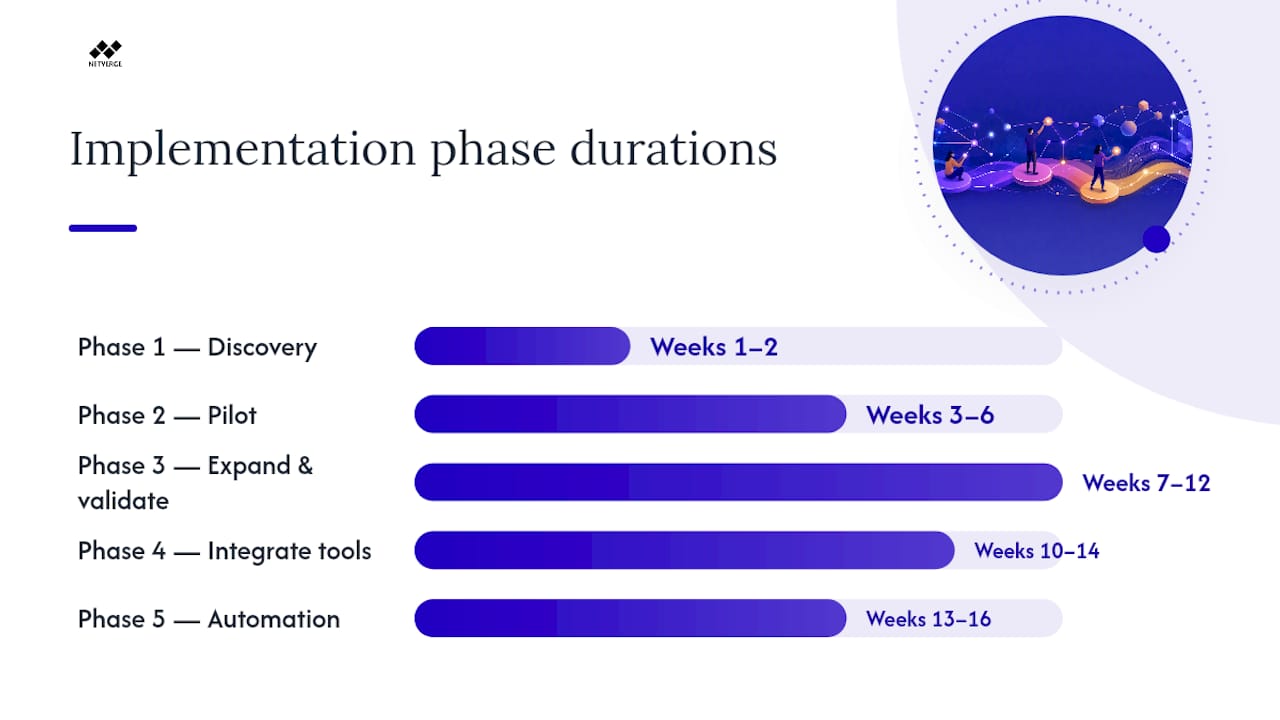
- Phase 1: Discovery and inventory (weeks 1–2). Audit existing telemetry sources (APM agents, NetFlow collectors, CMDB records). Identify your 10–20 most critical services. Assign a platform engineer or SRE as the mapping lead.
- Phase 2: Pilot (weeks 3–6). Instrument one business domain (e.g., the payments service and its direct dependencies). Enable trace collection and network-flow ingestion for that domain. Validate coverage against your critical-service list and measure false-positive rate.
- Phase 3: Expand and validate (weeks 7–12). Extend instrumentation to additional domains. Reconcile CMDB records with runtime-discovered topology. Resolve naming inconsistencies and assign ownership metadata to all nodes.
- Phase 4: Integrate with incident and workflow tools (weeks 10–14). Connect the map to your alerting platform (PagerDuty, Opsgenie, or equivalent) and your ticketing system. Configure map-context injection into incident tickets so on-call engineers see topology automatically.
- Phase 5: Automation and guardrails (weeks 13–16). Automate topology refresh. Set staleness alerts. Integrate blast-radius queries into your CI/CD pipeline as a pre-deployment gate. Establish a governance cadence for ownership review.
Roles and responsibilities:
- Platform engineer / SRE: Owns instrumentation, graph storage, and API integrations
- Infrastructure ops: Manages network-flow collectors and CMDB sync
- Service owners: Maintain ownership metadata and validate their service's edges
- Security team: Reviews transitive risk paths and validates compliance boundaries
- Compliance / audit: Confirms data-flow documentation meets regulatory requirements
- Product managers: Define business-service groupings and SLO tiers
Primary cost drivers:
- Telemetry ingestion volume (traces and flows at scale drive storage and processing costs)
- Agent deployment effort across heterogeneous environments
- Storage and retention for historical topology (time-travel queries require longer retention)
- Visualization platform licensing
- Professional services for CMDB integration and initial instrumentation
If those thresholds are not met, extend the pilot before expanding.
Primary Use Cases and How to Apply Dependency Maps in Your Workflows
Maps are only valuable when they are embedded in operational workflows, not when they live in a separate portal that engineers open once a quarter.
Incident triage playbook:
- Alert fires on Service A. Open the map, navigate to Service A's node.
- Check upstream callers: which services depend on A? Notify their owners immediately.
- Check downstream dependencies: which services does A call? Identify whether the fault is in A or in a dependency.
- Use the time-travel view to compare current topology against the topology at the last known-good state.
- Attach the map snapshot to the incident ticket for post-mortem review.
Blast-radius analysis checklist:
- Identify the service or infrastructure component being changed.
- Query all direct and transitive downstream dependents (depth 2–3 hops is usually sufficient for most environments).
- Flag any dependents with a Tier 1 or SLO-critical designation.
- Notify the on-call engineers for each flagged dependent at least 24 hours before the change window.
- Confirm with each owner that they have a rollback plan or can absorb the change window.
Pre-deployment impact assessment:
- Run a blast-radius query against the component being deployed.
- Compare the current dependency graph against the previous version's graph to identify new edges introduced by the release.
- Escalate to the CAB if the change affects more than a defined threshold of Tier 1 services.
Compliance and security audits: MITRE lists ServiceDependencyMapping as a documented defensive technique for assessing how risks propagate through service relationships. Use your map to trace data flows across compliance boundaries (PCI, HIPAA, SOC 2) and verify that sensitive data does not traverse unauthorized paths.
A concrete example: a team preparing a database schema migration queries the map for all services that call the target database. The team notifies all owners, schedules the change during a low-traffic window, and confirms rollback procedures with critical owners. The migration completes without an unplanned outage. Without the map, some services would likely have been missed.
Best Practices and Common Pitfalls in Dependency Mapping
The most common failure mode is not a bad tool. It is a stale map that engineers stop trusting, which means they stop using it, which means it gets staler. Preventing that cycle requires governance, not just technology.
Do / don't:
- Do automate topology refresh. PagerDuty and modern practitioners agree that static maps are obsolete on deployment. Manual updates cannot keep pace with microservice environments.
- Don't embed environment names in service names (
payments-prod,payments-staging). Use a separateenvattribute so the logical service identity stays consistent across lifecycle stages. - Do focus on service-to-service boundaries. Mapping internal function calls as graph nodes creates thousands of low-value edges that obscure the relationships that matter for operations.
- Don't rely on a single data source. A map built only from CMDB records will miss runtime-discovered connections; a map built only from traces will miss infrastructure-layer dependencies.
- Do assign an owner to every node. An unowned service in a blast-radius query is a gap in your incident response plan.
- Don't display potential edges in your primary operational view. Keep them in a separate layer for architecture review.
Governance checklist:
- Ownership model: every service node has a named team and an on-call rotation
- Update frequency: automated refresh with a staleness SLA (e.g., critical services updated within 5 minutes)
- Retention policy: minimum 30 days of historical topology for post-incident review; 90 days for compliance environments
- Validation cadence: quarterly review of ownership metadata and edge confidence scores with service owners
Pro Tip: Run a monthly "map health" report that flags nodes with no owner, edges with confidence below your threshold, and services absent from the map that appear in your CMDB. Treat map health as an operational metric, not a documentation task.
For teams building governance documentation, process documentation best practices for SaaS ops provides a useful framework for formalizing ownership and update procedures alongside your topology artifacts.
A Concrete Walkthrough: Build and Use a Dependency Map for a Web App
This walkthrough uses a simple four-tier web application: a React front end, a Node.js API, a PostgreSQL database, and a third-party payments API. Follow these steps during a POC or learning exercise.
- Collect distributed traces. Instrument the Node.js API with the OpenTelemetry SDK. Configure trace export to your collector. Verify that spans capture
http.url,db.system, andpeer.serviceattributes. After 15 minutes of traffic, you should see trace data showing front end → API → DB and API → payments API call paths. - Capture network flows. Deploy an eBPF-based collector (or enable NetFlow on your network device) to capture Layer 4 flows between your hosts. This confirms the connections the traces describe and surfaces any connections the traces miss (e.g., a background job calling the DB directly).
- Merge sources and score confidence. For each edge, check whether it appears in both traces and network flows. Edges confirmed by both sources receive a "confirmed" status. Edges appearing only in network flows or only in static config receive "potential" status. Reference OneUptime's dependency mapping guide for merge logic details.
- Visualize upstream and downstream. Load the merged graph into your visualization layer. Apply filters: environment = production, health overlay = active alerts. You should see five nodes (browser, API, DB, payments API, and the background job) with labeled edges showing call direction and latency.
- Run sample graph queries:
- Blast radius:
MATCH (s:Service {name: "postgres-db"})<-[:CALLS*1..3]-(caller) RETURN caller.name, caller.tier— returns all services calling the DB up to three hops away. - Upstream callers:
MATCH (s:Service {name: "payments-api"})<-[:CALLS]-(caller) RETURN caller— returns direct callers of the payments API. - Time-slice comparison: Query the graph at T-24h and compare edges against the current graph to identify new connections introduced by a recent deployment.
- Blast radius:
- Pre-deploy checklist before a DB maintenance window:
- Run the blast-radius query. Confirm all callers are identified.
- Check each caller's tier and SLO.
- Notify the API team and the background-job owner at least 24 hours in advance.
- Confirm the payments API has a circuit breaker or retry logic that tolerates a DB outage window.
- Schedule the window during the lowest-traffic period visible in your telemetry.
How Netverge Implements Service Dependency Mapping in Practice
Netverge maps directly to the evaluation checklist covered earlier, with several capabilities worth highlighting for MSPs and multi-site enterprises.
Feature highlights aligned to the checklist:
- Real-time discovery: Netverge's 28+ intelligent sensors continuously collect telemetry across network, application, and infrastructure layers, keeping topology data fresh without manual intervention.
- Knowledge graphs: The platform's built-in knowledge graph stores and queries service relationships, enabling blast-radius traversal and upstream/downstream navigation from a single interface.
- Ownership and metadata: Service nodes carry team ownership, environment tags, and SLO tier data, so blast-radius queries return actionable context, not just a list of service names.
- Alerting integration: Map-driven alerts connect directly to Netverge's AI-powered ticketing module, injecting topology context into incident tickets automatically so on-call engineers start with the dependency graph already visible.
- Vergepoints hardware: For physical sites and edge locations where software-only agents have limited reach, Vergepoints provide plug-and-play on-site visibility, extending the topology graph to include physical infrastructure without requiring complex agent deployment.
- API access: Netverge exposes APIs for programmatic topology queries, enabling CI/CD pipeline integration for pre-deployment blast-radius checks.
Suggested POC scope for Netverge trials:
- Timebox: 2 weeks
- Target services: 4–6 critical services in one business domain (e.g., your core billing or authentication stack)
- KPIs to measure: topology freshness (target: under 5 minutes for critical services), coverage percentage of your pre-defined critical-service list, false-positive rate, and time-to-root-cause on at least one simulated or real incident
Pro Tip: Start your Netverge POC by deploying one Vergepoint at your highest-traffic physical site and enabling trace ingestion for your most critical service. Within 48 hours, you will have a baseline topology graph to validate against your CMDB records.
For teams managing distributed networks across multiple client sites, Netverge's AI-powered network monitoring capabilities extend the same topology visibility to multi-tenant MSP environments, with role-based access keeping each client's graph isolated.
What to Prioritize First When Adopting Dependency Mapping
Most teams that struggle with dependency mapping do not fail because they chose the wrong tool. They fail because they tried to map everything at once, produced a graph too large and too noisy to trust, and abandoned the effort after the first incident where the map was wrong.
The right approach is to start with a single critical domain, prove the value in two weeks, and then use that proof to secure organizational buy-in for broader rollout. Pick the domain where an outage would hurt most: payments, authentication, or your core data pipeline. Instrument it thoroughly, validate the edges against what your engineers already know, and run one real or simulated incident through the map. When the map helps an engineer find the root cause faster than they would have without it, that is your business case.
Formalizing ownership is the second priority, and it is often harder than the technical work. Every node needs a named team and an on-call rotation before the map is useful for blast-radius notifications. Without that, a blast-radius query returns a list of services with no one to call.
Quick actions your team can take this week: audit your existing telemetry sources, identify your 10 most critical services, and schedule a two-week POC with a single business domain as the target. That is enough to generate a baseline graph, measure coverage, and run your first blast-radius query.
Netverge Gives You a Topology-Aware Starting Point, Not a Blank Canvas
Deploying a dependency-mapping practice from scratch takes weeks when you are assembling instrumentation, storage, visualization, and alerting from separate tools. Netverge consolidates those layers into one platform, so your team starts with a working topology graph rather than an integration project.

For MSPs and multi-site enterprises, the platform's knowledge graphs, 28+ sensors, and Vergepoints hardware cover both software-layer and physical-site visibility from day one. The AI-powered ticketing module injects topology context directly into incident workflows, so on-call engineers see the dependency graph without switching tools. A two-week POC scoped to 4–6 critical services is enough to validate coverage, measure freshness, and compare time-to-root-cause against your current baseline. Request a demo or start a scoped trial at Netverge and define your POC KPIs before your first call.
Sources
- What Is Dependency Mapping? - AWS
- Dependency Mapping for Faster Incident Resolution | PagerDuty
- Service Dependency Mapping - Technique D3-SVCDM