
Network capacity planning is the process of measuring your current network resources, forecasting future demand, and provisioning infrastructure before performance degrades or an outage forces your hand. Start by pulling recent utilization data from your core links, assigning a named owner to the capacity program (typically a senior network engineer or operations manager), and scheduling regular review cycles. Done well, a mature capacity program prevents unplanned outages, eliminates reactive over-purchasing, and gives finance a defensible basis for capital expenditure decisions.
Table of Contents
- Why capacity planning matters for operations, finance, and reliability
- Which metrics should you actually measure?
- What use cases drive capacity planning decisions?
- How do you build a repeatable capacity planning process?
- Which forecasting approach fits your situation?
- How do you right-size transit, peering, and IX capacity?
- What tools and data sources do you need?
- What should you budget and how long does it take?
- Common pitfalls and how to avoid them
- Why model-based forecasting outperforms blind extrapolation
- Your 30/60/90-day action plan
- Key Takeaways
- What the field actually teaches you about capacity planning
- Netverge gives your team a faster path through every planning stage
- Useful sources and further reading
Why capacity planning matters for operations, finance, and reliability
The operational case is straightforward: teams that plan capacity proactively spend less time firefighting. Unplanned congestion events generate incident tickets, escalations, and often emergency circuit upgrades at premium pricing. A structured program reduces that reactive load by surfacing bottlenecks weeks or months before they affect users.
The financial case is equally concrete. Without a plan, procurement decisions default to "buy more than last time," which consistently leads to overprovisioning on some links while under-provisioning others. Aligning spend to measured bottlenecks and forecast scenarios lets you defend every line item in a budget review. It also shifts the conversation from opex surprises to planned capex, which finance teams strongly prefer.
Different stakeholders need different outputs from the same plan. Operations needs threshold alerts and runbooks. Finance needs cost scenarios and ROI estimates for proposed upgrades. Product and application teams need lead-time estimates so they can schedule rollouts without triggering unplanned congestion. Security teams need session and flow data to distinguish capacity events from traffic anomalies. A single well-structured capacity program serves all four audiences without requiring separate reports.
Which metrics should you actually measure?
The metrics that matter for capacity decisions fall into six categories. The table below maps each metric to its collection method and the threshold logic that triggers a capacity review.
| Metric | Collection method | Capacity threshold guidance |
|---|---|---|
| Bandwidth utilization | NetFlow/IPFIX, SNMP interface counters | p95 > 70% on a sustained basis; p99 > 85% triggers upgrade planning |
| Throughput (goodput) | Flow telemetry, synthetic tests | Degradation below SLA baseline triggers investigation |
| Latency (RTT) | ICMP/TCP synthetic probes, APM | p95 RTT increase > 20% above baseline warrants review |
| Jitter | Active synthetic tests, streaming telemetry | Sustained jitter > 10 ms on voice/video paths |
| Packet loss | Synthetic probes, interface error counters | Any sustained packet loss on production paths |
| Session/concurrency | Firewall and load-balancer logs, SNMP | > 70% of rated session table capacity |
| Device CPU/memory | SNMP, streaming telemetry (gNMI) | CPU p95 > 75%; memory > 80% sustained |
| Wireless airtime | AP telemetry, controller APIs | Per-radio airtime utilization > 70% during peak hours |
Percentile metrics matter more than averages. An average utilization of 45% on a link that spikes to 95% for 10 minutes every business day is a capacity problem. The p95 figure captures that spike; the average hides it. Traffic analysis and forecasting guidance from ITU Online reinforces that p95 and p99 measurements, combined with burstiness analysis, give a far more accurate picture of real demand than mean utilization alone.
No single data source gives you a complete view. SNMP provides device counters and interface statistics at polling intervals, but misses flow-level detail. NetFlow and IPFIX give you top-talker analysis and application breakdowns, but require a collector and storage. Streaming telemetry via gNMI delivers sub-second device counters for high-frequency events. Cloud provider metrics APIs cover egress, request rates, and quota consumption. Synthetic tests validate the user experience independently of device-reported counters. Combine all five, and you have a defensible baseline. Rely on just one, and you will miss the bottleneck that actually causes the next incident.
Pro Tip: Set up top-talker reports by source IP, destination IP, and application protocol alongside your utilization dashboards. A single misconfigured backup job or a rogue video stream often accounts for 30–50% of unexpected utilization spikes, and flow data surfaces it in minutes.
What use cases drive capacity planning decisions?
Knowing which business event is driving your next capacity review helps you prioritize correctly and pull the right forecast inputs. The most common triggers, and how each changes your planning approach:
- Cloud migration or SaaS adoption: Shifting workloads from on-premises data centers to cloud providers changes traffic patterns dramatically. North-south internet egress increases; east-west data-center traffic may drop. A cloud migration strategy should include a traffic-pattern impact assessment before cutover, not after.
Prioritize use cases by two axes: business impact if capacity fails, and implementation lead time. A branch opening with relatively short circuit lead time ranks higher than gradual headcount growth scenarios with longer lead times, even if the long-term volume is larger.
How do you build a repeatable capacity planning process?
A five-step operational framework covers the full cycle from discovery through verification. The table below maps each stage to its deliverables, owner, and acceptance criteria.
| Stage | Key deliverable | Owner | Acceptance criteria |
|---|---|---|---|
| 1. Discovery and inventory | Complete asset register with rated capacities | Network engineer | Every link and device documented; no undiscovered segments |
| 2. Baselining and monitoring | 30–90 day p95/p99 utilization per resource | NOC / monitoring team | All critical links reporting; gaps < 5% of data points |
| 3. Trend analysis and forecasting | Growth trend per resource; 6–18 month projection | Senior network engineer | Forecast validated against last quarter's actuals |
| 4. Scenario modeling and design | Three scenarios (best/expected/worst) with upgrade options | Network architect | Each scenario has a cost estimate and decision threshold |
| 5. Implementation and verification | Upgraded or re-provisioned resources; post-change validation | Network engineer + change management | Post-change p95 utilization below target threshold |
The review cadence matters as much as the process itself. A quarterly review catches most organic growth trends. But certain events should trigger an out-of-cycle review immediately: a new application rollout, a merger or acquisition, a major cloud migration, a security incident that changes traffic patterns, or any link hitting p95 > 80% for two consecutive weeks. Document these triggers in your governance policy so the team does not wait for the next scheduled review when the data is already telling you to act.
Sample timelines: A quick audit of a single site or a small network takes 2–4 weeks. A 90-day program covers discovery, baselining, initial forecasting, and a first upgrade recommendation for a mid-size enterprise. An ongoing enterprise program runs quarterly reviews with an annual full refresh and a rolling 18-month forecast horizon.
Which forecasting approach fits your situation?
Three methods cover most planning scenarios, and they are not mutually exclusive.
Simple historical extrapolation: Take your trailing 6–12 months of p95 utilization, fit a linear or exponential trend line, and project forward. Fast to produce and easy to explain to stakeholders. Works well for stable environments with predictable organic growth. Breaks down when a business event (acquisition, major app rollout, cloud migration) changes the trajectory.
Seasonality-adjusted models: Layer a seasonal decomposition on top of the trend line to account for repeating annual or quarterly patterns. Retail, healthcare, and education networks benefit most. Requires at least 12 months of clean historical data to fit the seasonal component reliably.
Model-based forecasting with business inputs: Build a demand model that takes telemetry trends as one input and adds planned business events as explicit variables. Headcount schedules, application rollout dates, cloud migration milestones, and scheduled events each contribute a traffic increment that gets added to the baseline trend. This approach requires more coordination with HR, product, and IT project management, but it produces forecasts that remain accurate even when the business changes direction. Research from Merit Network confirms that simple trend surveys and raw historical data consistently fail to predict long-term bandwidth needs, and that scenario-aware, market-context-informed methods are required for defensible planning.
For high-stakes decisions (new circuit contracts, major hardware refreshes, data center expansions), model-based forecasting is the right choice. The additional coordination cost is small compared to the cost of a wrong sizing decision locked into a multi-year contract.
Pro Tip: Validate your forecast model quarterly by comparing its predictions against what actually happened. A model that consistently over-predicts by 20% is still useful once you know its bias. One that has never been validated against actuals is a liability.
How do you right-size transit, peering, and IX capacity?
The choice between transit, peering, and internet exchange (IX) connections affects both cost and performance, and the right mix depends on your traffic profile.
Transit is the default: you pay a provider to carry your traffic to any destination on the internet. It is operationally simple but costs more per Mbps at scale. Transit is appropriate when your traffic is broadly distributed across many destinations with no single dominant peer.
Peering (bilateral or settlement-free) makes sense when a significant fraction of your traffic goes to a specific network. If 30% of your egress goes to a single content provider or cloud platform, a direct peering arrangement eliminates transit costs for that traffic and typically reduces latency. The operational trade-off is relationship management and the need to monitor the peering link separately.
Internet exchange (IX) connections give you access to many networks through a single physical port. For networks with diverse top-talker ASNs, an IX port often delivers better economics than multiple bilateral peering agreements.
A simple headroom calculation for a WAN or internet circuit:
Assume a 1 Gbps circuit with a current p95 utilization of 620 Mbps (62%). Your 12-month trend shows 8% monthly growth. At that rate, you reach 70% utilization (700 Mbps) in approximately 1.5 months and 85% (850 Mbps) in about 4.5 months. If your upgrade lead time is 60 days, you need to initiate the upgrade process now, not at 80%. Build a 20–30% headroom buffer above your p95 threshold into every circuit sizing decision, and factor in the contractual lead time before the headroom calculation, not after.
Device limits often fail before the circuit does. A firewall rated for 500,000 concurrent sessions running at 420,000 (84%) is a higher-priority capacity risk than a circuit at 65% utilization, because session table exhaustion causes hard failures with no graceful degradation.
What tools and data sources do you need?
Reliable capacity planning depends on combining multiple telemetry sources. No single tool covers every dimension. Centralizing your telemetry and inventory data into a unified platform is what makes cross-source correlation possible.
- Planning For Network Capacity: Traffic Analysis And Forecasting — ITU Online IT Training
- Predicting Bandwidth Demand and Network Planning Implications on the Internet
- Network Capacity Planning: A Complete Guide for 2026
- More than 75 percent of American households own computers — BLS
- kentik · GitHub
- BrightTALK channel — VIAVI-related webinars
For data quality, set retention windows of at least 13 months to support year-over-year seasonality comparisons. Use 1:1 sampling on critical links and 1:100 or 1:1000 on high-volume aggregation points where storage is a constraint. Validate data completeness weekly: gaps in flow data or SNMP polling failures corrupt your baseline and produce unreliable forecasts.
What should you budget and how long does it take?
Timeline and cost vary significantly by scope, but the ranges below give you a starting framework for business-case modeling.
Quick audit (2–4 weeks): Covers a single site or a focused review of 5–10 critical links. Produces a gap analysis and a prioritized short list. Cost drivers: engineer time (typically 40–80 hours), any new monitoring tooling licenses, and data storage for flow collection. No circuit or hardware costs at this stage.
90-day program: Covers a mid-size enterprise or a managed service provider's top-tier clients. Produces full baselines, initial forecast scenarios, and a prioritized upgrade roadmap. Cost drivers: engineer time (200–400 hours across the team), monitoring platform licenses, and potentially a professional services engagement for telemetry architecture. Use the Netverge pricing calculator to model platform costs against your deployment scale before committing.
Enterprise program (quarterly reviews, annual refresh): Ongoing operational cost. Budget drivers include circuit upgrade costs (which vary widely by provider, location, and bandwidth tier), hardware refresh cycles (typically 5–7 years for core infrastructure), cloud egress costs (which can grow faster than on-premises costs during cloud migrations), and project management overhead for change windows and testing.
Budgeting checklist for a business case:
- Current annual cost of reactive incidents (engineer hours, emergency circuit upgrades, SLA penalties)
- Projected cost of planned upgrades over 12 and 24 months under each forecast scenario
- Risk-adjusted cost of doing nothing (probability of outage × estimated business impact)
- Expected ROI: reduced incident hours, avoided emergency procurement premiums, and improved SLA compliance
Finance teams respond to risk-adjusted numbers. A capacity upgrade that costs $50,000 and prevents a single 4-hour outage that costs $200,000 in lost productivity and SLA penalties is a straightforward approval.
Common pitfalls and how to avoid them
The mistakes that derail capacity programs are predictable, and most of them are avoidable with the right practices in place.
Frequent mistakes:
- Measuring only bandwidth: Teams that track interface utilization but ignore session tables, CPU, airtime, and queue depths miss the device-level failures that cause most real incidents. A firewall that runs out of sessions at 40% link utilization is a capacity failure that bandwidth monitoring will never catch.
- Stale inventories: A capacity plan built on an outdated asset register produces forecasts for links and devices that no longer exist and misses new ones that do. Inventory must be a living document, updated at every change window.
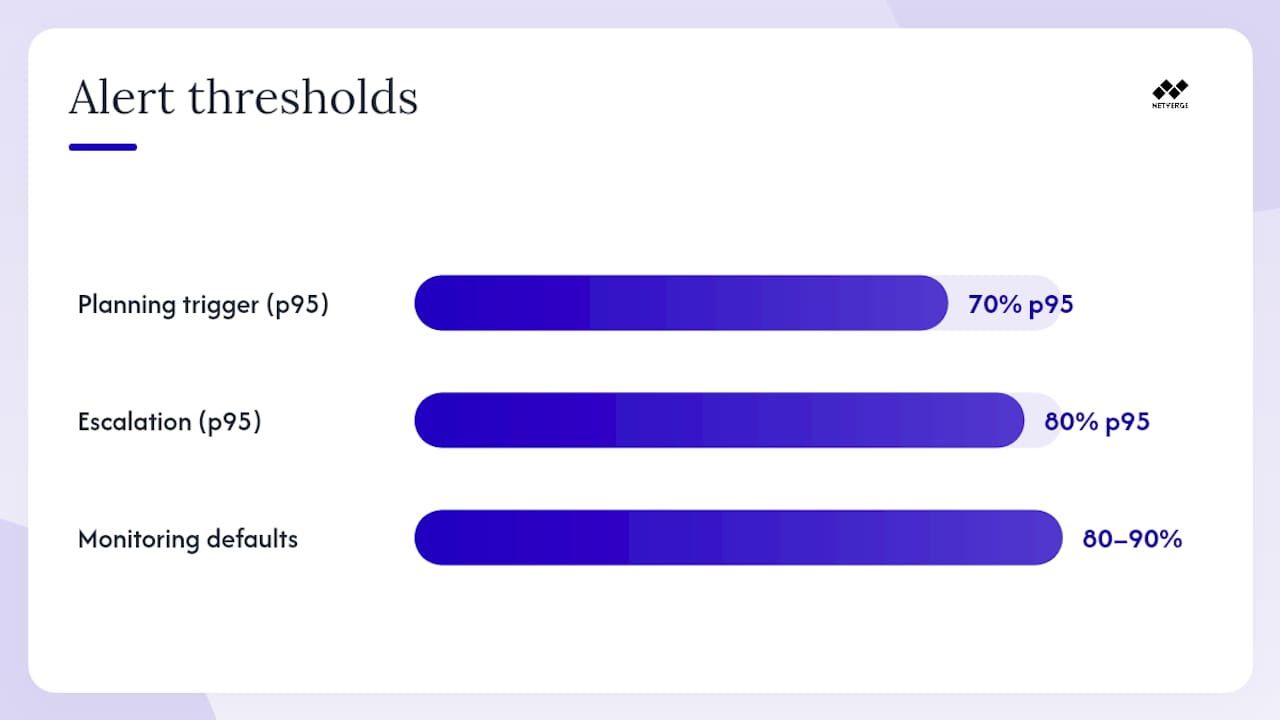
- Default alert thresholds: Most monitoring platforms ship with 80% or 90% utilization alerts. Those thresholds are too high for capacity planning purposes. By the time you hit 85% p95 utilization, your upgrade lead time may already be inside the danger window.
- Ignoring burstiness: A link that averages 50% but bursts to 98% for 30 seconds every hour is causing retransmissions and latency spikes that users feel. Percentile metrics and burst analysis catch this; averages do not.
- Treating capacity planning as a one-time project: Networks change continuously. A plan that is not reviewed on a defined cadence becomes stale within one business quarter.
Field-proven best practices:
- Anchor forecasts to business events, not just historical trends. Coordinate with HR, product, and IT project management to get planned headcount, application rollouts, and migration schedules into your model.
- Use p95 and p99 as your primary capacity metrics. Set alert thresholds at 70% p95 for planning triggers and 80% p95 for escalation.
- Collect from multiple telemetry sources. Flow data, SNMP, streaming telemetry, and synthetic tests each catch different failure modes.
- Run scenario planning (best/expected/worst) for every major upgrade decision. Well-constructed scenarios give leadership clear decision points and make capacity investment defensible to finance.
- Document a capacity incident runbook. It should include: detection criteria (which metric, which threshold), escalation path, short-term mitigation options (traffic shaping, QoS adjustments, temporary circuit upgrades), and the trigger for a permanent capacity change. Integrate this runbook with your incident management system so it surfaces automatically when a capacity-related alert fires.
Consolidating your monitoring tools into a unified platform makes runbook integration practical rather than aspirational. Fragmented tools mean fragmented response.
Why model-based forecasting outperforms blind extrapolation
The research case for model-based forecasting is clear. Merit Network's analysis of bandwidth demand prediction found that simple surveys and raw historical trends consistently fail to predict long-term bandwidth needs because they cannot account for the market and application shifts that drive demand discontinuities. The recommendation is explicit: combine trend signals with scenario planning and business-context inputs.
"Accurate forecasting must go beyond simple historical extrapolation. Model-based methods that incorporate business realities — planned headcount, application rollouts, cloud migrations — provide a more actionable view of future needs than trend lines alone. Historic trends are a useful input, not a sufficient answer." — ITU Online IT Training, Traffic Analysis and Forecasting
A practical model outline for a 12-month forecast:
Inputs: trailing 12 months of p95 utilization per resource (telemetry) + planned headcount additions by site + scheduled application rollouts + cloud migration milestones + known seasonal events.
Model selection: linear trend for stable segments; exponential smoothing for high-growth segments; additive seasonality overlay for predictable cycles.
Scenario generation: best case (lower-bound business growth, no major new applications), expected case (plan assumptions), worst case (accelerated growth + one major unplanned application adoption).
Decision thresholds: define the utilization level at which each scenario triggers an upgrade recommendation, and map that threshold to the procurement lead time for the relevant resource.
Validate the model quarterly by comparing its prior-quarter prediction against actual p95 measurements. A consistent over-prediction bias suggests your growth assumptions are too aggressive; consistent under-prediction means you are missing a demand driver. AI-driven monitoring trends are making model calibration faster by surfacing anomalies that indicate a new demand driver before it appears in trend data.
The BrightTALK VIAVI channel hosts recorded webinars on traffic engineering and capacity planning techniques that provide useful operational depth for teams building or maturing their forecasting practice.
Your 30/60/90-day action plan
Copy this checklist into Jira, Trello, or your preferred project tracker. Assign an owner and an acceptance criterion to each item before you start.
30-day: discovery and quick wins
- Audit your asset register: document every WAN link, core switch, firewall, VPN concentrator, and wireless controller with rated capacity and current software version.
- Enable NetFlow or IPFIX export on all core and WAN-facing interfaces; confirm data is reaching your collector.
- Pull 30 days of p95 utilization for every critical link; identify any resource already above 70%.
- Identify the top three business events in the next 90 days that will affect traffic (headcount additions, application rollouts, branch changes).
- Assign a named capacity program owner and schedule regular review dates.
60-day: baselining and initial forecasting
- Extend your baseline window; add device CPU, memory, and session-table metrics to your collection.
- Run a top-talker analysis by source IP, destination IP, and application to identify major traffic contributors.
- Build a simple trend model for your critical links using recent baselines.
- Produce initial forecast scenarios (including expected and worst cases) for the upcoming period.
- Present findings to stakeholders: operations, finance, and any application teams with planned rollouts.
90-day: model validation, upgrade planning, and governance
- Compare your 30-day forecast predictions against actual measurements; document the variance and adjust model assumptions.
- Produce a prioritized upgrade list ranked by risk (current utilization vs. threshold), lead time, and cost.
- Draft a capacity incident runbook and integrate it with your incident management platform.
- Establish a quarterly review cadence with defined out-of-cycle triggers.
- Document governance: ownership, escalation paths, review schedule, and the business-event intake process for feeding the forecast model.
The BLS data on computing device adoption underscores why this program needs to be ongoing rather than periodic: endpoint proliferation and connected-device growth continue to add demand complexity that a one-time audit cannot anticipate.
Key Takeaways
Effective network capacity planning requires combining multi-source telemetry, model-based forecasting with business inputs, and a defined quarterly review cadence to prevent outages and align infrastructure spend with real demand.
| Point | Details |
|---|---|
| Use percentile metrics | Track p95 and p99 utilization, not averages; set planning triggers at 70% p95 to stay ahead of upgrade lead times. |
| Combine telemetry sources | NetFlow, SNMP, streaming telemetry, and synthetic tests each catch different failure modes; no single source is sufficient. |
| Include business inputs in forecasts | Headcount schedules, application rollouts, and cloud migrations must feed your demand model, not just historical trend lines. |
| Plan for device limits, not just bandwidth | Firewall session tables, VPN concentrators, and wireless airtime often saturate before the circuit does. |
| Netverge accelerates every stage | Netverge unifies telemetry, inventory, anomaly detection, and runbook automation into one platform, reducing the time from data collection to upgrade decision. |
What the field actually teaches you about capacity planning
Most teams that struggle with capacity planning are not struggling with the math. They are struggling with the organizational habits around it. The forecast model is usually good enough. The problem is that nobody updated it when the company hired 200 people in Q3, or when the security team deployed a new DLP appliance that doubled firewall session consumption, or when the product team quietly rolled out a video feature that tripled per-user bandwidth.
The teams that run mature capacity programs share one practice that separates them from the rest: they have a formal intake process for business events. Every planned headcount addition, application rollout, cloud migration, and major project gets routed through the capacity program before it goes live. That single habit converts capacity planning from a reactive measurement exercise into a forward-looking operational function.
The other pattern worth noting: the teams that invest in centralizing their telemetry early recover from capacity incidents faster. When a link saturates at 2 AM, the difference between a 15-minute resolution and a 3-hour outage is usually whether the on-call engineer can pull flow data, device counters, and topology context from one screen or has to log into six different tools to piece together what happened. Centralized telemetry is not just a planning input. It is an incident response asset.
The 30/60/90 checklist in this guide is a starting point, not a ceiling. The teams that get the most value from it are the ones that adapt it to their environment, assign real owners, and treat the quarterly review as a non-negotiable operational commitment rather than a nice-to-have.
Netverge gives your team a faster path through every planning stage
The planning process described in this guide works. It also requires pulling data from multiple sources, maintaining a live inventory, correlating telemetry across tools, and keeping runbooks current. For most teams, that coordination overhead is where programs stall.

Netverge consolidates the telemetry, inventory, topology, and anomaly detection your capacity program depends on into a single platform. Its 28+ intelligent sensors cover interface utilization, device CPU and memory, session tables, wireless airtime, and cloud metrics simultaneously. AI-powered anomaly detection surfaces demand shifts before they cross your alert thresholds. The network monitoring platform feeds your forecast model with clean, centralized data from day one, and the no-code agent designer automates verification steps and runbook execution after every capacity change. Use the pricing calculator to model deployment costs against your site count and monitoring scope, then request a demo to see how quickly your team can move from discovery to a prioritized upgrade list.
Useful sources and further reading
The sources below informed this guide and provide deeper reading on specific techniques.
- Planning For Network Capacity: Traffic Analysis And Forecasting — ITU Online IT Training. Covers p95/p99 metrics, multi-source telemetry requirements, and component-specific capacity considerations. Start here for metrics methodology.
- Predicting Bandwidth Demand and Network Planning Implications on the Internet — Merit Network. Explains why simple historical extrapolation fails and makes the case for scenario-based, market-aware forecasting. Essential reading before building your first demand model.
- Network Capacity Planning: A Complete Guide for 2026 — Domotz. Vendor-agnostic walkthrough of the five-step operational process and continuous review cadence. Useful as a cross-reference for the process section of this guide.
- BrightTALK VIAVI Channel — Recorded webinars on traffic engineering and capacity planning from operational practitioners. Recommended for team training and technique exploration beyond this guide.