
Infrastructure performance optimization is the process of systematically improving your technology stack to maximize efficiency, minimize latency, and reduce operational costs. For IT professionals and network engineers, this is not a one-time project. It is a continuous discipline that directly affects business outcomes. Every 100ms of latency causes a 1% loss in user conversions. One real-world case saw trial-to-paid conversion rates double from 12% to 26% after optimizing Largest Contentful Paint from 4.2 seconds to 1.8 seconds. This infrastructure performance optimization guide covers the full workflow: from baselining and bottleneck localization to remediation, validation, and sustained performance tuning.
What are the key performance metrics and tools for assessing infrastructure health?
Effective infrastructure optimization starts with measurement. Without a clear baseline, you cannot distinguish a real improvement from random variance.
The three metrics every IT team must track are SLA latency percentiles (p50, p95, p99), Mean Time to Resolve (MTTR), and system uptime. Latency percentiles matter more than averages because averages hide tail latency. A p99 of 800ms means 1 in 100 requests is painfully slow, even if your p50 looks fine. MTTR measures how fast your team recovers from incidents, and uptime tracks overall availability against contractual SLA commitments.

Monitoring tools like CloudWatch, Performance Insights, X-Ray, and DevOps Guru provide the telemetry you need to locate bottlenecks and measure SLAs in production. Each tool covers a different layer of the stack.
| Tool | What it measures |
|---|---|
| AWS CloudWatch | Infrastructure metrics: CPU, memory, disk I/O, network throughput |
| Performance Insights | Database query load and wait events |
| AWS X-Ray | Distributed request tracing across services |
| AWS DevOps Guru | Anomaly detection and operational recommendations |
Continuous monitoring is not optional. Point-in-time snapshots miss intermittent issues that only surface under peak load. A network performance management workflow built around persistent telemetry collection gives you the data to act on, not just observe.
Pro Tip: Set alert thresholds at p95, not p99. By the time p99 degrades, p95 has already been suffering long enough to affect a significant portion of your users.
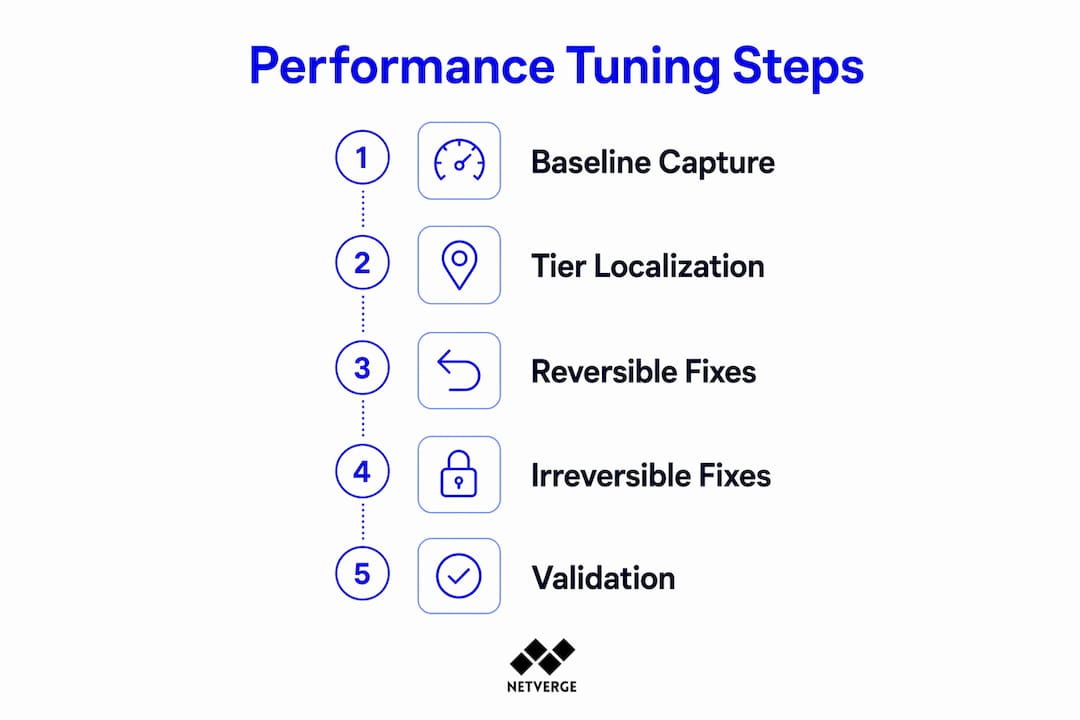
How to follow a step-by-step performance tuning remediation process
A disciplined remediation process prevents wasted effort and avoids introducing new problems while fixing old ones. The seven-step remediation framework covers the full cycle from definition to validation.
- Define SLAs. Set explicit latency, throughput, and availability targets before touching anything. Without defined targets, you cannot measure success.
- Capture baselines. Record current p50, p95, and p99 latency, error rates, and resource utilization under normal and peak load conditions.
- Localize the bottleneck by tier. Identify which tier is causing the most latency impact: edge, compute, cache, database, storage, or network. Starting remediation at the wrong tier wastes time and budget.
- Identify root causes. Use distributed tracing tools like X-Ray and query analysis tools like Performance Insights to pinpoint the specific query, service, or component responsible.
- Design the remediation. Choose the fix that addresses the root cause directly. Prefer reversible changes, such as index additions or cache configuration updates, before committing to irreversible architectural changes like schema migrations.
- Execute changes safely. Deploy fixes during low-traffic windows. Use feature flags to limit exposure and enable fast rollback if the fix causes unexpected behavior.
- Validate over a full business cycle. Do not declare success after 24 hours.
The tier localization step is where most teams go wrong. Engineers often jump straight to database tuning when the real bottleneck is at the edge layer, or they add compute capacity when the problem is an unindexed query. Mapping the latency contribution of each tier before acting is the single most effective way to avoid false economies.
Pro Tip: Always execute reversible remediations before irreversible ones. Adding an index is reversible. Dropping a column is not. This sequencing protects you from compounding problems during a live remediation.
Common pitfalls include fixing symptoms instead of root causes, skipping baseline capture, and validating over too short a window. A weekend of clean metrics does not confirm a fix. Production traffic patterns vary by day of week, billing cycle, and seasonal load.
Which infrastructure optimization techniques yield the best improvements?
The highest-impact techniques address the layers where latency compounds fastest: the database, the cache hierarchy, and the compute tier.
Database indexing and query optimization
A single SQL optimization can produce dramatic results. A proper database index reduced P99 latency from 800ms to 45ms, a 17x improvement. That is not an outlier. Unindexed foreign keys, full table scans on large datasets, and N+1 query patterns are common in production systems that grew organically. Query analysis with tools like Performance Insights surfaces these issues in minutes.
CDN caching and hierarchical cache architecture
CDN caching reduces origin server load by 80–95% for content-heavy applications. That reduction directly lowers compute costs and improves Time to First Byte (TTFB) for end users. A hierarchical caching architecture that combines CDN, application-level cache, and database query cache compounds these gains. Each layer offloads the one below it. The result is lower latency at every tier simultaneously. For CDN implementation specifics, the role of CDN in hosting covers speed, cost, and reliability tradeoffs in detail.
Instance right-sizing
Matching instance types to workload profiles is more effective than default selections. Memory-intensive workloads running on compute-optimized instances will thrash under load, regardless of how much CPU headroom exists. Dynamic scaling and right-sizing balance performance and cost by maintaining resilience without overprovisioning. The goal is to target a TTFB under 200ms while avoiding the false economy of oversized instances that sit idle 80% of the time.
| Technique | Typical latency improvement | Cost impact |
|---|---|---|
| Database indexing | Up to 17x P99 reduction | Minimal (storage only) |
| CDN caching | 80–95% origin offload | Reduces compute spend |
| Instance right-sizing | Eliminates resource contention | Reduces overprovisioning cost |
| Hierarchical caching | Compound gains across all tiers | Lowers DB and compute load |
| Edge computing | Reduces TTFB for global users | Adds edge infrastructure cost |
Pro Tip: Audit your cache hit ratio before adding compute capacity. A cache hit ratio below 80% means you are paying for compute to serve requests that should never reach your origin.
How to implement and validate performance fixes effectively
Execution discipline separates teams that sustain improvements from those that regress within weeks. Three practices define safe, effective implementation.
- Use feature flags for rollout. Feature flag-based deployment limits exposure to a subset of traffic before full rollout. If a fix degrades performance for a specific user segment or traffic pattern, you catch it early and roll back without a full deployment cycle.
- Deploy during change windows. Low-traffic periods reduce the blast radius of unexpected issues. Schedule changes outside peak hours and coordinate with application teams to avoid conflicting deployments.
- Validate for at least 14 days. Validating fixes for less than a full business cycle risks regressions. Weekly traffic patterns, batch jobs, and billing cycles all affect load profiles. A fix that holds for 14 days has survived enough variation to be considered stable.
Cross-functional collaboration between application and infrastructure teams is not optional during validation. Application teams own the query patterns and code paths. Infrastructure teams own the compute, network, and storage layers. A fix that improves database latency may shift the bottleneck to the application tier. Both teams need to monitor their respective layers simultaneously during the validation window.
Fallback strategies must be defined before execution, not after. Document the rollback procedure, the rollback trigger conditions, and the responsible owner before the change window opens. Teams that define fallback plans in advance recover in minutes. Teams that improvise recover in hours.
For baseline measurement and post-optimization validation, a structured monitoring approach ensures you capture the right signals before and after each change.
Pro Tip: Compare p99 latency across the same day of the week, not just the same time of day. Tuesday at 2 PM and Saturday at 2 PM have completely different load profiles in most production environments.
Key takeaways
Effective infrastructure performance optimization requires a structured, measurement-driven workflow that covers baselining, tier localization, targeted remediation, and sustained validation over a full business cycle.
| Point | Details |
|---|---|
| Measure before you fix | Capture p50, p95, and p99 baselines before any remediation to confirm real improvements. |
| Localize by tier first | Identify the highest-impact tier (edge, database, cache) before designing any fix. |
| Database indexing delivers fast wins | A single index change can reduce P99 latency by up to 17x with minimal cost. |
| Validate for 14 days minimum | Short validation windows miss weekly traffic patterns and lead to regressions. |
| Optimization is a continuous cycle | Measure, remediate, and validate repeatedly. Performance degrades as systems and traffic evolve. |
Why most teams optimize the wrong thing first
The most common mistake I see in infrastructure optimization is skipping tier localization and going straight to the most familiar fix. Database engineers add indexes. Network engineers reconfigure routing. Cloud architects resize instances. Each team optimizes their own layer without confirming it is actually the bottleneck. The result is real effort producing no measurable improvement.
Performance engineering is a business metric, not a technical exercise. When you frame latency reduction in terms of conversion rates and revenue impact, the conversation changes. Suddenly, the 17x P99 improvement from a single index is not a database story. It is a revenue story. That framing gets cross-functional buy-in faster than any technical argument.
The second mistake is treating optimization as a project with an end date. Optimization follows a continuous four-phase cycle: measure, identify, remediate, validate. Systems change. Traffic patterns shift. New features introduce new bottlenecks. Teams that build this cycle into their regular operations cadence consistently outperform teams that only optimize reactively after an incident.
The uncomfortable truth about cost optimization is that right-sizing often requires accepting short-term risk. Moving a memory-intensive workload from an oversized general-purpose instance to a memory-optimized instance is the correct call technically. But it requires testing, a change window, and a rollback plan. Teams that skip the testing phase to save time end up spending far more time on incident response. The 14-day validation window exists precisely because production systems are more complex than any pre-production environment can replicate.
Build the feedback loop. Assign ownership. Treat your p99 latency the same way you treat your uptime SLA. That is the shift that makes performance improvements stick.
— Jim
How Netverge supports real-time infrastructure performance monitoring
IT teams that follow a structured optimization workflow need continuous telemetry to catch regressions before they become incidents. Netverge's AI-powered network monitoring platform gives you real-time visibility across distributed infrastructure, with anomaly detection and automated diagnostics built in.
Netverge unifies network monitoring, event management, and automated troubleshooting into a single interface. Its AI agents correlate telemetry across layers, surface root causes, and triage issues without manual intervention. For MSPs and multi-location enterprises managing complex infrastructure, Netverge's infrastructure monitoring capabilities replace fragmented tools with a single source of truth. The result is faster detection, faster resolution, and a continuous performance record that supports every phase of your optimization cycle.
FAQ
What is infrastructure performance optimization?
Infrastructure performance optimization is the process of systematically improving a technology stack to reduce latency, increase throughput, and lower operational costs. It covers the full cycle from baselining and bottleneck identification to remediation and validation.
What metrics should I track for infrastructure performance?
Track p50, p95, and p99 latency percentiles, MTTR, and system uptime. Latency percentiles reveal tail latency issues that averages hide, making them the most reliable indicators of real user experience.
How long should I validate a performance fix before declaring success?
Validate for at least 14 days to cover a full business cycle. Shorter windows miss weekly traffic patterns, batch jobs, and billing cycles that can expose regressions after the initial validation period.
Which optimization technique delivers the fastest improvement?
Database indexing typically delivers the fastest and highest-impact improvement. A single index addition can reduce P99 latency by up to 17x with minimal cost and low implementation risk.
How does CDN caching affect infrastructure performance?
CDN caching reduces origin server load by 80–95% for content-heavy applications. Combined with application-level and database query caching in a hierarchical architecture, it compounds latency improvements across every tier of the stack.