Multi-Tenant Reporting for MSPs: Design It Right
Published
- multi-tenant reporting
- multi tenant analytics

Multi-tenant reporting means one reporting platform serves many customers, sites or business units, and each tenant sees only its own data. For an MSP or a multi-site IT team, the design that holds up has three parts: strict tenant isolation enforced at the data layer, one shared set of report definitions, and a cross-tenant summary that drills down into a single tenant. Netverge is built around this model for network operations: multi-tenant management, role-based access and unified dashboards on one platform.
TL;DR
- Multi-tenant reporting is one platform and one set of report definitions serving many tenants, with data, users and permissions logically separated.
- Enforce isolation where the data lives (row-level security, schemas or separate databases), not only in the dashboard.
- Build a cross-tenant summary for your own operations team and a per-tenant view for each customer, from the same metric definitions.
- Keep tenant limits in a central access model of teams and roles, so onboarding a client means adding users, not building reports.
- Netverge brings multi-tenant management, role-based access and dashboards together for MSPs and multi-location enterprises.
Table of Contents
- What multi-tenant reporting and multi-tenant analytics mean
- Three isolation models and when each fits
- Enforce isolation in the data layer, not the dashboard
- Cross-tenant summaries with drill-down
- What to put in a multi-tenant network report
- Configuring tenant views and scheduled delivery
- Limits to assess before you commit
- Where Netverge fits
- Human approval for automated actions
- A rollout checklist
- FAQ
- Sources
What multi-tenant reporting and multi-tenant analytics mean
The two terms describe the same idea at different depths. Reporting is the scheduled or on-demand output: a monthly service review, an uptime summary, a ticket report. Analytics is the interactive layer on top: dashboards, filters, comparisons. In a multi-tenant setup, both run on shared code and infrastructure, while data, users and configurations stay logically separated per customer.
In IT operations, a tenant is usually one of your managed clients, one site group, or one business unit. The practical test is simple: a technician at Client A must never see a device, ticket or metric that belongs to Client B, while your own operations lead must be able to see all of them side by side.
The alternative is single-tenant reporting, where each customer gets a separate environment and database. It gives full separation and customization, but it costs more to run and is slower to scale. For a provider adding clients every quarter, the shared model is what keeps reporting maintainable.
Three isolation models and when each fits
The architecture you choose decides how much you can trust the report. Three patterns cover almost every case, and they are described consistently in the multi-tenant reporting requirements guide from Yurbi.
| Model | How isolation works | Strength | Watch for |
|---|---|---|---|
| Shared database, shared schema | A tenant ID column filters every query | Simplest and cheapest to run | Riskiest: one missed filter exposes data; hard to certify for sensitive data |
| Shared database, separate schema | Each tenant has its own schema | Structural isolation, a good middle ground | Migration complexity as schemas change |
| Separate database per tenant | Each tenant has its own database | Strongest isolation | The reporting engine must route each query to the right database |
There is also a performance side. Holistics notes that row-level filtering is the cheapest to operate but gives weak isolation, because a heavy query from one tenant can slow responses for everyone else. Separate databases suit regulated industries such as healthcare and financial services, where the isolation guarantee justifies the operational cost.
A reasonable rule for MSPs: if your clients include regulated businesses, plan for stronger isolation from the start. Retrofitting it later means rebuilding reports.
Enforce isolation in the data layer, not the dashboard
A filter in a dashboard is a convenience. It is not a control. If a user can reach the same data through an export, a direct API call or a cached result, the dashboard filter does nothing.
The core technique is row-level security (RLS): a rule tied to a column such as a customer ID, so a user belonging to Customer A can read only rows where that column equals Customer A. Tinybird's guide to multi-tenant analytics explains this pattern with examples.
Two practices follow from it:
- Inject tenant context at query time. Qrvey argues that the analytics layer should take the tenant from a signed token and add it to each query before it reaches the database, because application-side filtering is fragile: one forgotten WHERE clause leaks data.
- Layer user-level rules inside the tenant. Tenant isolation is necessary but not sufficient. Within one client, a site manager may need only their site and a frontline technician should not see billing or contract data. Yurbi makes this point and stresses that the rules must hold at the data layer so exports and API calls return only entitled rows.
If you use a cloud BI service, read how it separates tenants. In Amazon QuickSight, groups and namespaces are the two isolation mechanisms, and namespaces are required when end users need Author licenses to build their own dashboards. AWS also states that group membership alone does not stop Author-licensed users from sharing new resources outside the group, which raises the risk of unintended exposure. Namespaces also simplify usage monitoring and chargeback per tenant.
Access design deserves its own document. Netverge's guides on the role-based access matrix and RBAC for MSPs walk through how to define who can see and do what across clients.
Cross-tenant summaries with drill-down
MSP reporting has two audiences, and they need different views of the same data.
Your operations team needs a portfolio view: every client in one table, sorted by what needs attention. Each client needs a view limited to their own sites, with the same layout and the same metric definitions.
Build both from one model:
- Portfolio level. One row per tenant with a small set of comparable measures: availability, open incidents, alert volume, ticket volume, and sensor coverage. Sort by the worst values so the page is a work queue, not a status poster.
- Tenant level. Click a row and land in that tenant's dashboard, scoped to their sites. The tenant filter is applied by the platform, not chosen by the viewer.
- Site and device level. Drill from a tenant into a site and then a device, keeping the time range and filters across each step.
The rule that makes comparison honest is one metric definition for all tenants. Smarten warns that as customers evolve, a shared layer tends to fracture into hardcoded tenant filters, multiple dashboard versions, special cases for high-value customers and metrics defined differently per tenant. If "availability" means something different for each client, the portfolio view compares nothing.
For network teams, Netverge's article on network dashboards and their strategic uses and the piece on the benefits of unified dashboards cover how to structure these views.
What to put in a multi-tenant network report
The right content depends on the reader. These are practical starting sets for MSPs and distributed IT teams.
For your own operations team
- Availability and incident count per tenant over the period.
- Alert volume per tenant, and how much of it became tickets.
- Time to acknowledge and time to resolve incidents, by tenant and by technician group.
- Recurring issues: the same device, site or circuit appearing in several incidents.
- Coverage: how many sites and sensors are reporting versus expected.
For each client
- A plain-language service summary: what happened, what was fixed, what is still open.
- Site-by-site health for their locations only.
- Trends over several months, so a client can see whether things are getting better.
For executives and finance
- Usage by tenant (sites, devices, sensors, storage) to support billing and capacity planning.
- Which tenants consume the most support effort.
Keep each report short. A summary that needs explaining before a client can read it is a data dump.
Configuring tenant views and scheduled delivery
There are two common patterns for tenant-specific views, and both avoid building a copy of every report per client.
One dashboard, many filtered audiences. AWS describes a method for QuickSight: create a rules dataset with columns for the group and the customer filter, attach it to the primary dataset, then share one dashboard and one schedule with the customer groups. Each recipient receives a report filtered by row-level security, so they see only the data permitted for them.
A central control table. ClicData describes an access model built on teams, roles and parameters, where a derived control table centralizes per-user client limits and filters are enforced at query level. The benefit, as that guide explains, is fewer cross-client leaks, an audit trail of who can access what, and faster onboarding, since adding a client means adding users and teams rather than new reports.
Whichever pattern you use, test it before the first client sees a report:
- Log in as a user from Tenant A and try to reach a Tenant B device by URL, export and API call.
- Confirm that a filter set by one user does not carry over to another.
- Check that scheduled deliveries contain only the recipient's rows.
- Review the access list for each tenant at a set interval, and remove users who left.
Limits to assess before you commit
Google's documentation on multi-tenant workloads in BigQuery lists the considerations worth reviewing on any shared platform: isolation, performance, quotas and limits, geographic distribution, auditing and security, cost management, and operational complexity.
For an MSP, this translates into concrete questions:
- Isolation. Is tenant separation enforced in the data layer, and can you show it to a client's security reviewer?
- Performance. What happens to report speed when your largest client runs a long query?
- Data location. Do any clients require data to stay in a specific region?
- Auditing. Can you show who viewed or exported a tenant's data?
- Cost. Does cost grow per client, per site, per sensor or per user, and can you pass it through in billing?
- Integrations. Do the network, cloud and ticketing sources you rely on feed the same reports, or do you stitch them together by hand?
The last point is where many MSPs lose time. Reports built across separate monitoring, ticketing and documentation tools need manual joins, and each tool has its own idea of what a client is. Netverge's article on the hidden cost of tool sprawl covers that problem from the operations side.
Where Netverge fits

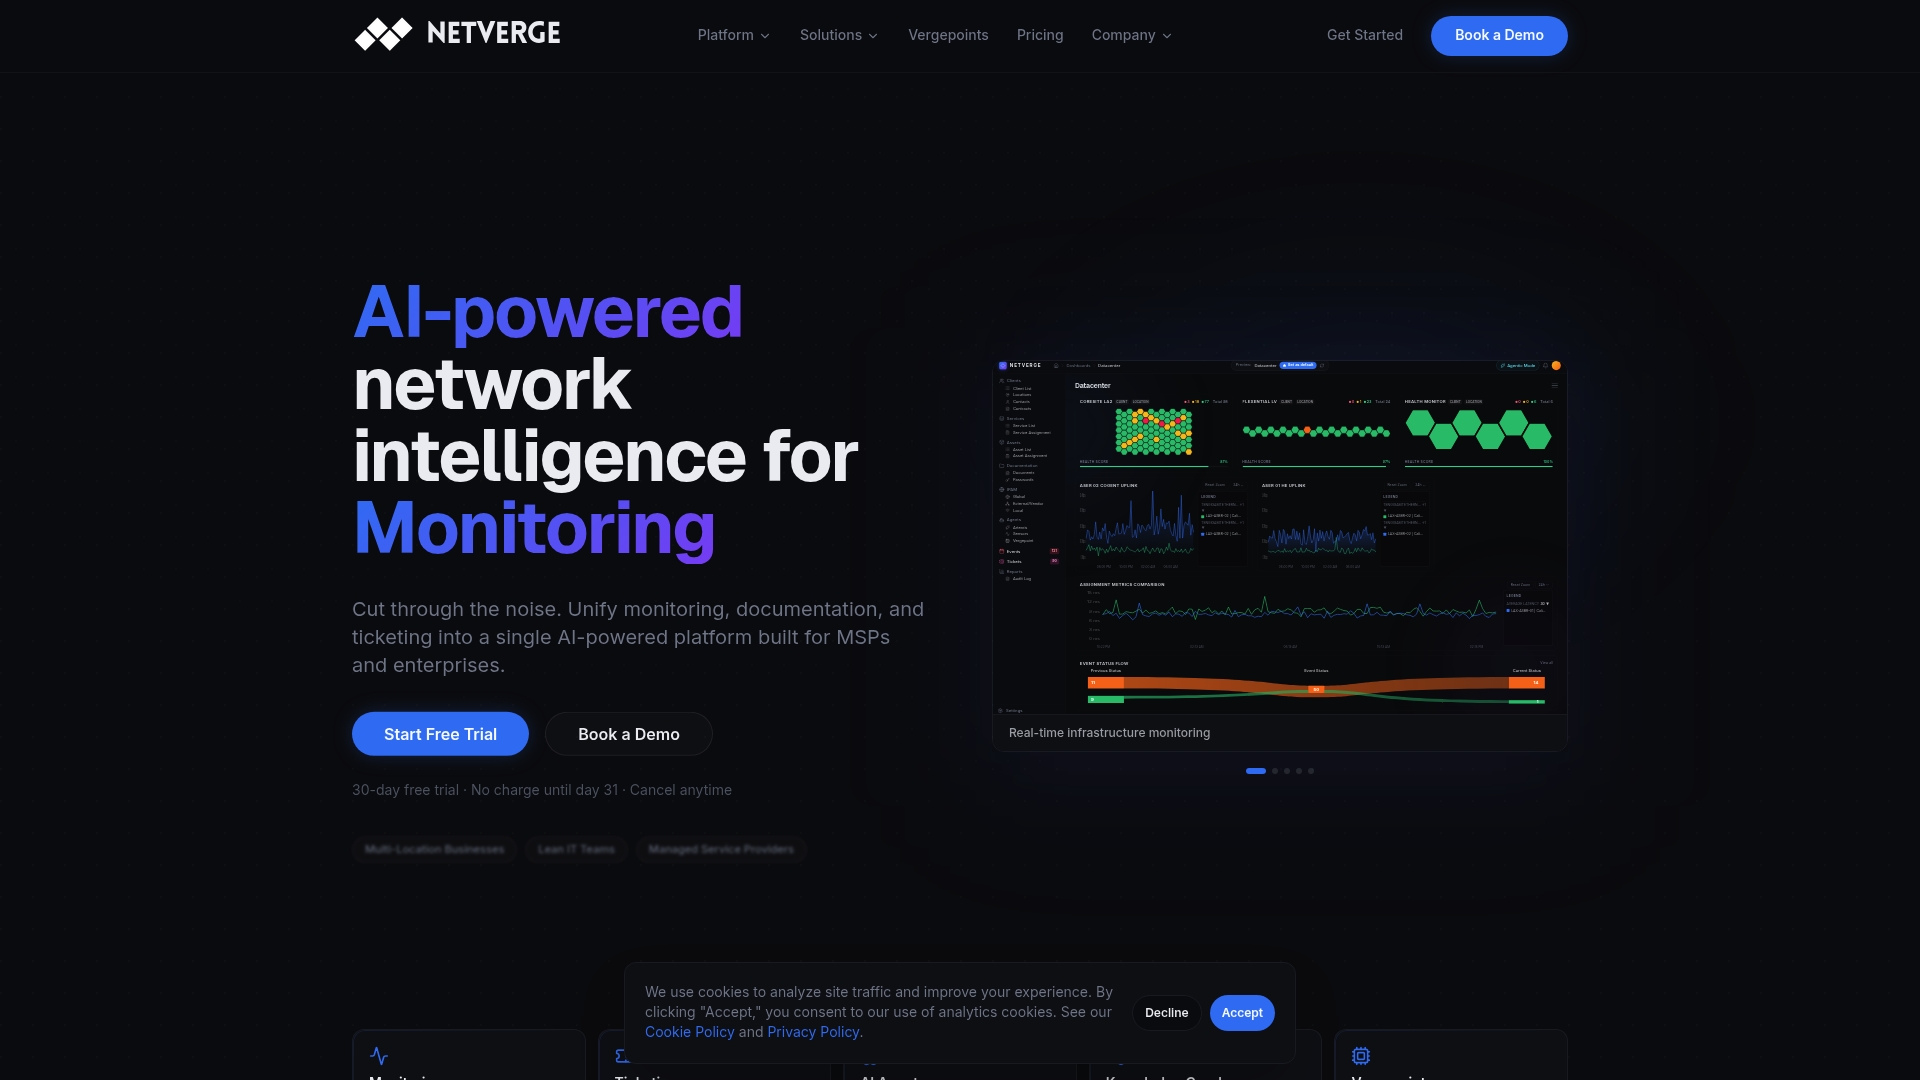
Netverge unifies network monitoring, documentation, ticketing and automation in one AI-powered platform for MSPs and multi-location enterprises. Multi-tenant management and role-based access are part of the platform, so the client structure that drives your reports is the same one that drives your monitoring and tickets. Dashboards sit on top of that shared data, and a knowledge graph connects devices, sites and incidents in context.
For on-site visibility, Vergepoints provide edge hardware, with a software Vergepoint option, and the platform includes 28+ intelligent sensors. Autonomous AI agents diagnose and resolve issues, and ticket triage is AI-assisted. For a deeper look at the tenant model, read multi-tenant network monitoring: what MSPs need to scale. Teams working with identity providers can also read the Okta SSO integration guide, and the security and trust page describes the platform's security approach.
Published pricing starts with the Starter Package at $299 per month. Add-ons are listed on the pricing guide: hardware Vergepoints at $49 per month per device, software Vergepoints at $29 per month per Vergepoint, and 100 additional clients at $100 per month per 100 clients. Sites, sensors, AI agents and storage are priced the same way. Use the pricing calculator to estimate your monthly cost, or start a free trial to see how your client structure looks in the dashboards.
Human approval for automated actions
Reporting often leads to automation: a recurring issue in the report becomes a workflow that fixes it. Keep a clear line between what the platform observes and what it changes.
- Read-only first. Let automation diagnose and summarize before it is allowed to change anything.
- Scope by tenant. An automated action should run only within the tenant it was triggered for, under that tenant's access rules.
- Approval for changes. Require a named person to approve any action that changes configuration or affects service, and record who approved it.
- Log everything. Each automated step should appear in the tenant's history, so the next report can show what was done and why.
Before relying on any specific automation or integration in Netverge, confirm that it is available today in the current product documentation rather than assuming it from a roadmap.
A rollout checklist
- Define the tenant. Client, site group or business unit, and keep it consistent across monitoring, tickets and reports.
- Pick the isolation model based on your most regulated client.
- Write the access matrix of roles per tenant before building any report.
- Fix the metric definitions for availability, incidents, resolution time and coverage.
- Build the portfolio view and one tenant view, then copy the tenant view through filters, not duplicates.
- Test isolation from a user's side through the interface, exports and the API.
- Review quarterly: access lists, metric definitions and the reports clients actually open.
FAQ
What is the difference between multi-tenant and single-tenant reporting?
Single-tenant reporting gives each customer a separate environment, often with its own database. Multi-tenant reporting serves all customers from one shared platform and separates their data with filters, schemas or separate databases. The shared model is cheaper and easier to update, while the separate model offers the strongest isolation.
How do I keep one client's data hidden from another?
Enforce separation in the data layer with row-level security or separate schemas or databases, and pass tenant identity into every query from a signed token. Then test through exports and API calls, not only the dashboard.
Can one report show all clients and still let me drill into one?
Yes. Build a portfolio summary with one row per tenant, using one shared set of metric definitions, and link each row to a tenant dashboard scoped to that client's sites. Your operations team gets the comparison and each client sees only its own view.
Do I need a separate report for every client?
No. Use one report template with tenant-level filters applied by the platform. A control table or a role model maps users to tenants, so adding a client means adding users and teams instead of copying reports.
Sources
- How to Implement Multitenant Reporting for SaaS Applications
- Multi-tenant analytics for SaaS applications
- What Multi-Tenant Reporting Actually Requires
- Multi-Tenant Analytics (Holistics)
- Multi-Tenant Analytics: Why It's Hard (Qrvey)
- Support multi-tenant applications for SaaS environments using Amazon QuickSight
- Deliver Amazon QuickSight pixel-perfect reports to multiple customer groups
- Secure Multi-Tenant Dashboards in ClicData
- The Multi-Tenant Analytics Challenge (Smarten)
- Best practices for multi-tenant workloads on BigQuery