
Missed alerts don't just slow you down. They can trigger SLA violations, cascade into outages, and cost your MSP clients before your team even knows something is wrong. The uncomfortable reality is that most undetected network incidents aren't caused by device failures. They're caused by poll-based blindness, where events occur and resolve between monitoring intervals, leaving your systems completely unaware. This guide breaks down how real-time network alerts work, why they're non-negotiable for MSP operations, and how to configure, tune, and govern them for maximum reliability and minimum noise.
Table of Contents
- Defining real-time network alerts and how they work
- Types of triggers and architectures for real-time alerting
- MSP alert fatigue: The cost of too many (or too few) alerts
- Key requirements for reliable and actionable real-time alerts
- Why most real-time alerting strategies fall short (and how MSPs can fix them)
- Enhance your MSP with advanced monitoring solutions
- Frequently asked questions
Key Takeaways
| Point | Details |
|---|---|
| Event-driven detection | Real-time network alerts use push/streaming telemetry instead of slow poll-based systems, reducing visibility gaps. |
| Layered alert types | Using threshold, anomaly, and composite alerts makes detection quicker and smarter in complex MSP environments. |
| Alert fatigue risks | Untuned alerting floods operators, reducing the effectiveness of response teams and risking missed incidents. |
| SLA-bound alert delivery | Reliability and low-latency delivery of alerts are must-haves, not ‘nice-to-haves,’ for MSP service quality. |
| Operational governance | Treating alerting as a managed system, not just a tool, yields better outcomes for stability and staff retention. |
Defining real-time network alerts and how they work
Real-time network alerts are immediate notifications triggered by network events as they occur. Unlike traditional monitoring systems that check device states on a fixed schedule, real-time alerting delivers notifications without delay, giving your operations team the ability to act before an issue compounds.
The technical distinction matters here. Push and streaming telemetry are increasingly replacing poll-based collection models in modern monitoring platforms. Instead of waiting for the next scheduled query, streaming systems receive data continuously from network devices, processing events the moment they're generated.
Poll-based monitoring, by contrast, introduces a structural gap. SNMP polling on an interval means any event that occurs and resolves between two polls is completely invisible to your alerting system. For a brief but critical interface flap or a short-lived authentication failure, that gap can mean the difference between early detection and a full incident.
Here's a side-by-side comparison of the two models:
| Feature | Poll-based monitoring | Streaming/event-driven monitoring |
|---|---|---|
| Data freshness | Stale between intervals | Continuous, near-instant |
| Blind spot risk | High (events can go undetected) | Low |
| Alert latency | Minutes (depends on poll cycle) | Milliseconds to seconds |
| Scalability | Limited by polling overhead | Scales with telemetry pipeline |
| Typical protocol | SNMP Get | gRPC, streaming telemetry, syslog push |
| Best for | Low-change environments | Dynamic, high-traffic MSP networks |
When real-time alerting is properly deployed across your infrastructure, the operational benefits are concrete:
- Reduced mean time to detect (MTTD): Incidents surface within seconds, not minutes.
- Faster incident response: On-call engineers receive actionable context immediately.
- Proactive network health checks: Anomalies are flagged before clients notice degradation.
- SLA protection: Faster detection translates directly to fewer SLA breaches.
- Improved client trust: Clients see fewer surprise outages and faster resolution times.
Building on network visibility sensors that push telemetry continuously gives your team the foundation for genuinely proactive operations. The network monitoring foundations you establish here will determine how effective every downstream alert and escalation process becomes.
Types of triggers and architectures for real-time alerting
Knowing that real-time alerts are event-driven is the starting point. Understanding which trigger type to use, and when, is where MSP teams actually gain operational leverage.
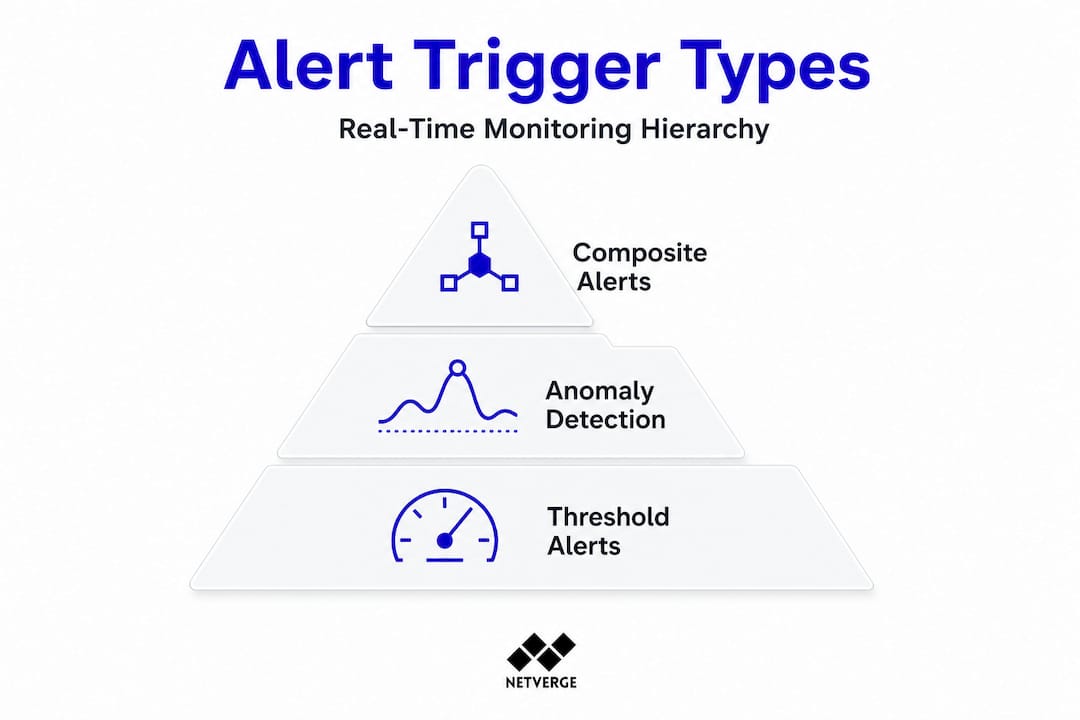
Real-time alerting systems use layered trigger types: threshold alerts, anomaly and baseline detection, and composite event correlation across multiple signals. Each serves a distinct purpose, and each comes with tradeoffs your team needs to understand before deployment.

Threshold alerts are the most straightforward. You define a boundary, such as CPU utilization above 90% or bandwidth exceeding 800 Mbps, and the system fires when that boundary is crossed. These are fast to configure and easy to understand, but they generate high false-positive rates in dynamic environments. A bandwidth spike during a scheduled backup isn't an incident. Without context, your threshold alert doesn't know that.
Anomaly detection takes a different approach. Instead of a fixed boundary, it builds a behavioral baseline for each device or service and flags deviations from that baseline. An unusual login from an unrecognized subnet at 2 a.m. is an anomaly even if no threshold is crossed. This trigger type is more sophisticated and better suited to detecting security-related events and subtle performance degradation.
Composite alerts are the most powerful and the most complex. They correlate multiple signals across time and devices to identify patterns that indicate a real incident. A single failed login isn't an alert. But five failed logins from three different IPs across two devices within 90 seconds, combined with an unusual outbound connection, is a composite trigger that indicates a potential attack pattern.
Here's a comparison of the three trigger types:
| Trigger type | Use case example | Complexity | Pros | Cons |
|---|---|---|---|---|
| Threshold | Bandwidth spike, CPU overload | Low | Fast setup, easy to understand | High false positives in dynamic environments |
| Anomaly detection | Unusual login, traffic pattern shift | Medium | Catches subtle issues, adapts to baselines | Requires training period, tuning effort |
| Composite | Multi-condition attack pattern, cascading failure | High | High accuracy, context-aware | Complex to configure, requires correlation engine |
Layered alerting architectures combine all three trigger types into a single detection pipeline. The architecture typically works like this:
- Telemetry ingestion: Raw data streams from network devices into the monitoring platform in real time.
- Threshold evaluation: Immediate checks against static rules fire fast alerts for obvious boundary violations.
- Anomaly scoring: The platform compares incoming data against historical baselines and flags statistical outliers.
- Event correlation: The correlation engine aggregates signals across devices and time windows to identify composite patterns.
- Alert prioritization: Correlated, high-confidence alerts are escalated. Low-confidence signals are queued for review or suppressed.
- Notification and routing: Alerts are routed to the right team or integrated with AI-driven triage for automated diagnosis.
This layered approach, combined with modern alert architectures and integrations like SIEM dashboard alerting, significantly improves detection accuracy while reducing noise.
Pro Tip: Use composite triggers for multi-tenant networks. When you're managing dozens of clients from a single NOC, a single misconfigured threshold alert can flood your queue. Composite triggers filter out the noise by requiring multiple conditions to be true before firing, which dramatically reduces false positives at scale.
MSP alert fatigue: The cost of too many (or too few) alerts
Layered alerts bring sophistication, but without careful tuning, they can overwhelm your team. Alert fatigue is one of the most underestimated operational risks in managed services, and its consequences are measurable.
Alert fatigue in MSP environments occurs when operators receive so many notifications that they begin ignoring them, including the ones that matter. The result isn't just inefficiency. It's missed real threats, slower escalation, and eroding client trust.
The scale of the problem is significant. A majority of North American MSPs report experiencing daily or weekly alert fatigue, with some teams receiving thousands of notifications per day. One well-documented case involved an MSP that reduced its daily alert volume from over 5,000 notifications down to just 3 by systematically tuning its notification system and applying event correlation. That's not a minor optimization. That's a complete operational transformation.
"After implementing intelligent alert correlation and tuning our thresholds based on actual incident data, we went from 5,000 daily alerts to 3 meaningful ones. Our engineers stopped dreading Monday mornings." This kind of reduction is achievable when MSPs treat alert tuning as an ongoing engineering practice, not a one-time setup task.
Alert fatigue shows up in predictable ways. Watch for these signs in your own operations:
- Dashboards go unmonitored: Engineers stop checking alert feeds because the signal-to-noise ratio is too low.
- SLAs get missed: Genuine incidents are buried under non-actionable notifications and aren't escalated in time.
- Escalation slows down: Teams develop informal habits of ignoring certain alert categories entirely.
- Ticket queues balloon: Every alert generates a ticket, and the queue becomes unmanageable.
- Staff turnover increases: Constant noise creates burnout, especially for on-call engineers.
The business case for fixing this is direct. MSPs that manage alert fatigue impact proactively retain engineers longer, respond to incidents faster, and differentiate themselves from competitors still drowning in noise. Clients notice the difference in response times and communication quality.
Smart alerting is a competitive advantage. When you can tell a client "we detected and resolved that issue before it impacted your users," you're not just delivering uptime. You're demonstrating operational maturity. Explore MSP network monitoring strategies and monitoring plan options that align with your scale and client base.
Key requirements for reliable and actionable real-time alerts
Controlling alert volume is necessary, but equally crucial is making sure the right alerts arrive at the right time. A real-time alerting system that fires accurate alerts but delivers them late is not a real-time system. It's a slow one with a good marketing label.
Alert delivery reliability and defined delivery SLAs are non-negotiable requirements. If your ingestion or processing pipeline introduces delay, your alerts are no longer timely or actionable. For MSPs managing critical infrastructure, a 10-minute delay in alert delivery can mean the difference between a minor incident and a full service outage.
Here are the minimum operational requirements your real-time alerting system must meet:
- Instantaneous data ingestion: Telemetry must be ingested and processed continuously, not batched. Any batching introduces latency that undermines real-time detection.
- Low-latency fan-out: Once an alert is generated, it must be delivered to all relevant recipients simultaneously. Sequential notification chains add delay.
- Guaranteed alert delivery: Your system must confirm that alerts were received and acknowledged. Dropped notifications are operationally equivalent to no alert at all.
- SLA tracking per service: Each monitored service should have a defined alert delivery SLA. For critical infrastructure, this might be under 30 seconds from event detection to engineer notification.
- Response confirmation: Engineers should acknowledge alerts within a defined window. Unacknowledged alerts should auto-escalate to the next tier.
- Pipeline health monitoring: The alerting infrastructure itself must be monitored. A failed alerting pipeline that silently stops delivering notifications is a critical failure mode.
Pro Tip: Establish alert delivery SLAs for every service tier you manage. Document the expected time from event detection to engineer notification, and audit that SLA quarterly. When your team knows the alerting system is reliable and fast, they trust it. That trust is what prevents the "I'll check it later" behavior that leads to missed incidents.
When evaluating or deploying real-time alert systems, test these requirements explicitly. Run synthetic events and measure end-to-end delivery time. Simulate pipeline failures and verify escalation behavior. Don't assume the vendor's stated latency figures match your actual deployment environment. Validate monitoring reliability under realistic load conditions before you commit to a platform for production use.
Why most real-time alerting strategies fall short (and how MSPs can fix them)
Here's a perspective that most alerting guides won't give you: the majority of real-time alerting failures in MSP environments aren't caused by bad tools. They're caused by bad process.
Teams invest in sophisticated monitoring platforms, configure dozens of triggers, and then wonder why their operations are still reactive. The tools are working. The problem is that nobody designed the alerting system as a system. There's no governance model, no standardized tuning process, and no feedback loop from the engineers who actually respond to alerts.
The uncomfortable truth is that alerting needs to be treated as a full engineering pipeline. That means thinking carefully about telemetry collection strategy, making deliberate architectural decisions about trigger types and correlation rules, designing operator workflows around how alerts are received and acted on, and conducting post-incident reviews that feed back into alert tuning. Most MSPs do the first step and skip the rest.
Site reliability engineers (SREs) at large enterprises have known this for years. They build feedback loops into their alerting systems. Every incident generates a retrospective. Every retrospective asks: did our alerts fire correctly? Did they fire too late? Did we get noise that slowed us down? Those answers directly update the alerting configuration. The result is a system that gets more accurate over time, not one that drifts toward noise.
MSPs can borrow these practices without enterprise-scale resources. Start with audit logs for alert tuning. Every time an engineer closes an alert as non-actionable, that should be logged and reviewed. Patterns in those logs tell you exactly which rules need adjustment. Build escalation policies that reflect your actual team structure, not a theoretical org chart. And most importantly, staff for alert governance. Someone needs to own the alerting system as a product, not just as a configuration file.
The one actionable step we'd recommend: conduct a quarterly alert system review with both technical and operations staff in the room. Technical staff know what the system is capable of. Operations staff know what's actually useful. That combination, reviewed regularly, is what turns a noisy alerting system into a reliable one. Read more about the alert fatigue deep dive to understand how this plays out at the MSP level.
Enhance your MSP with advanced monitoring solutions
If you're ready to move from reactive firefighting to proactive infrastructure management, Netverge delivers exactly the capabilities this guide has outlined.
Netverge's real-time monitoring platform is built on streaming telemetry, giving your team continuous visibility without the blind spots of poll-based systems. The platform's AI-powered anomaly detection and composite alert engine reduce noise automatically, so your engineers respond to real incidents, not false positives. The event management suite handles correlation, triage, and escalation in a single interface, eliminating the tool fragmentation that drives alert fatigue. Use the network monitoring price estimator to find the right plan for your MSP's scale and client portfolio. Request a demo today and see how Netverge transforms alert volume into operational clarity.
Frequently asked questions
What is the difference between real-time and traditional network alerts?
Real-time alerts are triggered and delivered immediately when events occur, while traditional systems may delay alerts due to polling intervals. Poll-based systems can miss short-lived incidents entirely if they occur and resolve between scheduled checks.
How can MSPs reduce alert fatigue?
MSPs can minimize alert fatigue by tuning alerts for relevance, applying composite triggers, and regularly auditing alert volume. Alert tuning in MSP contexts is an ongoing practice, not a one-time configuration task.
What are the main types of real-time alert triggers?
The three primary triggers are threshold alerts, anomaly detection, and composite event alerts. Each trigger type serves a different detection scenario, and layering all three produces the most accurate and actionable results.
Why is alert delivery speed important for network operations?
Timely alert delivery ensures your team can respond before incidents escalate into outages. Delays in alert pipelines undermine the entire value of real-time monitoring, making defined delivery SLAs a critical operational requirement for MSPs.