Digital Experience Monitoring: What It Measures and How
Published
- digital experience monitoring
- digital experience analytics
- dem monitoring

Digital experience monitoring (DEM) tracks how people actually experience your applications, networks and devices, not just whether the servers behind them are up. It measures load times, errors, latency and failed transactions from the user's side of the connection, then ties those results back to the infrastructure that caused them. For MSPs and multi-site IT teams, that means you learn about a slow SaaS app or a bad Wi-Fi segment before the ticket arrives.
This guide covers what DEM measures, how it differs from digital experience analytics, the approaches and metrics that matter, and how to build a program on network visibility you may already have.
TL;DR
- DEM measures performance from the user's point of view: apps, networks, devices and workflows under real conditions.
- It combines synthetic tests (scripted checks) with real-user and device data, so you see both what could break and what is breaking.
- Digital experience analytics focuses on behavior, such as clicks and conversion. DEM focuses on performance and availability.
- The fastest way to make DEM useful is to correlate user-side symptoms with network and infrastructure telemetry at each site.
- Start with your critical applications and sites, set thresholds, and expand from there.
Table of Contents
- What digital experience monitoring means
- How DEM works
- DEM vs. digital experience analytics
- Metrics that show a degraded experience
- Common DEM use cases for distributed teams
- Why network visibility is the base of DEM
- How to implement DEM in five steps
- Our perspective: DEM should end in a fix, not a chart
- Build the network side of DEM with Netverge
- Where DEM is heading
- FAQ
- Sources
What digital experience monitoring means
Traditional monitoring asks whether a device or service is healthy. DEM asks whether the person using it can get their work done. A switch can report green while a branch office struggles with a video call because of packet loss on one uplink. A server can show normal CPU while a login page takes nine seconds to load for remote staff.
TechRadar puts the contrast this way: observability is like a car's dashboard, while DEM is like a GPS. The dashboard shows engine details. The GPS tells you whether you are reaching your destination. You need both, but only one tells you whether the user is succeeding.
In practice, DEM covers three layers:
- Applications and services: web apps, SaaS tools, APIs, VoIP and video platforms.
- The network path: LAN, Wi-Fi, WAN, internet, DNS and cloud connectivity between the user and the service.
- The endpoint: the device, its resources, its browser or client and its connection quality.
A problem in any of the three looks the same to the user: "the system is slow." DEM exists to tell you which layer is at fault.
How DEM works
A DEM program collects data from two directions and combines it.
Synthetic monitoring
Synthetic monitoring runs scripted tests on a schedule from fixed locations. A test might load a login page, authenticate, open a dashboard and time each step. Because the tests run constantly, they catch outages at 3 a.m. when no real user is online, and they give you a consistent baseline for comparison.
Synthetic checks are also where on-site sensors help. A small device placed at a branch can run the same tests an employee's laptop would, from the same network segment, without waiting for someone to complain.
Real-user and endpoint monitoring
Real-user monitoring captures what actual people experience: page load times by location, browser, device and network. Endpoint-focused DEM adds device data such as CPU and memory pressure, Wi-Fi signal quality and application crashes. This is the data that explains why one employee has a problem while the rest of the office does not.
Correlation
Collecting the data is the easy part. The value comes from correlation: matching a spike in login time to a congested uplink, or a drop in call quality to a specific access point. Without that step, DEM produces another dashboard. With it, you get a probable cause attached to each symptom.

TechTarget notes that DEM can help organizations assess remote employee productivity and analyze SaaS application performance, and that teams can link the monitoring to business objectives.
DEM vs. digital experience analytics
The two terms are often confused because both talk about "experience." They answer different questions.
| Digital experience monitoring | Digital experience analytics | |
|---|---|---|
| Main question | Is the service fast, available and working for users? | How do users behave and where do they drop off? |
| Typical data | Latency, load time, errors, uptime, device and network health | Clicks, scrolls, session paths, funnels, conversion |
| Main audience | IT operations, network and support teams, MSPs | Product, UX and marketing teams |
| Typical action | Fix the network path, server, app or device | Redesign a page, change a flow, test a message |
The overlap is real. A slow checkout hurts conversion, and analytics will show the drop-off while DEM shows the cause. If you want the marketing side of that picture, this overview of digital marketing performance metrics shows how teams track the customer-facing outcomes that DEM data feeds into. For IT teams, the practical rule is simple: DEM tells you the experience is degraded and why, analytics tells you what that degradation costs in behavior.
Metrics that show a degraded experience
DEM is only as useful as the metrics you choose. The U.S. Web Design System guidance on tracking performance recommends choosing metrics based on the user's experience of the site, setting budgets and goals, and tracking both direct and indirect measures such as speed index, custom timing events and page weight. The same logic applies to internal applications and networks.
A working set for IT teams and MSPs:
- Page and transaction time: how long a login, search or form submission takes end to end.
- Availability and error rate: failed requests, HTTP errors, timeouts and failed synthetic steps.
- Network latency, jitter and packet loss: the three numbers that most often explain poor voice and video quality.
- DNS resolution time: a slow resolver makes everything feel slow.
- Wi-Fi quality: signal strength, retries and client density per access point.
- Endpoint health: CPU, memory and disk pressure, plus application crashes and boot time.
- Throughput and bandwidth saturation: whether a WAN link is the bottleneck during peak hours.
- Custom business timings: for example, how long a point-of-sale transaction takes to clear at a retail location.
Pick a small number to start. Five metrics tied to your three most critical applications beat fifty metrics nobody reviews. Set a baseline for each, then alert on deviation from that baseline rather than on a single fixed number copied from a vendor guide.
Common DEM use cases for distributed teams
DEM earns its place when users are spread across sites, networks and clouds, which is the daily reality for MSPs and multi-location businesses.
- SaaS performance: when a cloud app is slow only at certain sites, DEM separates a provider problem from a local WAN or DNS problem.
- Remote and hybrid work: home networks are outside your control, but you can still measure the path from the endpoint to the service and spot patterns.
- Branch office reliability: a sensor at each site shows what staff there actually get, so you stop guessing from a central view.
- Ticket reduction: when you detect and fix an issue before users report it, ticket volume drops and the tickets you do receive arrive with context.
- Business impact: TechTarget points out that DEM can correlate performance changes with effects on revenue, reputation and customer loyalty, which helps justify the budget.
- MSP service reporting: per-client experience data turns a monthly report from "uptime was 99.9%" into evidence that users had a good month.
Why network visibility is the base of DEM
Most DEM complaints trace back to the same pattern: the symptom shows up at the user, but the cause sits in the network or infrastructure. If your DEM tool flags a slow application and you cannot see the switch, firewall, WAN link or access point in the path, you have a symptom with no diagnosis.
That is why infrastructure and experience monitoring belong together. Our guides on end user experience monitoring for MSPs and IT teams and what infrastructure monitoring involves cover the two halves in more depth. The short version: user-side tests tell you something is wrong, and infrastructure telemetry tells you where.
Continuous coverage matters too. Problems do not keep office hours, and a plan that only reviews dashboards during the workday misses overnight degradation. This overview of 24/7 IT monitoring for small businesses explains how around-the-clock monitoring complements infrastructure health data with the user's view.
Agent or agentless collection
You will choose between installing software agents on endpoints and collecting data without them. Agents give richer device detail. Agentless methods, such as SNMP polling, flow data and on-site sensors, need no endpoint installs and work well for network devices and shared infrastructure. Most mixed environments use both. We compare the tradeoffs in agentless vs. agent-based monitoring.
How to implement DEM in five steps
- List the critical journeys. Name the three to five applications or workflows whose failure stops work: ERP login, VoIP calls, the point-of-sale system, the VPN, a SaaS CRM.
- Map the path for each one. Write down the devices, links and services between user and application at each site. Gaps in this map are gaps in your diagnosis.
- Deploy collection points. Place synthetic tests and sensors where users sit, not only in the data center. Add endpoint data where you can.
- Set baselines and thresholds. Run for a couple of weeks to learn normal behavior by site and time of day, then alert on meaningful deviation.
- Connect alerts to action. Route alerts into ticketing with the evidence attached: which site, which path, which metric changed. Review the metrics monthly and retire the ones nobody uses.
Challenges to plan for
- Alert noise. More data means more alerts. Correlate related alerts into one incident, and alert on user impact first.
- Blind spots outside your control. ISPs, SaaS providers and home networks sit outside your infrastructure. Measure the path to them so you can show where the problem is, even if you cannot fix it.
- Tool sprawl. One tool for synthetic tests, another for network devices, another for tickets and another for documentation leaves engineers stitching data together by hand. Consolidation shortens diagnosis.
- Privacy and access. Endpoint data can include user activity. Limit collection to performance data, and use role-based access so only the right people see it.
- Cost control. Pricing models vary by sensor, site or user. Model your site count and sensor count before you commit.
Our perspective: DEM should end in a fix, not a chart
We build network monitoring for MSPs and multi-location enterprises, and the same pattern keeps appearing. Teams buy a tool that reports a poor experience, then spend hours working out which device, link or configuration caused it. The report was accurate and almost useless.
Our view is that experience data has to arrive already connected to the infrastructure. That is why Netverge combines monitoring, documentation, ticketing and automation in one platform. Sensors and Vergepoints give on-site visibility at each location. A knowledge graph links devices, sites, clients and tickets, so a symptom comes with its context. AI agents then handle the first diagnostic steps and triage, so an engineer starts with a probable cause rather than a blank screen.
We also think teams should resist measuring everything. Choose the journeys your clients or staff depend on, instrument them well, and keep the alert volume low enough that people still read it. A smaller set of trusted signals beats a wall of graphs.
— Jim
Build the network side of DEM with Netverge
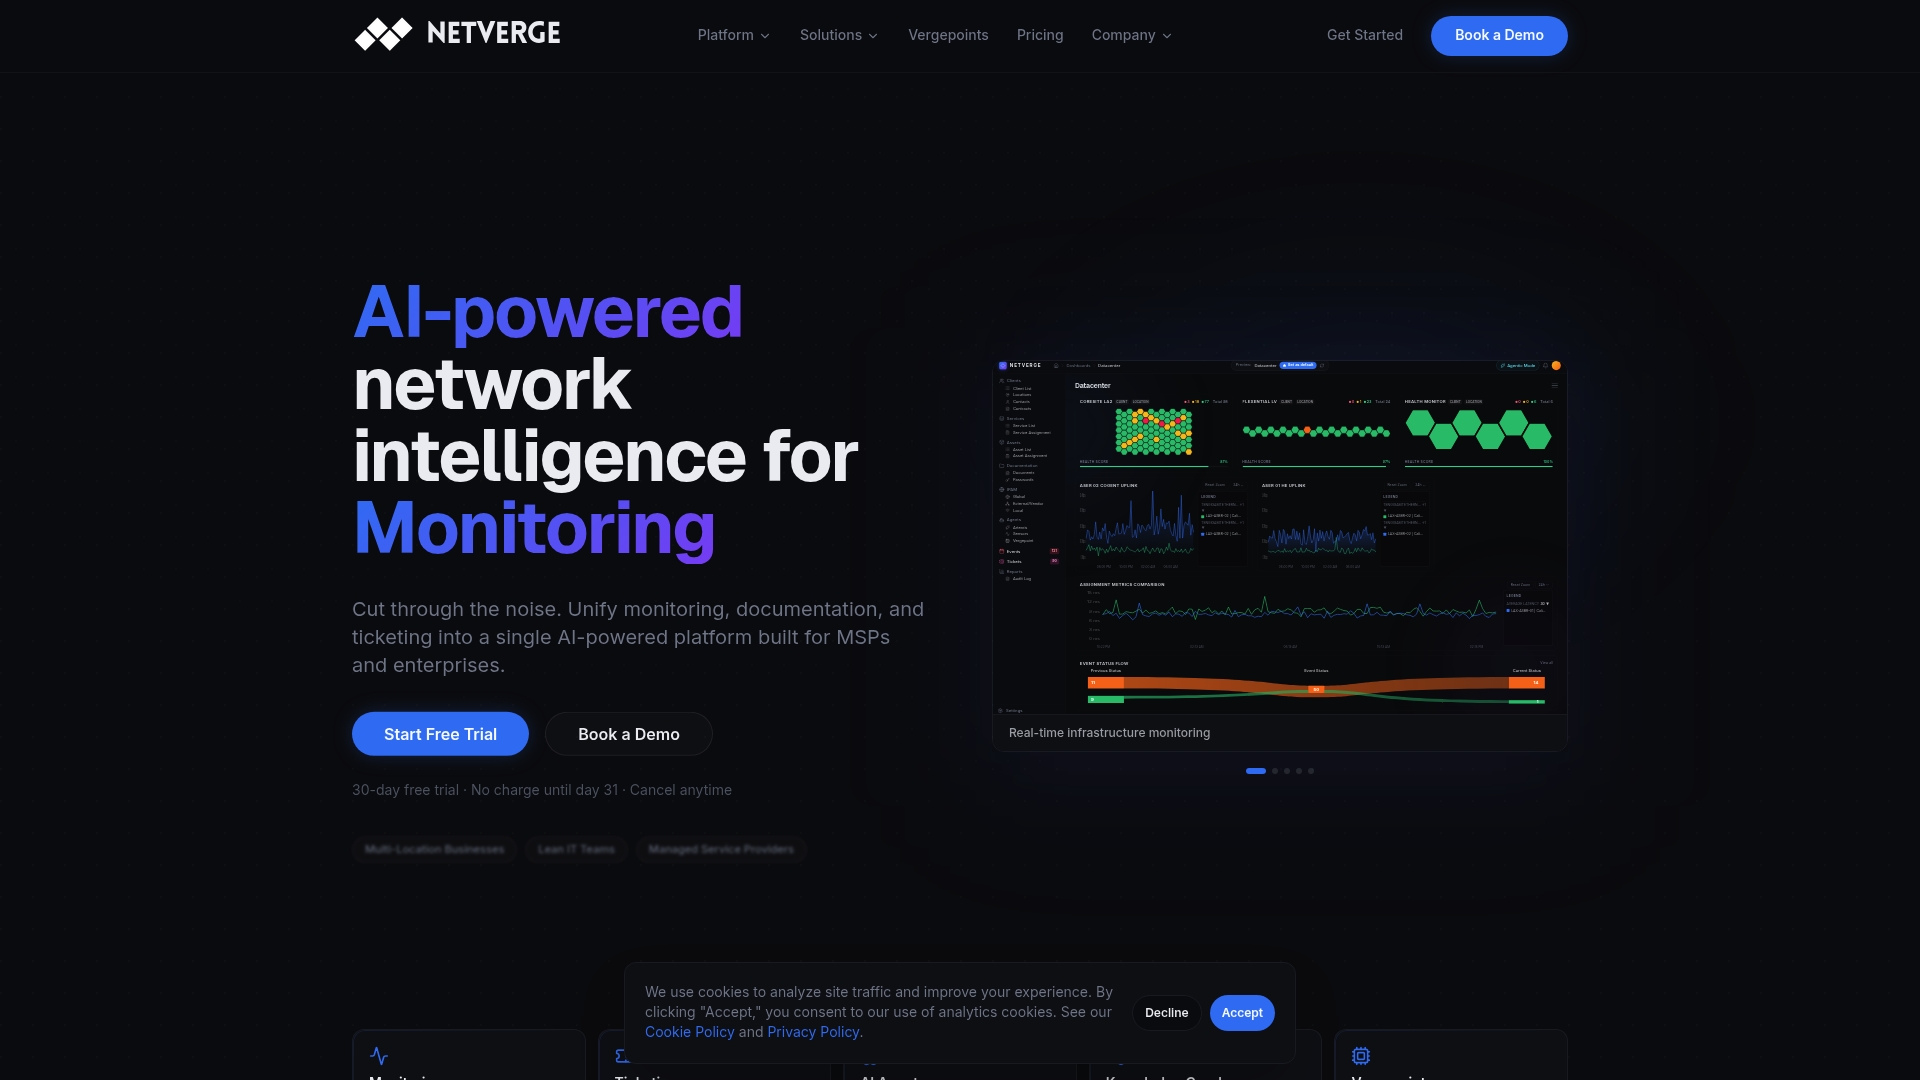
Netverge gives MSPs and multi-site IT teams the infrastructure layer that makes experience data actionable: real-time monitoring, anomaly detection, automated troubleshooting and AI-assisted ticket triage in a single platform, with 28+ intelligent sensors and integrations with major network and cloud vendors. You can see how it fits in our AI-powered network monitoring and observability overview.
Pricing is published. The Starter Package is $299 per month. Hardware Vergepoints for on-site visibility are $49 per month per device, and a software Vergepoint is $29 per month. Add-ons such as 100 additional monitoring sensors are $100 per month per 100 sensors, as listed on the pricing guide. To size a deployment, use the pricing calculator, or learn about the Vergepoint hardware first. When you are ready, start your free trial. Teams with larger estates can look at our enterprise monitoring and AI automation page or request a demo.
Where DEM is heading
Two shifts are shaping the next few years. First, teams are moving from alerting on thresholds to detecting anomalies against learned baselines, which cuts false alarms. Second, AI is taking over the repetitive diagnostic work: gathering logs, checking the path, comparing against past incidents and drafting the ticket. Our write-up on network monitoring trends for 2026 covers both in detail, and real-time monitoring methods explains the collection techniques underneath.
The practical takeaway does not change with the tooling. Measure what users experience, connect it to the network and infrastructure path, and send the evidence straight into the workflow where someone fixes it.
FAQ
What is DEM in IT?
DEM stands for digital experience monitoring. It is the practice of measuring how applications, networks and devices perform from the end user's perspective, using synthetic tests and real-user or endpoint data. IT teams use it to find and fix performance problems before users report them.
How is DEM different from application performance monitoring?
Application performance monitoring looks at the application's internals: code, servers, databases and transactions. DEM measures the result at the user, including the network path and the device. The two overlap, and many teams run both so they can tell a code problem from a network problem.
Is DEM the same as digital experience analytics?
No. DEM measures performance and availability, such as load time, latency and errors. Digital experience analytics studies behavior, such as clicks, session paths and conversion. Performance problems found by DEM often explain the drop-offs that analytics shows.
Can small teams or MSPs run DEM without a large budget?
Yes. Start with your three to five critical applications, run synthetic checks from each site, and add endpoint data later. Network visibility is the practical starting point because it explains most user-side symptoms, and a tiered platform lets you scale sensors and sites as you grow.
Sources
- TechRadar: What is digital experience monitoring and why is it critical for every organization
- TechTarget: What CIOs need to know about digital experience monitoring
- U.S. Web Design System: How to track performance
- Digital marketing performance metrics
- 24/7 IT monitoring for small businesses