
Most IT teams believe they have monitoring covered. They deployed a tool, configured a few alerts, and moved on. Then a critical application goes dark, users start calling the help desk, and the team is scrambling to figure out what happened and when. The truth is, having a monitoring tool is not the same as having effective infrastructure monitoring. There is a meaningful difference between knowing a problem exists and having the full context to resolve it quickly. This guide covers what infrastructure monitoring actually means, how it works, and the specific practices that help IT managers and MSPs stay ahead of outages instead of reacting to them.
Table of Contents
- Understanding infrastructure monitoring: The essentials
- How infrastructure monitoring works: Data collection and alerting explained
- Alerting best practices: From signal to action
- Key components of a resilient monitoring architecture
- What most IT leaders get wrong about infrastructure monitoring
- Advance your infrastructure monitoring with Netverge
- Frequently asked questions
Key Takeaways
| Point | Details |
|---|---|
| Broad data collection | Effective monitoring instruments many points but only alerts on the most actionable issues. |
| Hybrid telemetry methods | Real IT environments combine periodic polling and streaming to balance completeness and speed. |
| Alert optimization | Alert correlation and suppression stop alert storms so teams focus on true incidents. |
| Meta-monitoring | It's crucial to monitor your monitoring infrastructure itself to maintain system reliability. |
| Architectural resilience | A robust monitoring design covers data retention, fast querying, and multi-site needs. |
Understanding infrastructure monitoring: The essentials
Infrastructure monitoring is the continuous process of tracking the health, performance, and availability of every component in your IT environment. That includes network devices, servers, virtual machines, applications, storage systems, and end-user devices. The goal is straightforward: surface problems before they affect users, enable faster resolution when issues do occur, and provide data that supports planning, capacity decisions, and compliance reporting.
For Managed Service Providers and multi-location enterprises, infrastructure monitoring is not optional. You are managing complex, distributed environments where a single misconfigured switch or a saturated WAN link can create cascading problems across dozens of sites. Without continuous visibility, you are operating blind.
The core elements of any effective monitoring setup include:
- Data collection: Gathering telemetry from devices, applications, and services across all locations
- Alerting: Triggering notifications when conditions exceed defined thresholds or match anomaly patterns
- Actionable insights: Translating raw data into clear, prioritized information your team can act on
- Historical retention: Storing data long enough to support trend analysis, capacity planning, and audit readiness
One distinction that is especially important for modern environments is the difference between monitoring and observability. Monitoring and observability are related but not identical: monitoring focuses on detecting known issues through thresholds and anomalies, while observability helps diagnose root causes across complex, distributed systems. In practice, most production environments need both.
Effective infrastructure monitoring is not just about knowing when something breaks. It is about having enough context to understand why it broke, how long it has been degrading, and what needs to happen next.
Exploring proven network monitoring strategies is a good starting point for teams looking to move from reactive to proactive operations. Pairing that with purpose-built infrastructure monitoring solutions accelerates deployment and reduces configuration overhead.
How infrastructure monitoring works: Data collection and alerting explained
Understanding the mechanics of how monitoring systems collect and process data helps you design better coverage and avoid common gaps. There are two primary collection models in use today: polling and streaming.

Polling uses protocols like SNMP (Simple Network Management Protocol) to query devices at defined intervals. A poller sends a request, the device responds with status data, and that response is logged. It is reliable and widely supported, but the interval between polls creates a window where issues can go undetected.
Streaming or push-based telemetry works differently. Devices and applications emit data continuously as events occur. Real-time monitoring uses streaming telemetry to capture events like congestion, interface flaps, and security signals with minimal delay, rather than waiting for the next polling cycle. Most real-world deployments use a combination: low-frequency polling for routine status checks and higher-frequency streaming for fast event detection.
Here is how data moves through a monitoring pipeline in four stages:
- Collection: Agents, sensors, or protocol-based polling gather telemetry from devices, services, and applications across your infrastructure.
- Analysis: The monitoring platform ingests the data, applies thresholds, baselines, and anomaly detection logic to identify significant conditions.
- Alerting: When conditions meet defined criteria, the platform generates notifications and routes them to the right team or ticketing system.
- Response: Engineers or automated workflows act on alerts, guided by runbooks or AI-assisted diagnostics.
The types of data collected across these stages cover a broad surface area:
| Data type | Examples | Collection method |
|---|---|---|
| Device health | CPU, memory, disk utilization | SNMP polling, agents |
| Network traffic | Bandwidth, latency, packet loss | Flow data, streaming telemetry |
| Application performance | Response time, error rates, availability | Synthetic checks, APM agents |
| Security events | Failed logins, anomalous traffic | Syslog, SIEM integration |
| Failover and change events | Interface state changes, config diffs | Trap receivers, event streaming |
Understanding what data comes from which network sensor data sources is critical to building coverage without creating blind spots. Each data type requires a specific collection method, and gaps in any one category can leave your team without the full picture during an incident.
Pro Tip: Instrument broadly across your environment, but resist the urge to alert on every metric you collect. Alert only on conditions that are directly tied to user impact and have a clear runbook or owner. Noise from low-priority alerts is one of the primary causes of alert fatigue in IT teams.
Effective real-time data collection is also the foundation for everything discussed in later sections, including alerting policy, retention, and root cause analysis. Reviewing a detailed real-time network monitoring guide can help you determine which collection methods fit your environment's size and complexity.
Alerting best practices: From signal to action
Collecting data is only half the work. The value of infrastructure monitoring depends entirely on whether alerts lead to fast, accurate responses. Alert storms and alert fatigue are real operational problems that reduce your team's effectiveness and increase the risk of missing critical events.
The starting point for better alerting is recognizing that not every metric needs an alert. Many IT teams configure alerts for everything they monitor, which creates hundreds of low-priority notifications that bury the ones that actually matter. Instead, effective alerting policy focuses on conditions tied directly to business or user impact.
Key practices for turning signals into actionable alerts:
- Assign ownership clearly. Every alert should have a defined owner, whether that is a specific engineer, a team, or an automated response workflow. Alerts with no clear owner get ignored or delayed.
- Attach runbooks to alerts. A runbook is a documented set of steps for diagnosing and resolving a specific alert condition. When engineers receive an alert paired with a runbook, resolution time drops significantly because they are not starting from scratch.
- Implement dependency-based suppression. When a core switch fails, every device behind it will generate its own alert. Without suppression logic, one root cause creates dozens of downstream notifications. Alerts should be actionable with ownership and runbooks, and dependent-alert suppression is essential for reducing noise during major incidents.
- Correlate signals across systems. A spike in application error rates paired with high CPU on a database server tells a different story than either signal alone. Correlation engines help identify relationships between events, pointing engineers toward the actual cause rather than a symptom.
Pro Tip: Review your alert volume weekly. If your team is acknowledging more than 20% of alerts without taking action, that is a direct indicator that your alerting thresholds or suppression logic need reconfiguration.
One often-overlooked practice is meta-monitoring, which means monitoring your monitoring system itself. If your monitoring platform goes offline, becomes unreachable, or stops collecting data, you may not know until an incident exposes the gap. Building checks that confirm your monitoring infrastructure is collecting and alerting as expected is a basic reliability requirement.
Good alerting also connects directly to ticket management. When alerts automatically create tickets with full context, assignee routing, and runbook links, your team spends less time triaging and more time resolving. Investing in proactive alert strategies alongside real-time alerting best practices gives MSPs a clear framework for building alert policies that scale without generating noise.
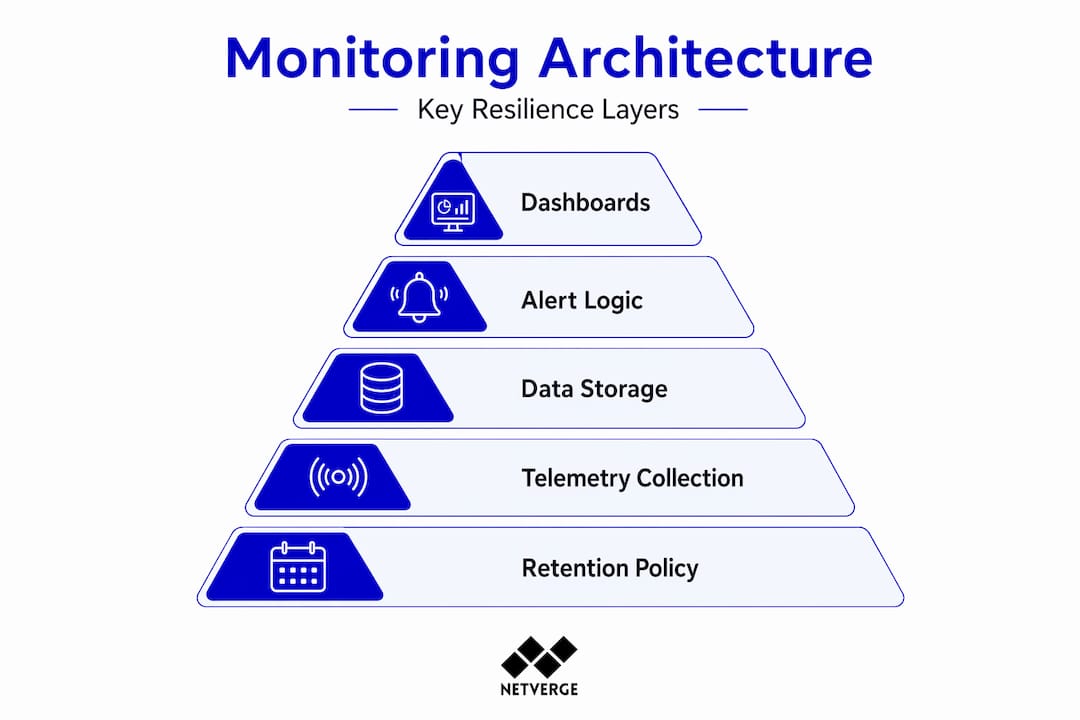
Key components of a resilient monitoring architecture
Alerts and dashboards are the visible layer of infrastructure monitoring. Underneath them is an architecture that must handle data ingestion, storage, querying, and delivery across potentially hundreds of sites. Getting this layer right is what separates a monitoring setup that holds up during incidents from one that creates additional problems under pressure.
Storage and query performance are foundational. When an incident occurs, engineers need to pull historical data quickly to understand the timeline of events. A monitoring system that stores data but cannot retrieve it efficiently adds friction at exactly the wrong moment. Most platforms use time-series databases optimized for high-write, high-query workloads, but the configuration of retention policies and index pruning still requires attention.
Retention policy planning is also part of monitoring architecture, not just a storage decision. Historical telemetry is used for capacity planning and compliance, not just incident response, so retention and query performance are part of the monitoring design from the start. A practical framework:
| Data category | Recommended retention | Primary use |
|---|---|---|
| High-frequency metrics | 30 to 90 days | Incident investigation, trend detection |
| Aggregated summaries | 12 to 24 months | Capacity planning, reporting |
| Security and audit logs | 12 months minimum | Compliance, forensic analysis |
| Configuration change history | Indefinite | Audit readiness, change management |
For MSPs and distributed enterprises, aggregation across locations is another architectural requirement. Monitoring data flowing from 50 branch offices needs to be normalized, deduplicated, and presented through a unified dashboard. Without aggregation, engineers jump between systems to get a full picture, which slows down both troubleshooting and reporting.
Core components of a resilient monitoring architecture include:
- Redundant collectors: No single collection point should be a single point of failure. Deploy collectors in pairs or with failover configurations.
- Unified dashboards: All telemetry from all locations should surface in one interface with filtering and drill-down capability.
- API integrations: Monitoring platforms need to connect to ticketing, ITSM, and communication tools so data flows without manual copying.
- Scalable ingestion: As you add clients or sites, your architecture should handle increased telemetry volume without performance degradation.
Organizations focused on monitoring for MSPs face unique architectural demands, particularly around multi-tenant data isolation and per-client reporting. Understanding common MSP monitoring pitfalls early saves significant rework as you scale.
What most IT leaders get wrong about infrastructure monitoring
The field observation that stands out most clearly is this: the majority of monitoring failures are not technical. They are operational. Teams configure monitoring correctly but then fail to maintain it, tune it, or treat it as a living system.
The most common mistake is over-monitoring everything and under-alerting on what matters. When every metric generates an alert, engineers stop taking alerts seriously. They learn to acknowledge and dismiss. Then a genuine critical event arrives, and the response is slow because the signal is buried in noise. Best practice for MSPs and multi-location enterprises is to instrument broadly but alert selectively: standardize telemetry and tagging, correlate signals, and design alerts around user impact and runbooks to avoid both alert fatigue and missed incidents.
The second major error is inconsistent tagging and telemetry standards across locations. When Site A labels its core router differently from Site B, correlation across sites becomes difficult. When different engineers set different thresholds for the same device type, alert behavior is unpredictable. Standardizing naming conventions, metric labels, and threshold templates across your entire environment is unglamorous work, but it is what makes monitoring actually reliable at scale.
The third error, which connects back to the meta-monitoring discussion, is assuming the monitoring system itself is infallible. Most teams treat monitoring infrastructure as a one-time deployment. They set it up, confirm it works, and move on. But monitoring platforms can drift, agents can stop reporting, collectors can lose connectivity, and nobody notices until an outage reveals the gap. Building explicit checks for your monitoring system's own health is non-negotiable for serious operations.
One more hard truth: documentation and monitoring need to stay synchronized. When network changes are made without updating monitoring configurations, you end up with alerts firing for decommissioned equipment and no coverage for newly deployed devices. Reviewing your network monitoring strategies regularly, especially after infrastructure changes, keeps your monitoring aligned with your actual environment.
Advance your infrastructure monitoring with Netverge
The practices outlined above, from real-time telemetry collection to smart alerting and resilient architecture, are exactly what Netverge was built to support. Netverge unifies monitoring, observability, documentation, and automated response into a single AI-powered platform designed specifically for MSPs and multi-location enterprises. You get full visibility from day one without stitching together multiple tools.
Netverge's AI-powered monitoring solutions deliver real-time anomaly detection, intelligent alert correlation, and automated ticket creation. The Vergepoints hardware provides plug-and-play physical visibility at every site with zero-touch deployment. Combined with purpose-built event management tools, your team moves from alert to resolution faster, with the full context needed to diagnose root causes and prevent recurrence. Start your free trial today and see unified infrastructure monitoring in action.
Frequently asked questions
What's the difference between infrastructure monitoring and observability?
Monitoring and observability are related but not identical: monitoring detects known issues using thresholds and anomaly rules, while observability gives teams the tools to diagnose unknown or complex failures across distributed systems.
How does real-time infrastructure monitoring help reduce downtime?
Real-time monitoring uses streaming telemetry to capture events like interface failures and congestion with minimal delay, enabling engineers to respond before degradation reaches end users rather than after complaints arrive.
Why is meta-monitoring important for IT teams?
Meta-monitoring ensures your monitoring system is reliably collecting and alerting as expected, so a silent failure in your monitoring infrastructure does not create a blind spot during a real incident.
How long should telemetry data be stored?
Historical telemetry supports capacity planning and compliance reporting, so retention should align with both your operational review cycles and any regulatory requirements, typically a minimum of 12 months for aggregated data and longer for audit logs.