
The fastest way to reduce MTTR is to shrink detection and investigation time, not just repair time. NIST incident-response guidance and Google Cloud's six-strategy framework both point to the same root cause: most downtime minutes are lost before anyone touches a fix. Symptom-based alerts, ownership metadata, executable runbooks, and targeted automation are the four levers that move the needle fastest.
Start here before anything else:
- Tune alerts to fire on symptoms (latency spike, error rate threshold) rather than raw resource metrics.
- Route every alert to a named owner with on-call context attached.
- Link a one-click runbook to each alert so the responder skips the "what do I do first?" delay.
- Automate the top three most frequent fixes (service restart, cache flush, failover trigger).
- Track MTTA separately from MTTR so you can see whether the bottleneck is acknowledgment or repair.
- Run a blameless postmortem after every P1 and P2 incident.
If you can only change one thing this week, tune your alerts. PagerDuty's research shows that cutting alert noise and shortening mean time to acknowledge (MTTA) are the fastest wins for reducing overall MTTR.
Key Takeaways
Cutting detection and investigation time, not just repair time, is the highest-leverage action to reduce MTTR and move below the industry average of 47 minutes.
| Point | Details |
|---|---|
| Tune alerts first | Switch to symptom-based alerts and cut noise; MTTA drops within two weeks of ownership routing. |
| Attach runbooks to alerts | Executable, versioned runbooks eliminate the "what do I do first?" delay that inflates investigation time. |
| Automate investigation before deployment | Automate diagnostics and deliver fixes as ready-to-merge PRs; guarded deployment reduces risk while compressing repair time. |
| Measure phases separately | Track MTTD, MTTA, and MTTR by severity; a flat average hides where the actual bottleneck sits. |
| Use Netverge for unified visibility | Netverge's AI triage, knowledge graph, and Vergepoints consolidate telemetry and context so responders act faster at every phase. |
Table of Contents
- What MTTR actually measures and how to calculate it
- Why MTTR directly affects your business outcomes
- Proven strategies that directly reduce MTTR
- Tool categories and platform capabilities that speed repair
- A practical 90-day plan to lower your MTTR
- How Netverge maps to these MTTR reduction tactics
- Where most teams go wrong when trying to reduce MTTR
- Netverge gives your team a faster path to lower MTTR
- Sources
What MTTR actually measures and how to calculate it
The DAU glossary definition is precise: MTTR (mean time to repair) measures the average time required to restore a failed component or system to full operation, starting from the moment the failure is detected and ending when the system is verified as recovered. Not when the ticket is closed. Not when the engineer says "looks good." When the system passes a recovery verification check.
The formula, per ITOC360, is:
MTTR = Total downtime ÷ Number of incidents
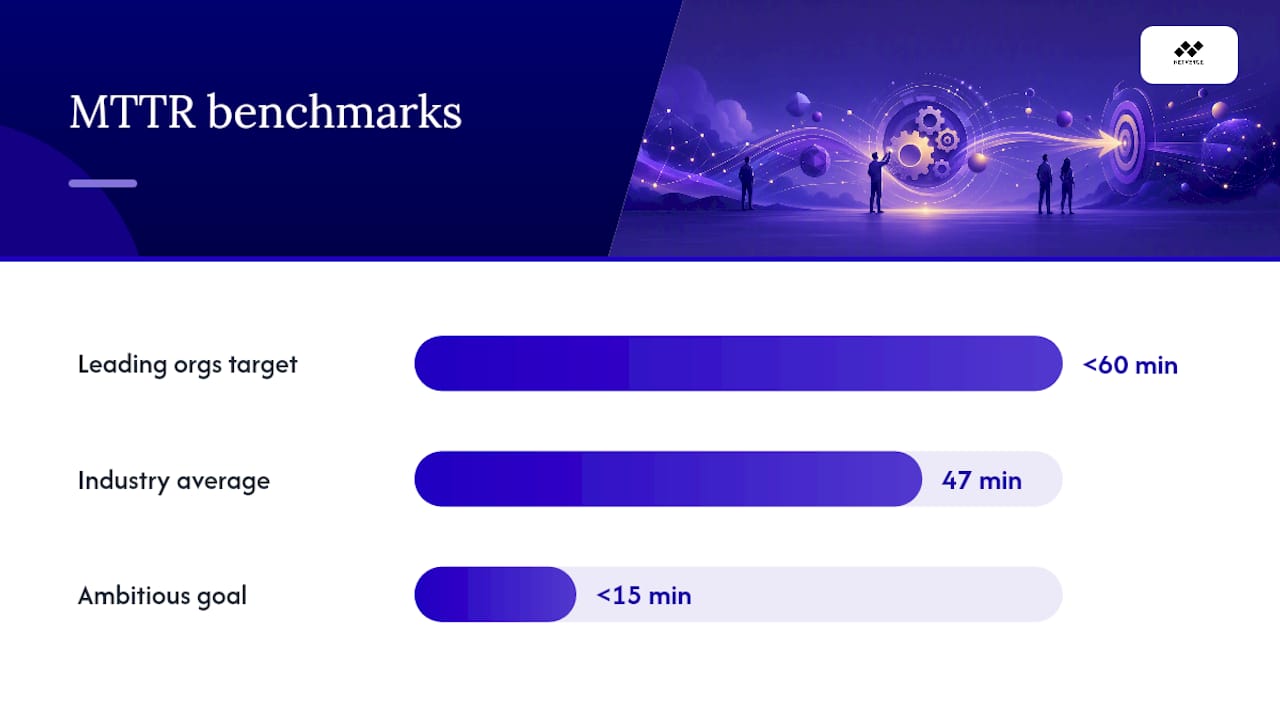
A concrete example: if your team logged 6 incidents last month with a combined downtime of 282 minutes, your MTTR is 47 minutes. That 47-minute figure is also the industry average reported by Nova AI Ops for 2026, with best-performing teams under 15 minutes and AI-native platforms reaching single-digit minutes in some scenarios.
Two measurement decisions matter more than the formula itself. First, decide where the clock starts: detection time (when monitoring fires) is more accurate than reported time (when a user calls the helpdesk), because the gap between them is dead time you should be measuring and eliminating. Second, never stop the clock at "fix deployed." Stop it at verification, meaning a synthetic check or health probe confirms the service is responding correctly.
MTTR vs. MTTD vs. MTTA: which metric to track
| Metric | What it measures | When to prioritize it |
|---|---|---|
| MTTR | Total repair time from detection to verified recovery | Always — it's the primary availability metric |
| MTTD | Time from incident start to first detection | When alert coverage gaps are suspected |
| MTTA | Time from detection to first acknowledgment | When on-call response lag is the bottleneck |
Tracking all three together reveals where time is actually lost. A high MTTD points to monitoring gaps. A high MTTA points to on-call process or escalation problems. A high MTTR with low MTTD and MTTA means the investigation and repair phases need work.
Practical measurement tips: Segment MTTR by severity (P1 vs. P2 vs. P3) and by service, because averaging across all incidents hides the outliers that matter most. Track the 90th percentile (p90) alongside the mean, since a few long incidents can mask a healthy median. Automate MTTR calculation inside your incident management system rather than pulling it from spreadsheets.
Why MTTR directly affects your business outcomes
Every minute of unplanned downtime carries a cost that compounds across revenue, SLA exposure, and team health. Datadog's operational guidance frames lower MTTR as a direct indicator of operational efficiency, not just a reliability metric.
The business impacts are concrete:
- Revenue risk: For e-commerce or SaaS platforms, even a 15-minute outage during peak hours translates to measurable transaction loss.
- SLA exposure: Most enterprise SLAs define uptime at 99.9% or higher. A single 47-minute incident can consume a month's entire downtime budget.
- Customer churn: Repeated incidents with slow resolution erode trust faster than a single long outage, because customers track patterns.
- On-call fatigue: Engineers who spend hours investigating incidents they've seen before burn out. High MTTR is a retention risk, not just a reliability risk.
Google Cloud notes that leading organizations target sub-60-minute MTTR for critical systems. Teams already at 47 minutes are at the industry average. Getting below 15 minutes requires deliberate process changes, not just better tools.
A quick cost translation: if your average incident costs $5,000 in lost productivity and revenue, and you handle 10 incidents per month, shaving 20 minutes off your average MTTR saves roughly 200 engineer-minutes per month. At scale, that compounds into fewer escalations, fewer SLA credits, and engineers who spend more time building than firefighting.
Proven strategies that directly reduce MTTR
Effective MTTR reduction follows the incident lifecycle: detection, acknowledgment, investigation, repair, verification, and post-incident review. Fixing only one phase rarely moves the overall number.
Detection: symptom-based alerts
Alert on what users experience, not what servers report. A CPU alert at 85% is noise. An alert that fires when p95 latency exceeds 500ms for 3 consecutive minutes is a symptom. Symptom-based alerts reduce false positives and give responders immediate context about user impact. Pair alert deduplication and correlation so that a single underlying failure doesn't generate 40 separate pages.
Acknowledgment: cut MTTA with clear ownership
Every service needs a named owner in your on-call rotation, and every alert needs to route to that owner automatically. MTTA bloat happens when alerts land in a shared queue and responders wait for someone else to pick it up. Assign ownership at the service level, not the team level, and enforce it in your real-time alerting process.
Investigation: parallelize and enrich
HealOps identifies handoff cost and sequential investigation as the largest contributors to MTTR. The fix is parallel hypothesis testing: two engineers investigate different failure hypotheses simultaneously rather than one engineer ruling out causes in sequence. Consolidate telemetry so responders see metrics, logs, traces, and recent deploys in one view. Reducing tool-switching cuts cognitive overhead and, per Nova AI Ops reporting, saves compounding minutes per incident.
Repair: runbooks as executable playbooks
A runbook attached to an alert is worth more than a runbook in a wiki. Here is a minimal runbook template:
Runbook: Service X High Latency
- Who: On-call backend engineer
- What: Latency p95 > 500ms for 3+ minutes
- Diagnosis commands:
kubectl top pods -n service-x, check recent deploys in CI/CD dashboard - Fix options: Scale deployment (
kubectl scale deployment service-x --replicas=6), roll back last deploy if latency started within 10 minutes of deploy - Rollback:
kubectl rollout undo deployment/service-x - Verification: Confirm p95 latency returns below 200ms on the monitoring dashboard
Version runbooks alongside code in Git so they stay current with the service they describe.
Pro Tip: Automate investigation and fix delivery before you automate deployment. HealOps recommends delivering fixes as ready-to-merge pull requests rather than auto-deploying, because guarded deployment preserves human review while still collapsing resolution time.
Redundancy and failover: route around failure
AWS recommends routing around failures by shifting load to spare subsystems rather than waiting for a failed component to be repaired. Redundancy doesn't eliminate MTTR, but it converts a hard outage into a degraded-mode event while repair happens in the background.
Post-incident review: close the loop
A blameless postmortem that produces closed action items is the only mechanism that prevents the same incident from recurring. Track action-item closure rate as a KPI. An open action item from a postmortem is a future incident waiting to happen.
Tool categories and platform capabilities that speed repair
Buying more tools rarely reduces MTTR. Buying the right capabilities, integrated into a single workflow, does. The table below maps capability categories to the MTTR phase they shorten and the minimum acceptance criteria for each.
| Capability | MTTR phase shortened | Minimum acceptance criteria |
|---|---|---|
| Unified observability (metrics, logs, traces, synthetics) | Detection, investigation | Single pane across all telemetry sources; no manual correlation |
| Alert correlation and deduplication | Detection, acknowledgment | Groups related alerts into one incident; suppresses flapping |
| Incident management and escalation | Acknowledgment | Auto-routes to service owner; tracks MTTA and MTTR automatically |
| Runbook automation / SOAR | Investigation, repair | Executes runbook steps on trigger; logs every action for audit |
| Automated diagnostics | Investigation | Surfaces probable cause with supporting evidence, not just raw data |
| Knowledge base and change awareness | Investigation | Links alert to past incidents, runbooks, and recent deploy history |
| Multi-tenant management | All phases (MSPs) | Isolates tenant data; supports role-based access per customer |
When evaluating platforms, check these criteria before anything else:
- Integration surface: Does it pull telemetry from your existing stack (cloud providers, network hardware, application APM) without custom connectors?
- Context enrichment: Does each alert arrive with service owner, recent deploys, related past incidents, and runbook links already attached?
- Automation guardrails: Can you set approval gates on automated actions so a runbook executes diagnostics automatically but waits for human sign-off before deploying a fix?
- Telemetry depth: Does it cover network-layer visibility (packet loss, interface errors, BGP state) in addition to application and infrastructure metrics?
Netverge addresses these criteria directly. Its AI-powered monitoring platform unifies infrastructure telemetry, anomaly detection, and automated troubleshooting into one interface. Vergepoints provide on-site physical visibility at distributed locations, and the platform's knowledge graph links alerts to topology, documentation, and historical incidents. For MSPs managing multiple tenants, Netverge's multi-tenant architecture supports role-based access and isolated customer views without switching tools.
A practical 90-day plan to lower your MTTR
This roadmap gives your team measurable milestones and clear owners. Adapt the timelines to your team size, but keep the sequence: baseline before you tune, tune before you automate.
Days 1–30: baseline and quick wins
- Calculate current MTTR by severity (P1, P2, P3) using the formula: total downtime ÷ incident count.
- Identify the top five most frequent incident types from the past 90 days.
- Audit alert coverage: find services with no symptom-based alerts and add them.
- Assign named on-call owners to every production service.
- Attach a basic runbook to the top five incident types, even if it's just a checklist.
Expected outcome: Baseline MTTR documented; MTTA drops within two weeks as ownership routing takes effect.
Days 31–60: runbook codification and automation
- Move all runbooks into version control alongside their services.
- Automate the top three most frequent fixes (service restart, cache clear, failover trigger) with approval gates.
- Implement alert deduplication and correlation to reduce noise by at least 30%.
- Set up a weekly MTTR review with the on-call team to identify recurring patterns.
- Run blameless postmortems for every P1 and P2 incident; track action items in your incident system.
Expected outcome: MTTR for the top five incident types drops measurably; on-call fatigue decreases as noise falls.
Days 61–90: dashboards, reporting, and continuous improvement
- Build a live MTTR dashboard segmented by severity and service, visible to engineering leadership.
- Track p90 MTTR alongside the mean to surface outlier incidents.
- Report MTTA, MTTR, incident frequency, and automation resolution rate to stakeholders monthly.
- Close all open postmortem action items from the previous 60 days.
- Set a target MTTR for the next quarter based on your baseline and the industry benchmark of 47 minutes as a reference point.
Expected outcome: Stakeholders see measurable improvement; the team has a repeatable process for continuous reduction.
KPIs to track weekly: MTTR by severity, MTTA, incident frequency, percentage of incidents resolved by automation, and postmortem action-item closure rate. For MSPs, also track per-tenant MTTR to identify customers with systemic issues. NIST's structured incident-response framework recommends defining these metrics before you begin improvement efforts, so your baseline is defensible.
How Netverge maps to these MTTR reduction tactics
Netverge is built around the same lifecycle phases the 90-day plan targets. Here is how its capabilities map to each tactic:
- AI triage: Netverge's autonomous AI agents analyze incoming alerts, correlate telemetry across the network, and surface a probable cause with supporting context before the on-call engineer opens the ticket. This directly compresses investigation time. See how AI triage shortens outage response for a detailed breakdown.
- Unified observability: The platform aggregates metrics, logs, and network telemetry from 28+ sensor types into a single dashboard, eliminating the tool-switching that adds minutes to every investigation.
- Runbook automation: Netverge links runbooks to alerts inside the platform and can execute diagnostic steps automatically, delivering results to the responder without manual CLI work.
- Vergepoints: Physical edge hardware deployed at remote or branch locations provides on-site network visibility that cloud-only monitoring misses. For multi-location enterprises and MSPs, this closes the gap between "the monitoring says it's fine" and what's actually happening on the wire.
- Knowledge graph: The platform's knowledge graph connects alerts to network topology, past incidents, and documentation, so responders get historical context without searching across multiple systems.
When integrating Netverge, connect your primary data sources first: network devices, cloud infrastructure, and application endpoints. Assign role-based access so on-call engineers see their scope and team leads see the full tenant view. Set automation guardrails on any remediation actions before enabling them, so the system diagnoses and enriches automatically but waits for human approval before executing fixes. For a step-by-step integration approach, the network incident response guide covers role assignments and escalation policy setup in detail.
Where most teams go wrong when trying to reduce MTTR
Most teams focus on repair code first. They optimize the fix, the rollback script, the deployment pipeline. Those improvements matter, but they're often the smallest contributor to total MTTR. The bigger losses are in investigation time and handoff cost, and those are process problems, not tool problems.
The most common mistakes, and what to do instead:
Keeping knowledge in heads. When only one engineer knows how to diagnose a specific service, every incident involving that service waits for that person. The fix is enforced runbook ownership: no service goes to production without a runbook, and runbooks are reviewed in every postmortem. If a responder had to ask a colleague for a command during an incident, that command goes into the runbook before the postmortem closes.
Over-automating without tests. Auto-remediation that hasn't been tested in a staging environment will eventually make an incident worse. Automate investigation first (log collection, metric snapshots, dependency checks), then automate fix delivery as a ready-to-merge PR, then consider guarded auto-deploy only for the most stable, well-understood fixes.
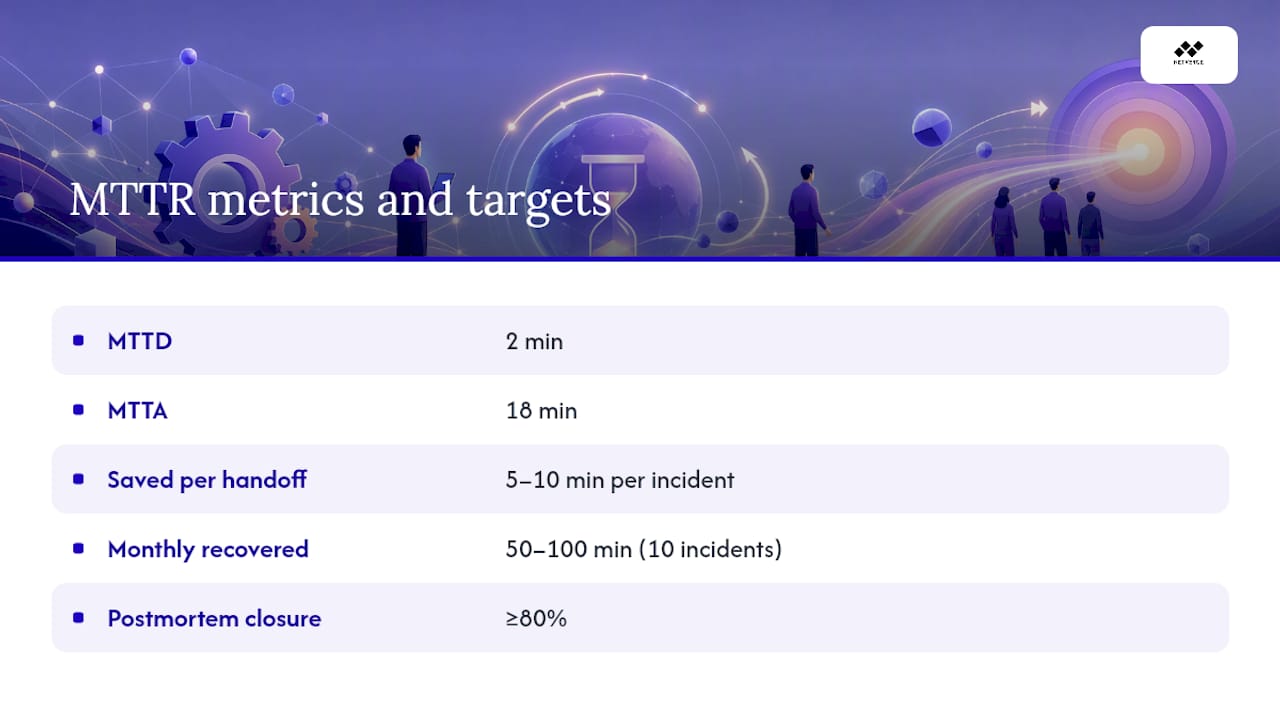
Measuring total MTTR without phase breakdown. A flat MTTR number tells you nothing about where to improve. If your MTTD is 2 minutes but your MTTA is 18 minutes, the problem is on-call routing, not monitoring. Measure each phase separately and fix the biggest one first.
Skipping postmortem action items. A postmortem that produces a list nobody closes is theater. Track action-item closure rate as a first-class KPI. If your closure rate is below 80%, your postmortem process is generating debt, not improvement.
Small process changes compound quickly. Cutting one unnecessary handoff saves 5–10 minutes per incident. Across 10 incidents per month, that's 50–100 minutes recovered without touching a single line of code.
Netverge gives your team a faster path to lower MTTR
If your team is working through the 90-day plan above, Netverge accelerates every phase. Its AI-powered platform unifies network telemetry, automates triage, and links runbooks to alerts, so responders arrive at an incident with context already assembled rather than spending the first 20 minutes gathering it. Vergepoints extend visibility to physical locations that cloud monitoring can't reach, which matters for MSPs and multi-site enterprises where branch-level issues are often the hardest to diagnose quickly.

Deployment is straightforward: connect your network devices and cloud infrastructure, configure role-based access for your on-call teams, and set guardrails on automated actions before enabling them. Most teams see alert noise reduction and faster triage within the first two weeks. To see how Netverge maps to your specific environment, explore the monitoring platform or request a demo to walk through a live incident scenario with your own data sources.
Sources
The sources below back the tactics in this guide and are worth bookmarking for your team:
- NIST.CSWP.29
- DAU glossary: Mean time repair
- Reducing MTTR - Availability and Beyond
- How to Reduce MTTR
- How to Reduce MTTR - 2026 Guide | PagerDuty
- How to Reduce MTTR: A Practical Guide for SRE Teams | Nova AI Ops Blog
- How to Reduce MTTR: A Practical Guide for SRE Teams | HealOps
- MTTR (Mean Time to Resolve): How to Calculate, Benchmark, and Improve It - ITOC360