
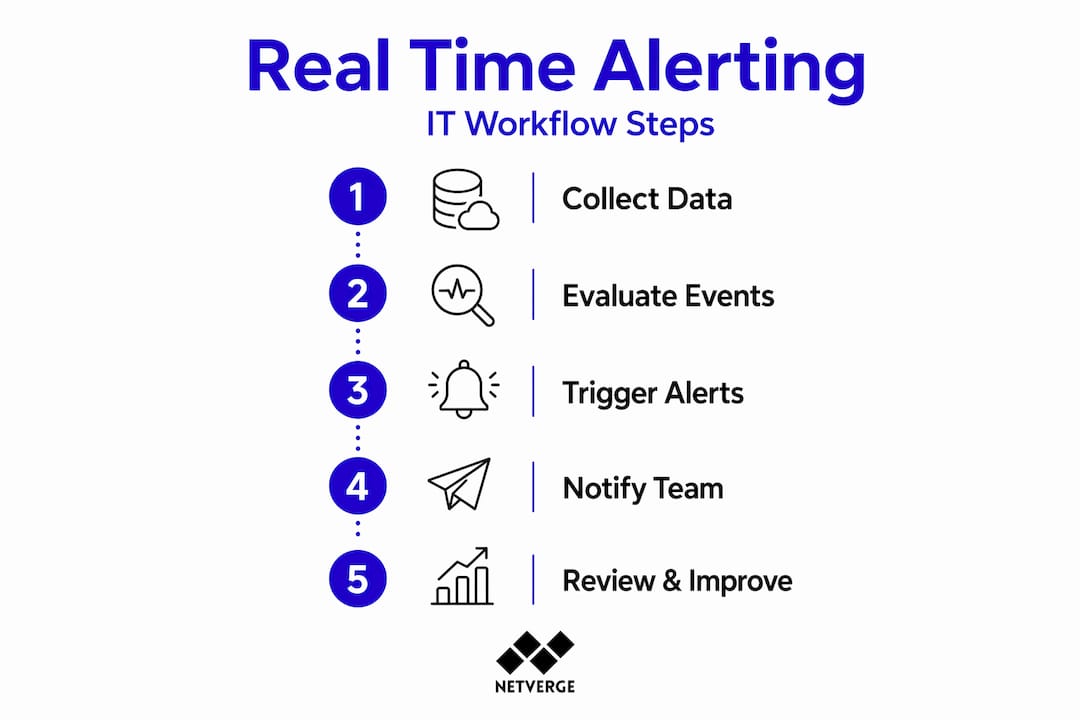
Every network administrator knows the scenario: a flood of alerts hits your inbox at 2 a.m., most of them duplicates or transient spikes that resolve on their own. By the time your team identifies the one signal that actually matters, the incident has already compounded. A disciplined real time alerting process eliminates that gap between detection and action. This guide covers the infrastructure prerequisites, threshold design principles, implementation patterns, and continuous improvement practices you need to build an alerting system your team can actually trust.
Table of Contents
- Key takeaways
- Prerequisites for a real time alerting process
- Designing thresholds that reduce noise
- Implementing real time alerting with streaming and automation
- Validating and improving your alerting process
- My take on building an alerting process that earns trust
- How Netverge handles real time alerting for MSPs
- FAQ
Key takeaways
| Point | Details |
|---|---|
| Start with the right data sources | Effective alerting depends on telemetry coverage across logs, metrics, and streaming events before any threshold is configured. |
| Use sustained conditions, not point-in-time checks | Rate-based and pending-period thresholds significantly reduce false positives and prevent alert storms. |
| Automate delivery and routing | Connect your live alert mechanism to channels like Slack, PagerDuty, or webhooks to remove manual handoffs from incident workflows. |
| Validate with quantitative metrics | Track firing frequency, false positive rate, and remediation time to identify which alerts add signal and which add noise. |
| Iterate continuously with your team | Alerting is an engineering discipline, not a one-time configuration. Regular reviews with on-call staff keep alert quality high. |
Prerequisites for a real time alerting process
Before writing a single alert rule, you need the right data flowing into the right place. Skipping this step is the fastest way to build an alerting system that fires on incomplete information.
Data sources and metric types
The three pillars of monitoring telemetry are metrics, logs, and traces. Metrics give you numeric time-series data such as CPU utilization, bandwidth consumption, and packet loss. Logs provide event-level context. Traces show request paths across distributed systems. Your real-time monitoring solutions need all three to correlate conditions accurately.
Key metric categories every network alerting system should capture:
- Interface metrics: throughput, error rates, discards, and duplex mismatches
- Device health: CPU, memory, temperature, and fan status via SNMP or streaming telemetry
- Application layer: HTTP response codes, latency percentiles, and connection pool saturation
- Security signals: failed authentication attempts, unexpected port scans, and traffic anomalies
Streaming data and event-driven architecture
Batch polling is not sufficient for a real time notification system. You need event-driven ingestion where devices push telemetry rather than waiting to be asked. Protocols like gNMI (gRPC Network Management Interface) and syslog streaming feed data continuously into a processing pipeline.

Pro Tip: Set your telemetry scrape intervals at 10 to 30 seconds for performance metrics and push-based streaming for security events. Polling every 5 minutes will always leave you a step behind a fast-moving incident.
Infrastructure components
| Component | Role | Example Technologies |
|---|---|---|
| Data ingestion layer | Collects telemetry from devices and apps | Kafka, Fluentd, gNMI collectors |
| Storage and cache layer | Holds recent data for fast alert evaluation | Redis, InfluxDB, Prometheus |
| Alert evaluation engine | Applies threshold logic to streaming data | Grafana Alerting, RisingWave, custom SQL |
| Notification dispatcher | Routes alerts to the right team or tool | PagerDuty, Slack webhooks, OpsGenie |
Using a dedicated cache like Redis for alert evaluation significantly reduces database read load and keeps evaluation latency low. Always establish baseline data before going live. Historical analysis tells you what "normal" looks like, which is the only way to write thresholds that mean something.
Designing thresholds that reduce noise
Most alerting systems fail at the design stage, not the implementation stage. The rules are either too sensitive, firing on every transient spike, or too loose, missing real incidents until they become outages. Getting this right is a deliberate engineering process.
Absolute vs. rate-based thresholds
An absolute threshold fires when a metric crosses a fixed boundary. CPU above 90% is a classic example. Rate-based thresholds fire when the rate of change crosses a boundary. For example, bandwidth increasing by 40% in 60 seconds is more informative than raw throughput in isolation. Threshold design with rate-based conditions reduces false positives and builds operator trust in the system over time.
Steps to design a meaningful alert
- Identify the symptom, not the cause. Alert on user-visible degradation first. High CPU is interesting; elevated HTTP 500 rates are urgent.
- Set a sustained evaluation window. Require the condition to persist for a defined period before firing. A one-minute CPU spike should not page anyone. Pending periods by severity range from 1 minute for critical alerts to 60 minutes for informational ones.
- Combine multiple conditions. Require CPU above 85% AND request error rate above 5% simultaneously. Single-signal alerts generate the most noise.
- Classify severity. Use a consistent schema: P1 for immediate action, P2 for urgent investigation within 30 minutes, P3 for next business day.
- Assign a routing policy. P1 alerts go directly to on-call via PagerDuty. P3 alerts create a ticket automatically. Never route all severities the same way.
Alert grouping and contextual content
Grouping related alerts reduces incident response noise by a factor of 10:1. Instead of 40 separate pings for a switch failure affecting multiple downstream hosts, you receive one contextual alert describing the root device and its downstream impact.
Beyond grouping, the content of each alert notification matters. Including runbook URLs and diagnostic context directly in the notification decreases mean time to identify issues. Your runbook should state: what triggered the alert, what the normal baseline is, the first three investigation steps, and the escalation path.
| Alert content element | Impact on response |
|---|---|
| Alert name and severity | Lets responders triage without opening a console |
| Affected resource identifier | Points directly to the device or service |
| Current vs. baseline value | Quantifies the deviation immediately |
| Runbook URL | Removes ambiguity from the investigation process |
| Silence / acknowledge link | Reduces friction during active incident response |
Pro Tip: Treat your runbooks as living documents. Link them directly from alerts and review them after every significant incident. A runbook that describes a process your team no longer follows is worse than no runbook at all.
Implementing real time alerting with streaming and automation
Once your infrastructure and thresholds are designed, implementation is about minimizing latency and removing manual steps from the alert-to-response pipeline.
Streaming SQL for detection
Traditional monitoring evaluates alert conditions on stored data, introducing a delay between event and detection. Streaming SQL reduces detection latency from minutes to milliseconds by evaluating conditions incrementally on live data using materialized views. Platforms like RisingWave allow you to write declarative SQL queries that continuously monitor event streams. For example:
"``sql SELECT device_id, AVG(cpu_utilization) AS avg_cpu FROM telemetry_stream GROUP BY device_id, TUMBLE(event_time, INTERVAL '1' MINUTE) HAVING AVG(cpu_utilization) > 85;
This query evaluates every incoming telemetry record, not a periodic snapshot, delivering sub-second alert detection on continuous data flows. Production systems commonly achieve [end-to-end alert latency of 5 to 30 seconds](https://www.symestic.com/en-us/what-is/rtdm), which is well within the range required for meaningful operational decisions.
### Architecture patterns that reduce latency
A well-designed instant alert framework uses the following layers:
- **Asynchronous ingestion queues** (Apache Kafka) to absorb telemetry bursts without blocking evaluation
- **In-memory caches** (Redis) to hold recent metric windows for threshold comparisons without repeated database reads
- **Event gating and broadcast filters** to suppress redundant events before they reach the notification dispatcher. Broadcast gate filtering can reduce queue load by approximately 80%
- **Throttling logic** to prevent alert storms when a configuration change or infrastructure failure triggers hundreds of conditions simultaneously
### Automating alert delivery
Your automated alert notifications pipeline should route based on severity and affected system, not manually maintained distribution lists. Standard integration points include:
1. **Slack or Microsoft Teams** for P2 and P3 alerts where real-time chat context speeds up collaborative diagnosis
2. **PagerDuty or OpsGenie** for P1 alerts requiring on-call escalation with acknowledgment tracking
3. **Webhook endpoints** for custom integrations with ticketing systems, runbook automation tools, or internal dashboards
4. **Ticketing system auto-creation** for lower-severity issues that do not require immediate human response
**Pro Tip:** *Implement a "no alert without an owner" rule. Every alert rule in your system should have a named team or individual responsible for its configuration and review. Orphaned alert rules are the leading cause of alert fatigue.*
## Validating and improving your alerting process
Deploying alerts is not the end. The real work begins when you start measuring whether your alerting system is performing as intended.
### Metrics that reveal alert quality
Track these four numbers on a weekly cadence:
- **Alert firing frequency per rule:** Rules that fire more than 10 times per day for a persistent condition suggest thresholds are set too low.
- **False positive rate:** The percentage of fired alerts that required no action. Target below 5% for P1 alerts.
- **Acknowledgment time:** How long between alert firing and a responder acknowledging it. Spikes here indicate routing or fatigue problems.
- **Mean time to remediate (MTTR):** Measure from alert fire time, not from when the ticket was opened. That distinction alone will reveal gaps.
### Identifying and retiring poor-performing alerts
Identify two alert anti-patterns in your catalog: rules that never fire and rules that always fire. Never-firing rules may indicate the condition they protect against cannot actually occur in your environment, or that the threshold is set so high it is effectively useless. Always-firing rules are the primary driver of alert fatigue and [eroded on-call trust](https://netverge.com/blog/why-alert-fatigue-is-killing-your-msp-margins).
Run a quarterly audit of every alert rule. Export firing counts, action rates, and false positive logs. Any rule with an action rate below 10% over 90 days should be revised or retired.
### Using AI for correlation and root cause analysis
[AI-first alerting systems correlate logs, metrics, deployments, and historical incidents](https://uat.apnews.com/press-release/pr-newswire/incident-io-launches-pagerduty-rescue-program-2226e389a496b2684438b000681af342) to immediately surface probable root causes. Instead of presenting your on-call engineer with 30 correlated alerts, an AI-powered system presents one incident with the probable cause already identified. The role of [AI in alert triage](https://netverge.com/blog/netverge-how-ai-triage-is-revolutionizing-network-outages) is moving from optional to expected in mature network operations.
**Pro Tip:** *Build a feedback loop into your on-call process. After each incident, ask: did the alert fire at the right time? Did it contain enough context? Was the runbook accurate? Log those answers and schedule a monthly review. This is how you convert a noisy alerting system into one your team actually relies on.*
## My take on building an alerting process that earns trust
I've watched teams spend months configuring dashboards and alert rules, only to disable half of them within six weeks because the noise was unbearable. Here's what I've learned: the biggest mistake is treating threshold configuration as a one-time setup task.
In my experience, the teams with the best alerting systems treat it the same way they treat code: version-controlled, peer-reviewed, and refactored regularly. Every threshold has a documented rationale. Every runbook is tested quarterly. When a new engineer joins the on-call rotation, they can read the alert definition and understand exactly why it exists.
I've also seen the over-alerting problem get significantly worse when teams add more tools without a correlation layer. You end up with three platforms all firing independently on the same network event, tripling your alert volume with zero additional signal. Automated root cause correlation is not a luxury at that point. It's a necessity.
Start small. Pick your five most critical service dependencies, instrument them properly, and build tight alert rules for those first. Get the false positive rate below 5% on that subset before expanding. That discipline early on sets the standard for everything that follows. Alert fatigue is not a technology problem. It's a process problem, and the process fix starts with how you design and govern your first rules.
> *— Jim*
## How Netverge handles real time alerting for MSPs
Netverge brings together the infrastructure, intelligence, and automation your team needs to run a high-quality real time alerting process without stitching together five separate tools. The platform delivers [AI-powered network monitoring](https://netverge.com/monitoring) with built-in anomaly detection, alert correlation, and automated triage, so your on-call team sees incidents, not noise.
Netverge integrates natively with Slack, PagerDuty, and webhook-based workflows, meaning your live alert mechanism connects directly to the tools your team already uses. Alerts include contextual telemetry and AI-generated probable cause summaries out of the box. For teams managing multiple client environments, [Netverge's ticketing system](https://netverge.com/ticketing) auto-generates and routes incidents from alerts, closing the loop between detection and resolution without manual steps. If you want to see how the platform fits your environment, explore the monitoring capabilities or request a demo directly from the Netverge team.
## FAQ
### What is a real time alerting process?
A real time alerting process is the end-to-end workflow that collects telemetry, evaluates it against predefined thresholds or conditions, and delivers notifications to the right responders with minimal latency. It includes data ingestion, threshold logic, severity routing, and delivery automation.
### How does real time alerting work technically?
Streaming data from network devices flows into an evaluation engine that applies threshold conditions continuously. When a condition is met and sustained for a defined period, the system generates and dispatches an alert via the configured notification channel, typically in 5 to 30 seconds end to end.
### What is the best way to reduce alert noise?
Use rate-based thresholds with sustained evaluation windows, group related alerts into single contextual notifications, and implement throttling to suppress redundant signals. Alert grouping alone can reduce alert volume by a factor of 10:1.
### How often should alert thresholds be reviewed?
Review alert thresholds at minimum quarterly. Track firing frequency, false positive rate, and action rate for every rule. Retire or revise any rule with an action rate below 10% over a 90-day period to keep your alerting catalog accurate and trusted.
### What should every alert notification include?
Every alert should include the alert name, severity level, affected resource identifier, current metric value versus baseline, a direct link to the relevant runbook, and an acknowledge or silence option. Contextual runbook links directly reduce mean time to identify and resolve issues.
## Recommended
- [Real-time network alerts: The MSP guide to smarter monitoring | Netverge](https://netverge.com/blog/real-time-network-alerts-the-msp-guide-to-smarter-monitoring)
- [Types of network alerts for proactive IT management | Netverge](https://netverge.com/blog/types-of-network-alerts-for-proactive-it-management)
- [Real-time network monitoring: A practical guide for IT leaders | Netverge](https://netverge.com/blog/real-time-network-monitoring-guide)
- [Why Alert Fatigue Is Killing Your MSP Margins | Netverge](https://netverge.com/blog/why-alert-fatigue-is-killing-your-msp-margins)