
Network response time is defined as the total elapsed time between a client request and the first byte of a server response, measured in milliseconds across every network hop, queue, and processing layer. Reducing it is not optional for IT professionals managing distributed infrastructure. Every 100ms of latency costs roughly 1% in conversion rate, and a 1-second delay can reduce conversions by 7–20%. That single data point reframes network performance from a technical concern into a direct revenue variable. Understanding why reduce network response times matters starts with recognizing that latency touches every layer of your operation, from user experience to system reliability.
Why reduce network response times: the business case
Slow networks do not just frustrate users. They destroy measurable business outcomes at every level of the funnel.
The conversion impact is well documented. Bounce rates climb from 7% at a 1-second load time to 82% at 5 seconds. That means four extra seconds of latency can cost you more than ten times the visitors who would have stayed. For any team running SaaS applications, e-commerce platforms, or customer portals, this is a direct revenue leak.

The productivity impact is less visible but equally damaging. Intermittent network instability causes silent productivity loss that standard IT alerts rarely capture. Latency spikes during peak hours damage both customer transactions and employee workflows without triggering an obvious outage. Because no alert fires, the degradation continues unchecked for hours or days.
There is also an analytics distortion problem that most teams overlook. Slow connections cause user abandonment before tracking scripts fire, which means GA4 and similar tools underreport top-of-funnel sessions and final conversions. Your data looks cleaner than reality. Decisions made on that data are misinformed.
The key business consequences of high latency include:
- Conversion loss: A 1-second delay reduces conversions by 7–20%, compounding across millions of sessions.
- Mobile abandonment: 53% of mobile users abandon a page that takes more than 3 seconds to load.
- Hidden productivity drain: Unstable network performance erodes operational throughput in ways that are harder to detect than full outages.
- Analytics blind spots: Latency-driven abandonment distorts funnel data, hiding actual conversion leaks from your reporting tools.
Latency is a revenue variable, not a technical metric. Faster infrastructure reduces cost per transaction and increases ROI on every capital investment in your stack.
What architectural factors drive network response times?
Most IT teams treat latency as a network problem. It is actually an architectural property. Latency involves every service boundary, retry policy, and serialization decision in your system, not just the physical network between two points.
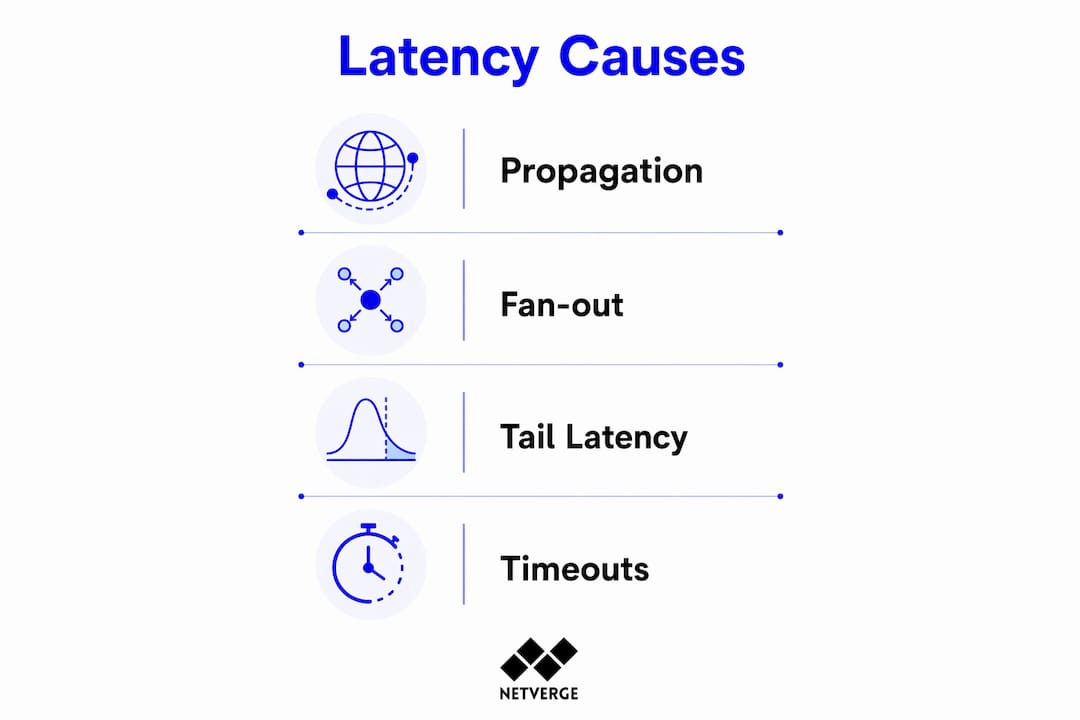
Four distinct delay types combine to produce end-to-end response time: propagation delay (the physical distance light travels through fiber), processing delay (CPU time at each node), queuing delay (time spent waiting in thread pools or message brokers), and serialization delay (time to encode and decode data). Most teams measure only propagation. The other three are where latency budgets actually get consumed.
Fan-out amplification is the most underappreciated architectural risk. Adding a single synchronous hop can push p95 latency from 8ms to 69ms. That jump happens because every additional hop compounds the probability of hitting a slow tail event. Two hops means two chances to land on the slowest 5% of requests simultaneously.
Tail latency is the metric that actually reflects user experience. Connection pool exhaustion can spike p99 latency from milliseconds to seconds, even when backend services are healthy. Median latency looks fine. The slowest 1% of your users are experiencing something completely different.
Timeout waterfalls compound the problem further. Poorly designed retry logic creates cascading delays across dependent services. A single upstream timeout triggers retries at multiple layers, each adding its own queuing delay. Proper deadline propagation, where a timeout set at the edge is enforced through every downstream call, prevents this cascade entirely.
Pro Tip: Map your p50, p95, and p99 latency separately for every service boundary. If your p99 is more than 10x your p50, you have a tail latency problem that average metrics will never surface.
How does latency impact reliability in distributed networks?
Reliability and availability are not the same thing. This distinction is one of the most costly blind spots in distributed systems design.
Availability means a system returns a response, even if that response is an error message. Reliability means a system returns a predictable response within a defined latency bound, even under failure conditions. A system that times out after 30 seconds is technically available. It is not reliable.
The CAP theorem formalizes this trade-off. In a distributed system, you cannot simultaneously guarantee consistency, availability, and partition tolerance. Systems that return stale data during partitions favor graceful degradation over catastrophic failure. That is the correct trade-off. A user who sees cached data from 10 minutes ago has a better experience than a user who sees a 504 error.
Three design patterns directly improve reliability under latency pressure:
- Circuit breakers: Stop sending requests to a failing downstream service after a threshold of errors or timeouts. This prevents latency from one service from cascading into total system failure.
- Backpressure: Signal upstream services to slow their request rate when a downstream service is saturated. This keeps queues from growing unbounded and tail latency from exploding.
- Graceful degradation: Return partial or cached responses when full processing is unavailable. Users get something useful instead of nothing.
"Confusing availability with reliability is a costly architectural blind spot. True reliability demands predictable latency even under failures, not just the absence of error codes. Systems designed only for availability will fail their users precisely when load is highest."
Performance degradation in distributed systems is non-linear. Live-sync conflict rates jump from 15.8% at 80ms latency to 42.1% at 120ms. A 40ms increase more than doubles the conflict rate. This is why latency thresholds matter more than averages.
What practical strategies reduce network response times?
Reducing latency requires a structured approach across architecture, infrastructure, and monitoring. The following sequence works for most distributed environments.
Map every request path and assign latency budgets. Identify all synchronous service calls in a critical user flow. Assign a maximum latency budget to each hop. If the sum exceeds your end-to-end target, you have found where to cut. This is the foundation of any network performance optimization effort.
Eliminate unnecessary synchronous hops. Convert synchronous calls to asynchronous where the caller does not need an immediate response. Batch requests where possible. Each hop you remove reduces both average latency and tail latency non-linearly.
Switch to efficient transport protocols. gRPC over HTTP/2 reduces serialization overhead and supports multiplexing, which eliminates head-of-line blocking. JSON over REST is readable but expensive at scale. Protocol Buffers with gRPC can reduce payload size and parsing time significantly.
Implement caching at the right layer. Cache at the edge for static assets, at the application layer for computed results, and at the database layer for frequent queries. Caching the wrong data at the wrong layer adds complexity without reducing latency where users feel it.
Tune connection pools and monitor them continuously. Connection pool exhaustion is the leading cause of p99 spikes. Set pool sizes based on measured concurrency, not defaults. Monitor pool wait time as a separate metric from query execution time.
Track tail latency and set alerts on p95 and p99. Median latency metrics hide the worst user experiences. Alerting on p99 gives you early warning before a latency problem becomes a reliability incident.
Pro Tip: Use backend architecture patterns like the Strangler Fig or Sidecar to isolate latency-sensitive services from high-throughput batch workloads. Mixing them on shared infrastructure is a common source of unexpected tail latency spikes.
The table below compares three infrastructure approaches by their effect on key latency metrics:
| Approach | Effect on p50 latency | Effect on p99 latency |
|---|---|---|
| Synchronous REST over HTTP/1.1 | Baseline | High, due to head-of-line blocking |
| gRPC over HTTP/2 with connection reuse | Moderate reduction | Significant reduction |
| Async messaging with caching layer | Low for cached paths | Lowest, decouples request spikes |
For teams managing multi-location network infrastructure, continuous telemetry across all service boundaries is the only way to catch latency regressions before they affect users.
Key Takeaways
Reducing network response times is the single most direct way to protect revenue, reliability, and operational efficiency in distributed systems.
| Point | Details |
|---|---|
| Latency is a revenue variable | A 1-second delay reduces conversions by 7–20%, making response time a financial metric, not just a technical one. |
| Tail latency defines user experience | Median metrics hide p99 spikes; monitor p95 and p99 separately to catch real performance degradation. |
| Architectural decisions drive latency | Every synchronous hop, retry policy, and serialization format contributes to end-to-end response time. |
| Reliability requires predictable latency | Circuit breakers, backpressure, and graceful degradation protect systems when latency spikes under load. |
| Continuous monitoring closes the gap | Real-time telemetry across all service boundaries is the only way to detect and fix latency regressions proactively. |
The latency problem most leaders still get wrong
After years of working with distributed infrastructure, the pattern I see most often is this: teams treat latency as a network team problem. The network team checks the pipes, reports clean ping times, and closes the ticket. Meanwhile, p99 response times are silently destroying user experience and conversion rates at the application layer.
The uncomfortable truth is that most latency problems live in architecture, not hardware. Fan-out amplification, connection pool exhaustion, and timeout waterfalls are code and configuration problems. They require engineers, architects, and product leaders in the same room, not just a network operations center dashboard.
The organizational shift needed is straightforward but rarely made. Latency budgets should be defined at the product level, owned by engineering, and reviewed in the same meetings where revenue metrics are discussed. When a p99 spike correlates with a drop in checkout completions, that connection needs to be visible to business leaders, not buried in a monitoring tool that only the infrastructure team opens.
The teams that get this right treat network visibility as a shared operational metric, not a siloed IT concern. They alert on tail latency, not just outages. They assign latency budgets before shipping new service dependencies, not after a production incident reveals the problem.
The future of distributed infrastructure will only increase the stakes. Ambient computing, edge deployments, and AI workloads all demand lower latency thresholds than traditional web applications. Teams that build latency discipline now will absorb that complexity. Teams that do not will face it as a crisis.
— Jim
How Netverge helps you monitor and reduce network response times
Latency problems are invisible until they are expensive. Netverge gives IT teams and MSPs the visibility to catch them early.

Netverge's AI-powered monitoring platform tracks real-time telemetry across every node in your distributed network, surfaces p95 and p99 latency anomalies automatically, and correlates performance degradation with specific infrastructure events. The platform's autonomous AI agents diagnose issues and trigger remediation workflows without waiting for a human to open a ticket. Vergepoints hardware extends physical observability to every site in your network, giving multi-location enterprises and MSPs end-to-end visibility from a single interface. If you are ready to move from reactive troubleshooting to proactive latency management, Netverge is built for exactly that.
FAQ
What is network response time?
Network response time is the total elapsed time between a client sending a request and receiving the first byte of a server response, measured in milliseconds. It includes propagation, processing, queuing, and serialization delays across every network hop.
Why does reducing latency improve conversion rates?
Every 100ms reduction in latency improves conversion rates by approximately 1%, and a 1-second delay can reduce conversions by 7–20%. Faster response times keep users engaged before they abandon a page or transaction.
What causes high tail latency in distributed systems?
Tail latency most often comes from connection pool exhaustion, queuing delays in thread pools or message brokers, and fan-out amplification from synchronous service calls. These factors are invisible to median latency metrics but dominate the p99 experience.
How is reliability different from availability in a network context?
Availability means a system returns any response, including errors. Reliability means a system returns a predictable response within a defined latency bound, even under failure conditions. Circuit breakers and graceful degradation are the primary tools for achieving true reliability.
How can IT teams start reducing network response times today?
Map every synchronous request path in a critical user flow, assign latency budgets to each hop, and begin monitoring p95 and p99 latency separately. Eliminating one unnecessary synchronous hop often produces the largest immediate improvement in tail latency.