
To reduce network downtime now, deploy multi-layer monitoring, build tested redundancy into every critical path, document runbooks for your top failure scenarios, and run DR drills at least quarterly. Those four actions address the majority of preventable outages before users ever notice a problem.
Start here — assign these five actions this week:
- Verify monitoring coverage — confirm every critical device, link, and application has an active check with alerting. Owner: NOC lead or network engineer.
- Enable synthetic checks — add transaction-level probes on your most business-critical services so you detect degradation before users report it. Owner: monitoring team.
- Test failover on at least one redundant path — schedule a controlled cutover test and document the result. Owner: network architect.
- Confirm backups are current and restorable — run a restore test on your most recent backup set. Owner: systems or backup administrator.
- Draft or review your top three runbooks — if your team would search Slack for answers during an outage, those scenarios need documented runbooks. Owner: operations manager.
Pro Tip: Assign each item above to a named individual with a due date before this week ends. Unassigned action items stay open indefinitely.
Table of Contents
- What does network downtime actually cost your business?
- What causes most network outages — and how do you fix each one?
- The core strategies that prevent and minimize downtime
- What should you monitor, and how do you structure alerts to cut MTTD and MTTR?
- How do you design redundancy and failover that hold up in production?
- What backup and DR policies do you need to define and test?
- How do runbooks and incident response protocols cut your MTTR?
- How do you measure whether your downtime reduction efforts are working?
- How do you evaluate and select monitoring and automation tools?
- Your 30/90/180-day action plan to reduce network downtime
- Key Takeaways
- The part most teams get wrong about reducing downtime
- Netverge gives your team the visibility to act before users notice
- Useful sources and further reading
What does network downtime actually cost your business?
The financial case for investing in uptime is straightforward once you put a number to it. A widely used industry reference places the cost of downtime at an estimated cost per minute typical for many enterprises. A 30-minute outage during peak hours can therefore represent significant direct losses before you factor in customer churn, SLA penalties, or reputational damage.
Availability tiers determine how much exposure you carry. A 99.9% SLA allows for about 8.8 hours of downtime per year. Increasing availability to 99.99% reduces annual downtime to approximately 52.6 minutes, and 99.999% availability limits downtime to around 5.3 minutes each year. Each additional "nine" reduces annual downtime roughly tenfold — and mission-critical sectors in finance and telecom routinely target five nines or better.
The math matters for budget conversations. If your revenue-generating systems run at 99.9% availability and you operate in a sector where $15,000 per minute is a reasonable benchmark, the 8.8 hours of allowable downtime per year represents a potential exposure exceeding $7.9 million annually. That reframes monitoring and redundancy spending from a cost center to a risk-management investment.
Monitoring ROI models suggest that $1 invested in monitoring can avoid approximately $8 in downtime losses. For IT leaders making the case to finance, that ratio is more persuasive than any feature comparison.
- Finance and banking: highest sensitivity to downtime; regulatory penalties compound direct losses.
- E-commerce: revenue loss is immediate and measurable per transaction.
- Healthcare: patient safety and compliance obligations raise the stakes beyond dollars.
- Manufacturing: production line stoppages cascade into supply chain delays.
What causes most network outages — and how do you fix each one?
Understanding the root cause distribution is the fastest way to prioritize your prevention efforts. For a deeper diagnostic breakdown, the common causes of network downtime guide covers each failure mode with specific diagnostic steps.
| Cause | Typical Trigger | Primary Mitigation |
|---|---|---|
| Human error | Misconfiguration, typo, unauthorized change | Change management process, peer review, pre-deployment validation |
| Hardware failure | End-of-life switches, failed NICs, degraded optics | Lifecycle tracking, proactive replacement, spare inventory |
| Power disruption | UPS failure, PDU overload, utility outage | Redundant power feeds, UPS with monitoring, generator testing |
| ISP / carrier outage | Single-provider dependency, BGP route withdrawal | Carrier diversity, BGP failover, SLA with credits |
| Software / patch errors | Bad firmware push, misconfigured update | Staged rollouts, canary deployments, rollback procedures |
| Expired certificates | TLS cert expiry on load balancers or APIs | Automated certificate monitoring with 30/60-day alerts |
| Security incidents | DDoS, ransomware, unauthorized access | Segmentation, IDS/IPS, incident response plan |
| Configuration drift | Undocumented incremental changes accumulating | Configuration management database (CMDB), automated drift detection |
Human error and configuration drift deserve special attention. A single firewall rule change or VLAN edit that goes undocumented can create a latent failure that only surfaces during a failover event or high-load period, months after the original configuration change. That pattern is more common than most post-mortems acknowledge.
Expired certificates are a surprisingly frequent cause of outages that get misdiagnosed as infrastructure failures. Automated certificate monitoring with tiered alerts at 60, 30, and 7 days eliminates this category almost entirely.
The core strategies that prevent and minimize downtime
Reducing downtime at scale requires a structured approach across six operational pillars. Each pillar has a clear owner and measurable success criteria.
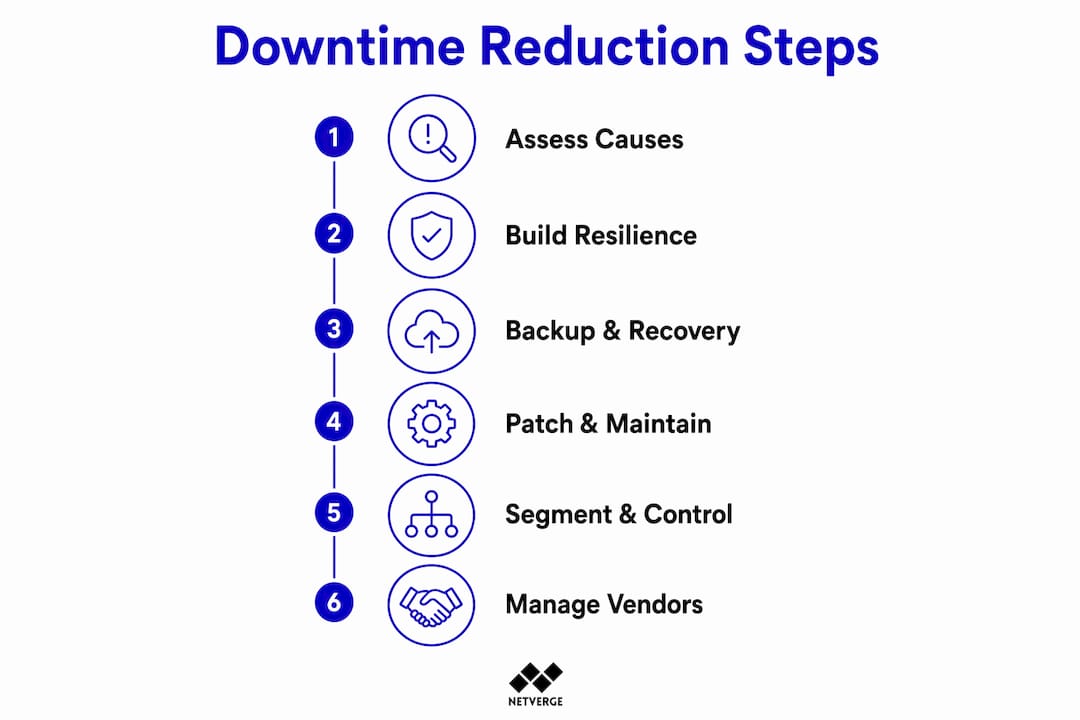
1. Monitoring and observability
Deploy coverage across every layer: network devices, links, applications, and synthetic transactions. Without full-stack visibility, you are reacting to user complaints rather than detecting problems proactively.
- Start with SNMP polling and ICMP checks on all network devices.
- Add flow-based monitoring (NetFlow, sFlow) for traffic anomaly detection.
- Instrument synthetic checks on critical application paths.
- Centralize log aggregation with alerting on error-rate spikes.
2. Resilient architecture and redundancy
Eliminate single points of failure at every layer: links, devices, power, and sites. Active-active configurations provide the fastest failover; active-passive is acceptable for lower-priority systems where cost is a constraint.

3. Backups and disaster recovery
Define RTO and RPO targets for every critical system, then build backup cadences and DR procedures that meet those targets. Test recovery, not just backup creation.
4. Preventive maintenance and patch management
Firmware updates and patching should follow a centralized, scheduled process with rolling deployments in low-traffic windows. Unpatched devices are both a reliability risk and a security exposure.
5. Segmentation and access control
Segment your network so a failure or security incident in one zone cannot cascade across the entire environment. Role-based access control limits the blast radius of human error.
6. Vendor and carrier SLAs
Demand SLAs with financial penalties, not just best-effort commitments. Require documented escalation paths and mean-time-to-respond commitments from every critical provider.
Numbered implementation sequence:
- Audit current monitoring coverage and close gaps (Week 1–2).
- Map single points of failure in your topology (Week 2–3).
- Validate backup integrity and document RTO/RPO targets (Week 3–4).
- Establish a change management process with mandatory peer review (Month 2).
- Schedule quarterly DR tests and failover validation (Month 2–3).
- Review all vendor SLAs and renegotiate where coverage is insufficient (Month 3).
Pro Tip: Configuration drift is one of the most underestimated causes of major outages. Small, undocumented changes — a single ACL tweak, a VLAN edit — accumulate silently and only fail during the worst possible moment. Automate drift detection and require every change to go through a documented approval workflow, no exceptions.
What should you monitor, and how do you structure alerts to cut MTTD and MTTR?
Roughly 76% of outages had detectable signals before users were impacted, according to Gartner figures cited in industry analysis. That statistic makes the case for multi-layer monitoring more clearly than any architecture diagram.
Monitoring layers and where each adds value
- Synthetic monitoring: Simulates user transactions on a schedule. Detects application-level failures before real users hit them. Best for SLA-critical services.
- Real user monitoring (RUM): Captures actual user experience data. Surfaces performance degradation that synthetic checks miss.
- Infrastructure metrics: CPU, memory, interface utilization, error counters. The baseline for capacity planning and hardware failure detection.
- Application performance monitoring (APM): Traces requests across services. Identifies slow dependencies and code-level bottlenecks.
- Log aggregation: Centralizes syslog, event logs, and application logs. Enables correlation across devices and services during incident triage.
- Flow analysis: NetFlow/sFlow data reveals traffic anomalies, bandwidth saturation, and lateral movement patterns.
Alerting strategy to reduce noise and improve signal
Alert fatigue is one of the leading causes of missed outages. The fix is not silencing alerts — it is designing tiered severity levels mapped to automated triage actions.

Start with broad thresholds to collect baseline data, then progressively tighten alert rules as you validate normal operating ranges. This prevents an immediate flood of false positives when you first deploy monitoring.
Alert severity tiers:
| Severity | Trigger Example | Response Action |
|---|---|---|
| P1 — Critical | Core router down, WAN link failure | Page on-call immediately, auto-open incident ticket |
| P2 — High | Interface error rate >1%, | Alert NOC, assign to engineer within 15 minutes |
| P3 — Medium | Disk utilization high, CPU >90% for 5 min | Create ticket, review in next shift |
| P4 — Low | Certificate expiring in 30 days | Create task, assign to maintenance queue |
Key metrics to track:
| Metric | Definition | Target |
|---|---|---|
| MTTD | Mean time to detect an incident | <5 minutes for P1 |
| MTTR | Mean time to restore service | Varies by tier; set per SLA |
| Uptime % | Availability over rolling 30 days | Per SLA target (99.9%–99.999%) |
| Error rate | Interface errors per interval | Low error rate on core links |
| Packet loss | % packets dropped | Minimal errors on production paths |
| Latency (percentile) visualized | Round-trip time percentile | Per application SLA |
Every P1 alert should include: affected service, detection timestamp, current symptom, the runbook link for that failure type, and the on-call contact. That structure eliminates the first two minutes of every incident response where engineers are orienting themselves.
How do you design redundancy and failover that hold up in production?
Redundancy that has never been tested is not redundancy. It is a hypothesis.
Redundancy layers
- Link redundancy: Dual uplinks from edge devices to distribution layer; LACP bonding or spanning-tree failover.
- Device redundancy: Redundant core and distribution switches with HSRP, VRRP, or GLBP for gateway failover.
- Power redundancy: Dual power feeds from separate circuits, UPS on all critical devices, PDU monitoring.
- Site redundancy: Secondary data center or cloud region with replicated services; colocation with diverse fiber entry points.
- Application-level redundancy: Load-balanced active-active clusters for stateless services; active-passive with automated promotion for stateful services.
Active-active vs. active-passive
| Dimension | Active-Active | Active-Passive |
|---|---|---|
| Failover speed | Near-instantaneous | Seconds to minutes (promotion time) |
| Cost | Higher (double capacity) | Lower (standby capacity) |
| Consistency risk | Requires careful state synchronization | Simpler state management |
| Best for | Revenue-critical, latency-sensitive services | Tier-2 services, DR sites |
Pro Tip: Carrier diversity means more than two contracts with different names. Verify that both providers use physically separate fiber paths into your building. Many "diverse" providers share the same conduit at the street level — a single backhoe can take both circuits down simultaneously. Ask your providers for a physical route map.
Failure scenarios and validation tests
| Failure Scenario | Expected Behavior | Validation Test |
|---|---|---|
| Primary WAN link failure | BGP failover to secondary carrier within 60 seconds | Pull primary circuit during maintenance window; verify traffic shifts |
| Core switch failure | HSRP/VRRP promotes standby; traffic resumes | Power off primary switch; confirm sub-30-second failover |
| Primary power feed loss | UPS sustains load; generator starts within 30 seconds | Simulate utility failure; verify generator runtime |
| Primary data center outage | DR site assumes traffic; RTO met | Full DR exercise; measure actual recovery time |
What backup and DR policies do you need to define and test?
Recovery time objective (RTO) is how long you can tolerate a service being down. Recovery point objective (RPO) is how much data loss is acceptable. Every critical system needs both defined before you design its backup strategy.
Service tiers and realistic targets
| Service Tier | Example | RTO Target | RPO Target |
|---|---|---|---|
| Tier 1 — Mission critical | Core network, payment systems | <15 minutes | Near-zero |
| Tier 2 — Business critical | ERP, CRM, email | <4 hours | <1 hour |
| Tier 3 — Standard | Internal tools, dev environments | Less than a day | Less than a day |
Backup types and cadences
- Continuous data protection (CDP): Real-time replication for Tier 1 systems. Meets near-zero RPO requirements.
- Incremental backups: Hourly or every 4 hours for Tier 2 systems. Balances storage cost against RPO.
- Daily snapshots: Full or differential daily for Tier 3 systems. Stored off-site or in a separate cloud region.
- Configuration backups: Network device configs backed up after every change and on a nightly schedule.
For business continuity and disaster recovery planning, the policy document should define: who declares a disaster, who authorizes failover, the communication tree, and the decision criteria for restore-in-place versus full DR activation.
DR test plan outline:
- Tabletop exercise (quarterly): Walk through a scenario with key stakeholders. Identify gaps in the decision tree and communication plan.
- Component test (monthly): Test individual failover paths — a single circuit, a single server, a backup restore.
- Full-scale DR exercise (annually): Activate the DR environment under realistic conditions. Measure actual RTO and RPO against targets.
Regular full-scale DR exercises and quarterly failover tests reveal procedural and tooling gaps that smaller tests consistently miss. A tabletop exercise will not tell you that your DR database is six hours behind because of a replication misconfiguration.
Pro Tip: Run your annual DR exercise during business hours, not a weekend maintenance window. Weekend tests create a false sense of confidence because the team is rested, focused, and not handling competing priorities. A Tuesday afternoon test reveals how your team actually performs under real operational pressure.
How do runbooks and incident response protocols cut your MTTR?
When an outage starts, every minute your team spends searching for documentation or waiting for someone with tribal knowledge to answer their phone is a minute of preventable downtime. Documented escalation paths and runbooks for common failure scenarios are the single most direct lever for reducing MTTR.
Runbook structure: what every runbook must contain
- Symptom description: What the monitoring alert says, what users report.
- Immediate checks: The first three commands or dashboard views to run within the first two minutes.
- Triage decision tree: Branch points that route the responder toward the correct fix path.
- Escalation contacts: Named individuals with phone numbers, not just role titles.
- Containment steps: How to isolate the affected component without expanding the blast radius.
- Restore steps: Ordered procedure to bring the service back, with validation checkpoints.
- Rollback procedure: How to undo the fix if it makes things worse.
- Post-mortem trigger: Criteria that require a formal post-mortem (P1 incidents, repeat failures).
The incident lifecycle follows a consistent sequence: detection → triage → contain → restore → validate → post-mortem. Every runbook should map to this structure so any engineer on the team can pick it up mid-incident.
The most expensive part of most outages is not the failure itself — it is the time spent figuring out who owns the problem and what the correct procedure is. A runbook that answers both questions in the first 30 seconds of an incident can cut MTTR by more than any infrastructure investment.
Converting tribal knowledge into living documentation
The governance model matters as much as the content. Assign a runbook owner for each critical service. Require that runbooks be reviewed after every P1 incident and updated within 48 hours if the procedure was wrong or incomplete. Link runbooks directly from your monitoring alerts so engineers land on the right document automatically.
Integrated network documentation that connects monitoring alerts to runbooks and topology diagrams eliminates the context-switching that slows incident response. When an alert fires, the responder should have the affected device, its upstream dependencies, and the relevant runbook visible in a single interface.
How do you measure whether your downtime reduction efforts are working?
Improvement without measurement is just activity. These are the KPIs that tell you whether your program is working.
Core KPIs and what they reveal
- Uptime %: The lag indicator. Tracks whether SLA targets are being met over rolling 30-day and 90-day windows.
- MTTD: Measures the speed of your detection layer. A declining MTTD trend confirms that monitoring coverage improvements are working.
- MTTR: Measures the speed of your response and recovery. Declining MTTR confirms that runbooks, automation, and training are effective.
- Change failure rate: The percentage of changes that cause an incident or require rollback. A high rate points to change management gaps.
- Number of preventable incidents: Incidents caused by known, addressable failure modes (expired certs, unpatched firmware, known hardware EOL). This metric should trend toward zero.
- SLA compliance rate: Percentage of periods where uptime met the committed SLA. Directly tied to financial exposure and customer trust.
Dashboard design: lead and lag indicators
Structure your dashboards in two layers. Lead indicators (anomaly counts, alert-to-incident ratio, open change requests) tell you where risk is accumulating before an outage occurs. Lag indicators (MTTR trend, monthly uptime %, incident count by cause) confirm whether past investments are paying off.
Reporting cadence:
| Audience | Frequency | Content Focus |
|---|---|---|
| Engineering team | Daily | Open alerts, MTTD/MTTR, change queue |
| Operations manager | Weekly | Incident trends, SLA compliance, change failure rate |
| Executive / leadership | Monthly | Uptime %, cost-of-downtime avoided, SLA status |
What success looks like over time:
- 30 days: Monitoring gaps closed, all P1 alerts linked to runbooks, baseline MTTD and MTTR established.
- 90 days: MTTD trending down, first DR exercise completed, redundancy paths validated.
- 180 days: MTTR measurably reduced from baseline, preventable incident count declining, SLA compliance consistently above target.
How do you evaluate and select monitoring and automation tools?
Marketing materials for monitoring tools tend to look identical. The evaluation checklist below cuts through that.
Procurement checklist
- Telemetry breadth: Does the platform support SNMP, NetFlow, sFlow, ICMP, synthetic checks, log ingestion, and API-based integrations? Gaps in telemetry create blind spots.
- Integration depth: Does it connect to your existing ticketing system, CMDB, and communication tools (PagerDuty, ServiceNow, Slack, Teams)? Manual handoffs between tools add minutes to every incident.
- Automation and runbook support: Can the platform trigger automated remediation actions or link alerts directly to runbooks? This is the lever that reduces MTTR at scale.
- Multi-tenant and role-based access: For MSPs and multi-site enterprises, can you segment visibility and permissions by client, site, or team?
- On-premises and edge agent support: Does the platform support physical or virtual agents for sites without cloud connectivity? Remote sites need local telemetry collection.
- Alerting customization: Can you configure severity tiers, deduplication rules, and escalation paths per service or device type?
Vendor questions to ask during procurement
- What is your platform's own uptime SLA, and what credits apply if you miss it?
- How long is data retained, and what are the export options?
- How does the platform behave during a partial outage of its own infrastructure?
- Can you provide references from deployments at similar scale (number of sites, devices)?
- What does the API support, and is it documented publicly?
Running a pilot
Run a 30-day pilot against a defined scope: one site or one service tier. Measure MTTD for synthetic check failures, alert-to-ticket latency, and engineer time spent per incident. Those three numbers tell you more than any feature demo.
| Pilot Success Criterion | How to Measure |
|---|---|
| Alert-to-ticket latency | Time from alert fire to ticket creation |
| False positive rate | Alerts that did not correspond to real incidents |
| Runbook coverage | % of P1 alert types with a linked runbook |
| Engineer time per incident | Minutes from alert to resolution |
For teams evaluating managed IT security services alongside monitoring tools, the procurement questions above apply equally to managed service providers.
Your 30/90/180-day action plan to reduce network downtime
This timeline converts the playbook above into assignable work. Adapt the owners to your team structure.
30-day priorities: close the gaps you have right now
- Complete a monitoring coverage audit; document every unmonitored device and link.
- Deploy synthetic checks on the top five business-critical services.
- Write or update runbooks for your three most common P1 incident types.
- Run a backup restore test and document the actual recovery time.
- Review all vendor SLAs; flag any without financial penalties or escalation paths.
90-day priorities: validate your architecture
- Conduct a full failover test on your primary WAN redundancy path.
- Run a tabletop DR exercise with all key stakeholders.
- Implement a formal change management process with mandatory peer review and rollback documentation.
- Pilot automation for at least one common remediation action (e.g., auto-restart a failed service, auto-open a ticket on interface error threshold breach).
- Establish baseline MTTD and MTTR metrics and set 90-day improvement targets.
180-day priorities: build toward continuous improvement
- Complete a full-scale DR exercise and measure actual RTO/RPO against targets.
- Evaluate or consolidate monitoring tools; eliminate redundant platforms that create alert silos.
- Implement configuration drift detection across all network devices.
- Review and update all runbooks based on post-mortem findings from the past six months.
- Present a formal uptime and SLA compliance report to leadership with cost-of-downtime-avoided calculations.
| Horizon | Key Deliverable | Owner | Success Criterion |
|---|---|---|---|
| 30 days | Monitoring coverage complete | NOC lead | Zero unmonitored critical devices |
| 30 days | Top 3 runbooks documented | Ops manager | Runbooks linked from P1 alerts |
| 90 days | WAN failover validated | Network architect | Failover completes in <60 seconds |
| 90 days | DR tabletop completed | IT director | Gaps documented and assigned |
| 180 days | Full DR exercise | IT director | Actual RTO meets target |
| 180 days | Drift detection deployed | Network engineer | All changes tracked in CMDB |
Key Takeaways
Reducing network downtime requires monitoring coverage, tested redundancy, documented runbooks, and a disciplined change management process working together — no single fix covers all four failure modes.
| Point | Details |
|---|---|
| Monitor every layer | Deploy synthetic checks, infrastructure metrics, and log aggregation to detect issues before users report them. |
| Test redundancy, don't assume it | Validate failover paths quarterly; untested redundancy is a hypothesis, not a safety net. |
| Runbooks cut MTTR directly | Document detection, triage, and restore steps for every P1 scenario; link runbooks from alerts. |
| Measure MTTD and MTTR | Track both metrics from day one to confirm that investments in monitoring and automation are working. |
| Netverge unifies the playbook | Netverge's AI-powered platform combines real-time monitoring, anomaly detection, automated triage, and documentation in one interface for MSPs and multi-site enterprises. |
The part most teams get wrong about reducing downtime
Most downtime reduction programs fail not because of bad technology choices, but because of a documentation and ownership gap that no tool can fix on its own.
Teams invest in monitoring platforms, add redundant links, and write SLA language into vendor contracts. Then an outage happens and the first 20 minutes are spent figuring out who owns the affected system, where the runbook lives, and whether the backup was actually tested. The monitoring tool fired the alert correctly. The redundant path was there. But the human layer was not ready.
The organizations that consistently hit five-nines availability share one trait: they treat documentation and runbooks as infrastructure, not as an afterthought. Every device has a documented owner. Every P1 scenario has a runbook linked directly from the alert. Every DR exercise produces a written gap analysis that feeds the next quarter's work plan.
The 30/90/180-day plan in this guide is structured around that reality. The 30-day phase is not about buying new tools. It is about closing the visibility and documentation gaps you already have. The technology investments come later, once you know exactly what you are measuring and what you are protecting.
One more thing worth saying directly: configuration drift is the silent killer in enterprise networks. A single undocumented firewall rule change, a VLAN edit that seemed minor, an ACL tweak that nobody logged — these accumulate over months and create failures that look random but are entirely traceable. Automated drift detection and a mandatory change approval workflow are not bureaucratic overhead. They are the difference between a 10-minute fix and a four-hour outage.
Netverge gives your team the visibility to act before users notice
Fragmented monitoring tools and disconnected documentation are the two most common reasons MTTD and MTTR stay high even after significant infrastructure investment. Netverge addresses both in a single platform built specifically for MSPs and multi-site enterprises.

Netverge's AI-powered monitoring delivers real-time infrastructure telemetry across 28+ sensors, with anomaly detection and automated triage that routes incidents to the right runbook before an engineer has to search for one. Vergepoints, Netverge's plug-and-play edge hardware, extend on-site visibility to remote locations that lack local monitoring agents. The platform's knowledge graphs and integrated documentation connect every alert to the affected device's topology, configuration history, and escalation contacts automatically.
For enterprise deployments with multiple sites or client environments, Netverge's multi-tenant architecture and role-based access give each team the visibility they need without exposing data across boundaries.
The fastest way to see the impact: run a 30-day pilot aligned to the first phase of the action plan above. Start with monitoring coverage and synthetic checks, measure your baseline MTTD and MTTR, and let Netverge's automated triage show you how much response time you can recover. Request a demo or start a free trial at netverge.com/monitoring.
Useful sources and further reading
The sources below support the claims in this guide and offer additional depth for teams building out specific program areas.
- Cost of downtime in 2026: $15,000 per minute — Gatling's cost-of-downtime reference with a calculator for modeling financial impact. Best for finance-level business case presentations.
- Enterprise Connectivity Downtime Benchmarks by Industry 2026 — Availability tier benchmarks (99.9% through 99.999%) with industry-specific targets. Use this to set SLA targets by sector.
- Cost of Downtime Statistics 2026 — JustAnalytics — Aggregates Gartner and industry figures on detection rates and monitoring ROI. Strong for engineering leaders building budget justifications.
- Network monitoring best practices — ExtNOC — Practical alerting strategy guidance including threshold design and alert fatigue mitigation. Engineering-level detail.
- Tips for reducing downtime across large-scale business networks — Aitude — Covers automation, predictive maintenance, and runbook governance. Useful for operations teams building out their playbook.
- Network error troubleshooting — ITU Online — Detailed diagnostic guidance for configuration drift and connectivity loss. Best for network engineers handling incident triage.
- Decoding network outages: IT admins' best practices — ComputerTech — DR exercise design and failover testing methodology. Use this when building your quarterly test schedule.
- Business continuity and disaster recovery planning guide — Stanfield IT — DR policy templates and exercise frameworks. Strong for teams formalizing their BC/DR program for the first time.
For finance and leadership teams: Start with the Gatling cost calculator and the JustAnalytics statistics piece. Both are structured for non-technical stakeholders and provide the ROI framing needed to justify program investment.
For engineering and operations teams: The ExtNOC alerting guide, ITU Online troubleshooting reference, and Aitude large-scale network piece provide the implementation depth to move from strategy to execution.