
Multi-site network management is the practice of centrally controlling, monitoring, and optimizing network operations across multiple physical locations using unified control planes, telemetry streaming, and policy-driven automation. IT teams that implement this correctly achieve measurable outcomes: MTTR under 30 minutes, change failure rates below 5%, and near-complete 802.1X coverage within two weeks of deployment. This guide covers the multi-site network management how-to process from architecture prerequisites through AI-assisted operations, drawing on technologies including Cisco Meraki, SD-WAN, SASE, and zero-touch provisioning to give you a repeatable, scalable framework.
What are the core components of multi-site network management?
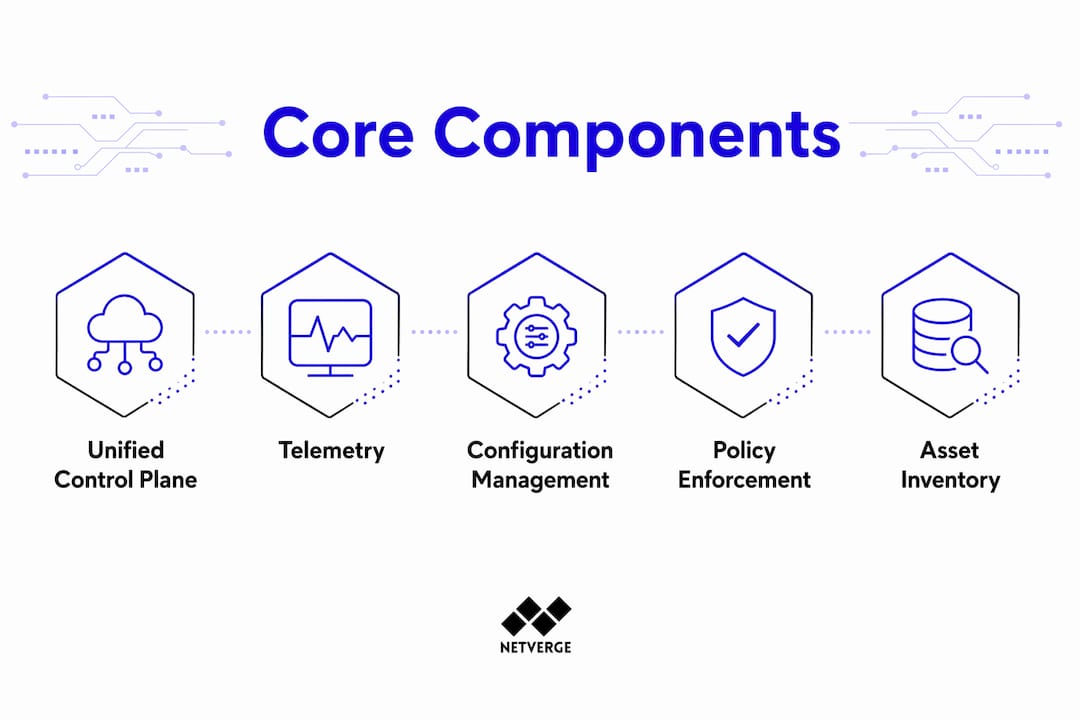
Effective multi-location network management starts with a single operational control plane. That plane must unify four functions: inventory, configuration, policy, and telemetry. Without all four, you have a monitoring wallboard, not a management system. A true control plane also supports zero-touch provisioning, per-site variable templates, role-based access control (RBAC), API automation, and streaming telemetry.
The prerequisites break down into three categories:
Architecture fundamentals
- SD-WAN or SASE fabric to abstract physical WAN links and enforce consistent routing policy
- Network segmentation with VLAN and micro-segmentation policies applied uniformly across sites
- Identity enforcement via 802.1X and RADIUS to control device and user access at every location
Automation capabilities
- Zero-touch provisioning: serial numbers are claimed in the control plane, shipped to site, powered on, and configured automatically without on-site IT staff
- API-first integrations connecting your control plane to ITSM platforms such as ServiceNow or Jira
- RBAC policies that restrict which administrators can push changes to which sites
Telemetry and observability
- Streaming telemetry using gRPC or NETCONF/YANG rather than polling-based SNMP for near-real-time data
- Centralized log aggregation feeding a SIEM or observability platform
- Endpoint health monitoring covering switches, access points, firewalls, and WAN edges
| Tool category | Key capability | Example platforms |
|---|---|---|
| Cloud-managed control plane | Unified config, policy, telemetry | Cisco Meraki, Juniper Mist |
| SD-WAN fabric | WAN abstraction, path selection | VMware SD-WAN, Fortinet SD-WAN |
| Configuration management | Drift detection, version control | Broadcom Network Configuration Manager |
| Observability platform | Telemetry aggregation, alerting | Netverge, Grafana, Datadog |
Pro Tip: Before deploying any control plane, build a complete asset inventory that includes vendor, model, firmware version, support contract status, and end-of-life date for every device across all sites. This inventory drives SLA alignment, patch urgency, and compliance reporting from day one.
How to design a resilient multi-site monitoring architecture
Resilient multi-site monitoring uses a three-layer architecture: local telemetry collectors, regional aggregation nodes, and a central governance layer. Each layer has a distinct role. Local agents capture endpoint health and buffer data during WAN outages. Regional systems normalize and compress data to reduce WAN blast radius. The central layer correlates policy, generates audit trails, and surfaces alerts to your operations team.

The design principle that makes this work is centralizing policy while decentralizing execution. Each site runs its own local enforcement logic, so a WAN failure does not disable access control or routing policy. The central plane governs what the policy is; the local plane enforces it. This separation is what distinguishes a production-grade multi-site monitoring workflow from a fragile hub-and-spoke design.
Site profiling is a critical step that most teams skip. Not every location carries the same risk or maintenance window. Classify each site by:
- Criticality tier: Data centers and primary offices require tighter change windows and faster incident response than branch offices or retail kiosks.
- Connectivity profile: Sites on single-carrier MPLS need local fallback logic that dual-homed sites do not.
- Patch schedule tier: Assign deferred, standard, or emergency patch tiers per site based on criticality and connectivity reliability.
Audit-ready evidence generation belongs in the deployment workflow, not as an afterthought. Practitioners who build evidence-first change workflows generate compliance packets during rollout rather than reconstructing proof after an incident. This means capturing pre-change and post-change configuration snapshots, timestamped policy verification results, and change authorization records at the moment of deployment.
Pro Tip: Use 'golden baseline' images with site-specific variable overlays rather than copying configurations manually. This approach maintains consistency across all locations while accommodating legitimate differences such as local VLAN IDs, WAN interface addresses, and time zone settings.
What are best practices for centralized configuration management?
Configuration drift is the leading cause of multi-site network issues. Drift occurs when device configurations diverge from the approved baseline, typically through manual changes, failed rollbacks, or undocumented emergency fixes. The fix is policy-driven compliance verification triggered after every configuration capture, not just during scheduled audits.
Tools such as Broadcom's Network Configuration Manager verify device configurations against defined policies immediately after a change is detected via SNMP trap or MIB notification. When a violation is found, the system can semi-automatically remediate the device, pushing the approved configuration back without requiring manual intervention. This capture-triggered verification model minimizes the window between a drift event and its correction.
For multi-vendor environments, the FCAPS model provides a vendor-agnostic framework covering Fault, Configuration, Accounting, Performance, and Security management. Practical implementation requires:
- Standardized monitoring protocols: SNMPv3 with authentication and encryption across all vendors
- Centralized configuration repositories with version control, change attribution, and rollback capability
- Bulk task automation to push uniform policy changes across hundreds of devices simultaneously
- Unified security policies enforcing segmentation and access control regardless of vendor
| Feature | Basic config tool | Policy-driven NCM |
|---|---|---|
| Version control | File-based snapshots | Git-integrated with attribution |
| Drift detection | Manual comparison | Automated post-change verification |
| Remediation | Manual push | Semi-automatic repair on violation |
| Audit trail | Log files | Structured, queryable compliance records |
| Multi-vendor support | Limited | SNMPv3, NETCONF, REST API |
The network management features that matter most in multi-vendor settings are those that abstract vendor-specific syntax into a unified policy model. When your compliance engine speaks the same language regardless of whether it is talking to a Cisco, Juniper, or Fortinet device, you eliminate the manual translation work that creates drift in the first place.
How can AI and automation improve multi-site network operations?
AI-assisted network operations follow a clear progression. The starting point is data preparation: collecting and cleaning telemetry logs, helpdesk tickets, and configuration files into a structured pipeline. Raw, unstructured data produces unreliable AI outputs. LLMs applied to network management can convert unstructured log data into SQL queries and coordinate multiple diagnostic tools for automated troubleshooting, but only when the underlying data is clean and consistently labeled.
Retrieval augmented generation (RAG) is the technique that makes AI queries across network data practical. Rather than training a model on your infrastructure data, RAG retrieves relevant configuration records, telemetry snapshots, and ticket history at query time and feeds them to the LLM as context. This means your AI assistant can answer questions like "Which sites changed firewall policy in the last 48 hours and showed latency spikes afterward?" without requiring a custom-trained model.
The progression toward agentic AI is where multi-location network management gains its largest efficiency gains. Agentic systems coordinate multiple tools autonomously: detecting an anomaly, querying the knowledge base for similar past incidents, executing a diagnostic runbook, and opening a ticket with findings attached, all without human initiation. Human oversight remains in the loop through approval gates for remediation actions that carry change risk.
"AI's role in network management is as a force multiplier, not a replacement. It handles the data volume and correlation work that humans cannot do at scale, freeing engineers to focus on architecture decisions and exception handling." — Computer Weekly
Common pitfalls when integrating AI into your multi-site network management workflow:
- Dirty data pipelines: Inconsistent device naming, missing site tags, and unstructured log formats all degrade AI accuracy. Normalize your data model before connecting AI tools.
- No human approval gates: Autonomous remediation without approval workflows creates compliance risk. Define which action categories require human sign-off.
- Skipping RAG in favor of fine-tuning: Fine-tuning a model on your infrastructure data is expensive and quickly becomes stale. RAG with a live data store is more practical for most IT teams.
Pro Tip: Start your AI integration with network monitoring trends that already have structured data, such as interface utilization alerts or BGP state changes, before applying AI to unstructured sources like free-text tickets. Structured data produces faster, more reliable AI results.
What are common challenges when managing multi-site networks?
Multi-site network management generates predictable failure patterns. Knowing them in advance lets you build defenses before they become incidents.
- Configuration drift accumulates silently. Without capture-triggered compliance checks, drift builds up between audit cycles. The fix is continuous verification after every change, not periodic sweeps.
- WAN instability breaks centralized telemetry. Sites on unreliable connections stop reporting, creating blind spots. Local telemetry buffering with store-and-forward to the regional aggregation layer resolves this.
- Manual processes do not scale. Teams that rely on manual configuration pushes and spreadsheet-based inventory cannot manage more than a handful of sites reliably. Automation via zero-touch provisioning and bulk task scripting is the only path to scale.
- Compliance evidence is reconstructed after the fact. Audit teams frequently find that IT teams cannot produce timestamped proof of when a change was made and by whom. Evidence-first workflows that capture compliance packets during deployment solve this.
- Incident response lacks a defined fallback. When a site loses WAN connectivity, local devices must continue enforcing policy autonomously. Define and test fallback behavior for every site tier before an outage occurs.
- Unauthorized changes bypass the control plane. Out-of-band console access and vendor-specific management interfaces create change paths that bypass your central audit trail. Restrict and log all management access paths.
For distributed network operations, the most effective incident response workflow combines automated detection, correlated alert grouping, and a pre-built runbook library. When an alert fires, the system should immediately correlate it with related events across the affected site, retrieve the relevant runbook, and present the on-call engineer with a pre-diagnosed ticket rather than raw alert data.
Key takeaways
Effective multi-site network management requires a unified control plane, a three-layer monitoring architecture, policy-driven configuration management, and AI-ready data pipelines working together as a single operational system.
| Point | Details |
|---|---|
| Unified control plane | Combine inventory, configuration, policy, and telemetry in one system before adding sites. |
| Three-layer monitoring | Deploy local collectors, regional aggregators, and central governance to handle WAN failures. |
| Capture-triggered compliance | Verify configurations against policy immediately after every change to prevent drift. |
| Evidence-first workflows | Generate audit packets during deployment, not after incidents occur. |
| AI requires clean data | Normalize telemetry and log data before connecting AI or RAG-based tools. |
Why dashboards alone will not save your multi-site operations
I have seen IT teams invest heavily in monitoring dashboards and then wonder why their multi-site operations are still reactive. The problem is almost always the same: the dashboard shows what is happening but cannot change it. A display is not a control plane.
The shift that actually transforms operations is treating your management platform as the authoritative source of network state, not just a visualization layer. When your control plane owns provisioning, configuration, policy enforcement, and telemetry, every change flows through it. That means every change is logged, attributable, and verifiable. Compliance stops being a quarterly scramble and becomes a continuous byproduct of normal operations.
The other pattern I consistently see underestimated is the value of site profiling. Teams apply uniform change windows and patch schedules across all locations because it is simpler to manage. But a retail kiosk and a regional data center do not carry the same risk. Treating them identically either over-constrains low-risk sites or under-protects high-risk ones. Investing two hours in a proper site classification model saves dozens of hours in incident response later.
On AI: the teams getting real value from it are not the ones who deployed the most sophisticated models. They are the ones who cleaned their data first. A well-structured telemetry pipeline feeding a simple RAG query layer outperforms a complex model built on inconsistent logs. Get the data right, then add the intelligence.
The multi-site network management workflow that works in 2026 is not about any single tool. It is about building a system where policy, telemetry, and automation reinforce each other continuously.
— Jim
See how Netverge handles multi-site network management at scale
Netverge unifies the capabilities this guide describes into a single AI-powered platform. Its network monitoring and observability module collects streaming telemetry across all sites, correlates anomalies in real time, and surfaces prioritized alerts with diagnostic context already attached. The knowledge graph connects device inventory, configuration history, and incident records into a queryable intelligence layer, while the AI ticketing module handles triage and runbook execution autonomously. For IT teams managing distributed infrastructure, Netverge replaces the fragmented stack of monitoring tools, documentation systems, and manual workflows with one platform built for scale. Request a demo to see it in action across your environment.
FAQ
What is multi-site network management?
Multi-site network management is the centralized control and monitoring of network infrastructure across multiple physical locations using a unified control plane, telemetry streaming, and policy automation. It differs from single-site management in that it must handle WAN variability, site-specific configurations, and distributed compliance requirements simultaneously.
How do you prevent configuration drift across multiple sites?
Configuration drift is prevented by running capture-triggered compliance checks that verify device configurations against approved policies immediately after every detected change, combined with version-controlled repositories and automated remediation for violations.
What is zero-touch provisioning in multi-site networks?
Zero-touch provisioning allows a network device's serial number to be pre-claimed in the control plane so that when the device is shipped to a site and powered on, it automatically downloads its configuration without requiring on-site IT staff. This is the primary mechanism for scaling multi-site deployments without proportional headcount growth.
How does AI improve multi-site network operations?
AI improves multi-site operations by processing telemetry logs, configuration files, and helpdesk tickets at scale, using techniques like retrieval augmented generation to answer operational queries, and coordinating autonomous remediation tasks with human approval gates for high-risk actions.
What architecture supports reliable multi-site monitoring?
A three-layer architecture with local telemetry collectors at each site, regional aggregation nodes that normalize data and reduce WAN load, and a central governance layer for policy correlation and audit trail generation provides the most reliable foundation for multi-site monitoring workflows.