
Network performance optimization is the process of improving speed, reliability, and resource allocation across your infrastructure to maintain consistent, predictable operations. For IT professionals and network administrators managing distributed environments, knowing how to optimize network performance is the difference between proactive control and reactive firefighting. This guide covers the core diagnostic tools, monitoring strategies, infrastructure upgrades, and traffic management techniques you need to keep your network running at peak efficiency in 2026. Technologies like Wi-Fi 6E/7, AI-driven routing, and edge computing nodes have changed what's possible. This guide shows you how to apply them.
What are the essential tools and metrics for diagnosing network issues?

Effective network performance optimization starts with measuring the right things in the right order. Chasing symptoms without a systematic approach wastes time and produces incomplete fixes.
The four core metrics every network administrator must track are:
- Latency: Round-trip time between two endpoints, measured in milliseconds
- Jitter: Variation in latency over time, critical for voice and video traffic
- Throughput: Actual data transfer rate, measured against theoretical capacity
- Packet loss: Percentage of packets that fail to reach their destination
Once you have baseline readings for these metrics, the diagnostic sequence follows a specific order: metric collection first, then path analysis, interface-level checks, TCP protocol inspection, MTU verification, and finally continuous monitoring. Skipping steps in this sequence is how teams end up treating the wrong problem.
The right tools for each diagnostic stage
Four tools cover the full diagnostic workflow:
- mtr: Combines traceroute and ping into a single continuous view. Mtr analyzes each hop along a path, pinpointing exactly where latency or packet loss originates rather than just confirming it exists at the endpoint.
- iperf3: Measures raw bandwidth between two points. Use it to verify whether your physical links are delivering their rated capacity.
- tcpdump: Captures live packet data for protocol-level inspection. Useful when latency metrics look normal but application behavior is degraded.
- Prometheus and Grafana: Collect and visualize time-series telemetry at scale. These tools turn raw metrics into dashboards and alerts your team can act on.
Pro Tip: Always run mtr in both directions between endpoints. Asymmetric routing is common in distributed environments and will produce misleading results if you only test one direction.
How to implement proactive monitoring and alerting
Monitoring without defined thresholds produces noise, not intelligence. The goal is to detect degradation before users report it.
Set proactive alert triggers at three specific thresholds: 60% bandwidth utilization, a 50% increase over baseline latency, and 80% of your concurrent connection limit. These thresholds give your team enough lead time to act before service quality degrades. Waiting until utilization hits 90% or 95% leaves no room to respond.
A practical alerting architecture for distributed networks includes:
- Bandwidth alerts: Trigger at 60% utilization per link, segmented by site or VLAN
- Latency alerts: Fire when round-trip time exceeds 150% of the established baseline
- Connection count alerts: Activate at 80% of the maximum connection threshold per device
- Anomaly detection: Use AI-based monitoring to flag unusual traffic patterns that don't match historical baselines
AI-enabled QoS systems adjust traffic priorities continuously based on real-time usage patterns. This reduces the manual tuning burden on your team and catches edge cases that static rules miss. For teams managing dozens of sites, this is not optional. It's the only way to maintain consistent service quality at scale.
Netverge's real-time network monitoring capabilities integrate directly with these alerting strategies, giving administrators a unified view across all sites without stitching together separate tools.
Pro Tip: Customize alert severity levels so your team receives critical pages only for genuine service-impacting events. Alert fatigue is real, and teams that receive too many low-priority notifications start ignoring all of them.
What infrastructure upgrades improve network performance in 2026?
Hardware and protocol choices set the ceiling for what software optimization can achieve. If your physical infrastructure is outdated, no amount of tuning will close the gap.
Wireless infrastructure
Wi-Fi 7 and Wi-Fi 6E deployments deliver multi-gigabit speeds and significantly better spectrum utilization than previous standards. Wi-Fi 7 introduces multi-link operation, allowing devices to transmit across multiple frequency bands simultaneously. For high-density environments like warehouses, hospitals, or open-plan offices, this translates directly into lower latency and fewer dropped connections.
Traffic distribution architecture
| Technology | Primary function | Best use case |
|---|---|---|
| Load balancers | Distribute requests across servers | Prevent single-server overload |
| CDNs | Cache static content at edge nodes | Reduce latency for geographically distributed users |
| Service mesh | Manage microservice-to-microservice traffic | Containerized application environments |
| Edge computing nodes | Process data closer to the source | Reduce round-trip latency for latency-sensitive workloads |
Load balancers, CDNs, and service mesh architectures each solve a different part of the traffic distribution problem. Deploying all three in the right contexts eliminates the bottlenecks that no single solution addresses alone.
Protocol and hardware optimization
Tuning TCP settings such as window size and congestion control algorithms reduces latency and improves reliability on high-bandwidth links. HTTP/2 and HTTP/3 both reduce connection overhead compared to HTTP/1.1, with HTTP/3's QUIC transport layer providing measurable improvements on lossy connections. VLAN segmentation isolates traffic types, preventing broadcast storms and reducing unnecessary load on all segments. Hardware acceleration offloads packet processing from the CPU, freeing compute resources for application workloads.
Which traffic management strategies effectively boost performance?
Traffic management is where configuration decisions produce the most immediate, measurable results. The right combination of techniques resolves congestion without requiring hardware changes.
Traffic shaping, caching, data compression, and adaptive AI-based QoS work together to improve bandwidth utilization and reduce congestion. Each technique addresses a different failure mode.
- Traffic shaping: Rate-limit non-critical applications like software update downloads during business hours. This preserves bandwidth for real-time traffic without blocking updates entirely.
- Quality of Service (QoS): Assign priority queues to voice, video, and business-critical applications. Static QoS rules work for predictable traffic patterns. AI-assisted adaptive QoS handles environments where traffic profiles change throughout the day.
- Caching: Store frequently requested content locally at branch sites. This reduces WAN utilization and cuts response times for repeated requests.
- Data compression: Apply compression to text-based protocols and backup traffic. The CPU overhead is minimal compared to the bandwidth savings on constrained links.
- Dynamic bandwidth allocation: Shift capacity between sites or applications based on real-time demand rather than fixed allocations.
For teams looking to reduce infrastructure costs while maintaining performance, resource allocation strategies that pair traffic management with capacity planning prevent unnecessary hardware spending.
Pro Tip: Test QoS configurations during off-peak hours using iperf3 to simulate peak traffic loads. What works in theory often behaves differently under real congestion conditions.
Correlating traffic data across the full hardware stack is what separates accurate bottleneck identification from guesswork. Effective network management in distributed environments depends on seeing how metrics at the switch, router, and application layer interact, not just monitoring each layer in isolation. Netverge's AI-powered network management approach applies this cross-layer correlation automatically, surfacing the actual root cause rather than the nearest visible symptom.
Key Takeaways
Network performance optimization requires a systematic combination of accurate diagnostics, threshold-based alerting, infrastructure upgrades, and traffic management to maintain reliable operations across distributed environments.
| Point | Details |
|---|---|
| Diagnose in sequence | Collect latency, throughput, and packet loss metrics before moving to path analysis with mtr or iperf3. |
| Set specific alert thresholds | Trigger alerts at 60% bandwidth, 50% latency increase, and 80% connection count to catch issues early. |
| Upgrade wireless infrastructure | Wi-Fi 7 and Wi-Fi 6E deliver multi-gigabit speeds and lower latency than previous wireless standards. |
| Combine traffic management techniques | Pair QoS, traffic shaping, and caching to resolve congestion without requiring hardware changes. |
| Monitor iteratively, not reactively | Proactive, data-driven monitoring prevents overprovisioning and resolves root causes instead of symptoms. |
What I've learned from years of network optimization work
The most common mistake I see in distributed network environments is treating optimization as a one-time project. Teams run a diagnostic, fix the obvious bottleneck, and move on. Six months later, the same symptoms appear in a different location because the underlying approach hasn't changed.
Network optimization is iterative by nature. Capacity increases alone lead to overprovisioning without resolving the actual issue. I've watched organizations double their WAN bandwidth and see no improvement in application performance because the real problem was QoS misconfiguration, not insufficient capacity. The monitoring data was there. Nobody was reading it systematically.
AI-based routing has genuinely changed what's possible for teams managing 20 or more sites. But it's not a replacement for understanding your baseline. I've seen AI-assisted QoS systems make poor decisions in environments where the initial traffic classification was wrong. Garbage in, garbage out. The technology amplifies your configuration quality, it doesn't substitute for it.
My practical advice: spend two weeks collecting clean baseline telemetry before touching any configuration. Use Prometheus and Grafana to build dashboards that show you normal. Once you know what normal looks like, anomalies become obvious. That's when your network performance management workflow actually starts producing results instead of generating more questions.
— Jim
Netverge: AI-powered monitoring built for network optimization
Netverge's AI-Powered Network Monitoring and Observability platform gives IT teams and MSPs the real-time telemetry, anomaly detection, and automated alerting they need to act on performance issues before users notice them.
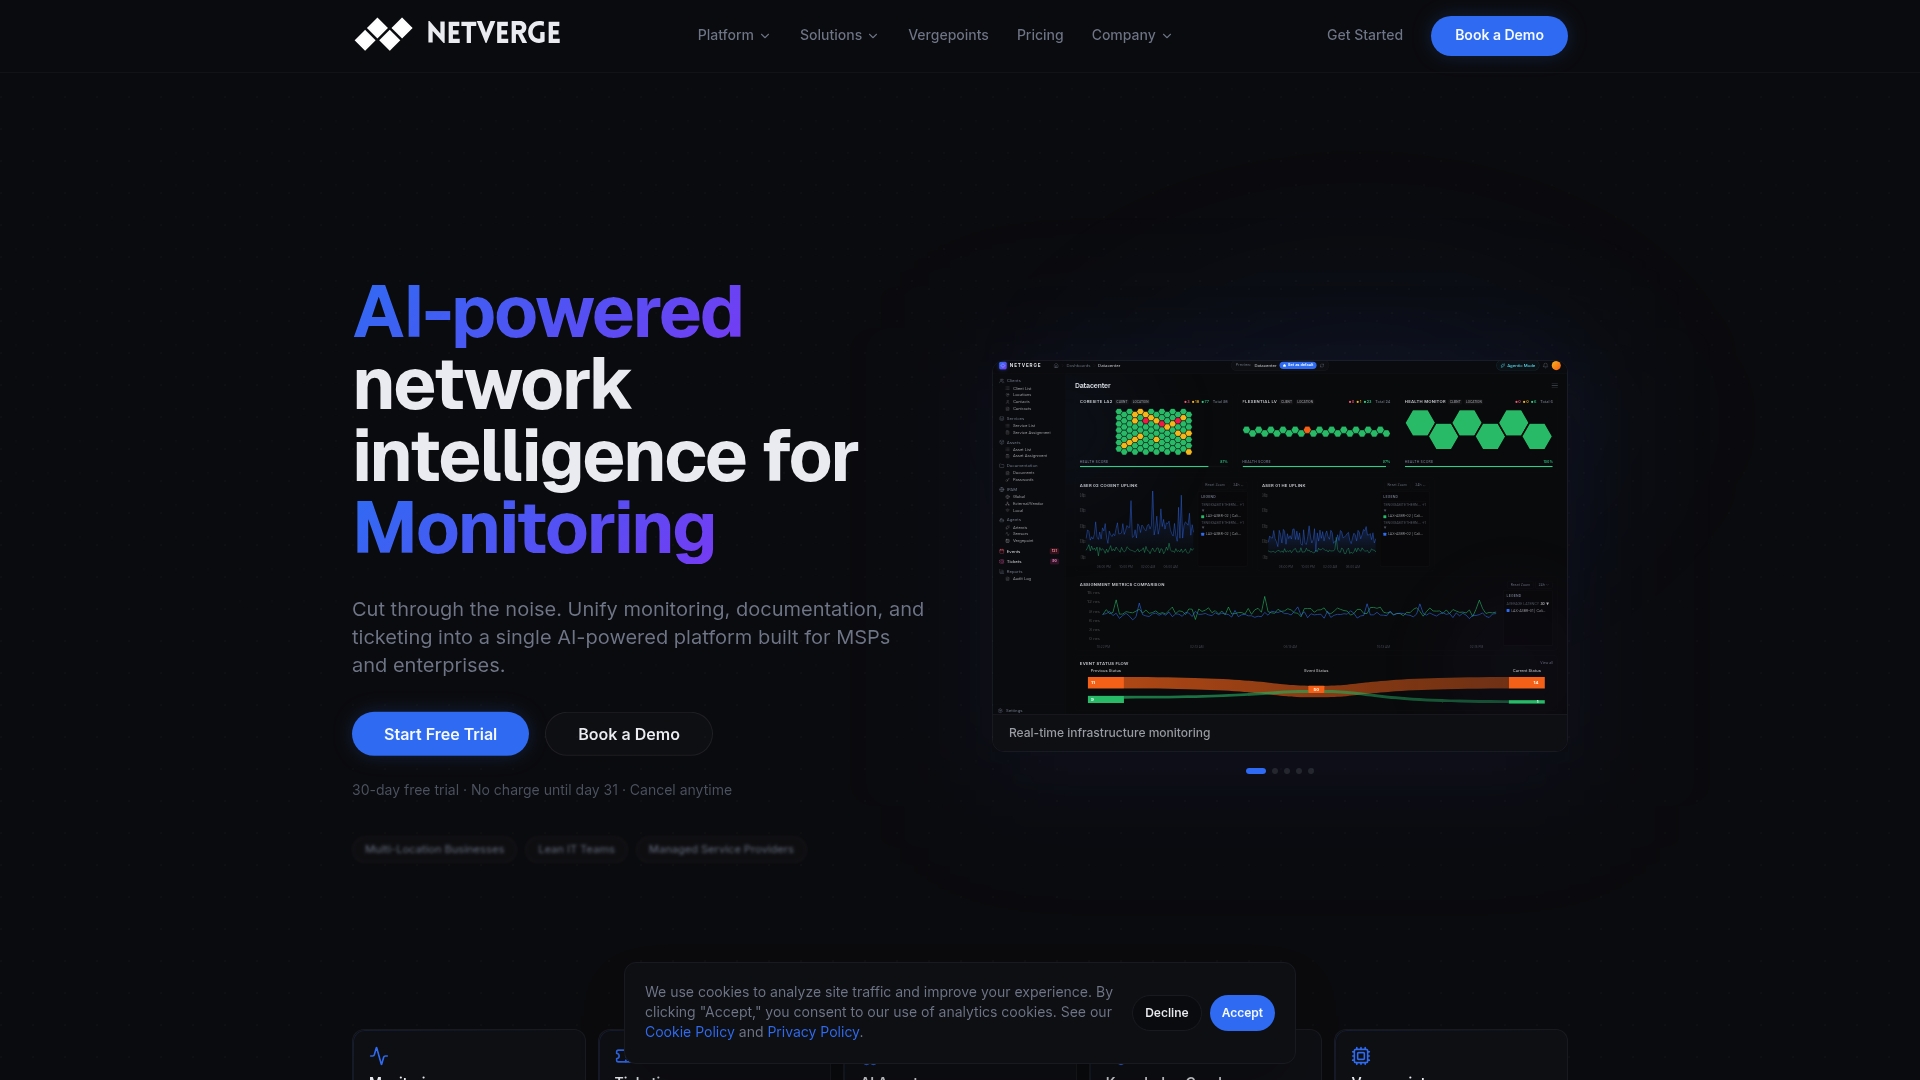
The platform unifies monitoring, documentation, and ticketing into a single interface, replacing the fragmented tool stacks that slow down distributed network management. Vergepoints hardware sensors provide physical-layer visibility at every site. AI agents correlate data across the full stack and surface root causes automatically. Whether you manage 5 locations or 500, Netverge scales to your environment without adding operational complexity. Request a demo or start a free trial at netverge.com/monitoring.
FAQ
What is network performance optimization?
Network performance optimization is the process of improving speed, reliability, and resource efficiency across a network infrastructure. It includes diagnostic analysis, configuration tuning, traffic management, and infrastructure upgrades to maintain consistent service quality.
What tools are used to diagnose network performance problems?
The standard diagnostic toolkit includes mtr for path analysis, iperf3 for bandwidth measurement, tcpdump for packet inspection, and Prometheus with Grafana for continuous monitoring and visualization.
What alert thresholds should I set for network monitoring?
Set alerts at 60% bandwidth utilization, a 50% increase over baseline latency, and 80% of your maximum connection count. These thresholds provide enough lead time to respond before service quality degrades.
How does AI improve network performance optimization?
AI-assisted adaptive QoS systems continuously adjust traffic priorities based on real-time usage patterns, reducing manual configuration and catching anomalies that static rules miss. AI-driven routing also minimizes data travel distances in distributed environments.
What is the difference between traffic shaping and QoS?
Traffic shaping limits the bandwidth available to specific applications or traffic types. QoS assigns priority levels to different traffic classes so critical applications receive bandwidth first during congestion. Both techniques work together for complete traffic management.