
For MSPs and multi-location enterprises, the right exchange management tools are AI-powered, multi-tenant network monitoring platforms with optional edge sensors. Netverge is the recommended choice: it unifies real-time monitoring, automated troubleshooting, knowledge graphs, and intelligent ticket triage into a single platform built for distributed infrastructure at scale.
- Over 30% of network operations teams report recurring issues more than once a month, and many incidents take over two hours to resolve. Centralized, AI-driven management reduces both the frequency and time to resolution.
- Netverge's Vergepoints hardware sensors deliver physical-layer telemetry at each site, closing the visibility gap that cloud-only tools leave open.
- Run the RFP checklist in Section 8 first, then request a Netverge demo to validate fit against your specific environment.
Table of Contents
- What features should exchange management tools include?
- Deployment models, timelines, and TCO drivers
- What auditors and security teams will check
- How do you operate a monitoring platform across hundreds of sites?
- Which integrations remove the most operational friction?
- Why edge sensors matter and how to deploy Vergepoints
- RFP checklist and scoring matrix for vendor evaluation
- What Netverge delivers: platform capabilities and outcomes
- Key Takeaways
- What actually separates good deployments from failed ones
- Netverge gives you visibility from edge to cloud
What features should exchange management tools include?
Native multi-tenancy, automated discovery, and PSA integration are the three features that separate purpose-built MSP platforms from general-purpose monitoring tools. Every item below belongs in your RFP.
- Native multi-tenant architecture with client isolation, separate RBAC scopes, and white-label dashboards so each client sees only their environment.
- Automated network discovery and topology mapping at both Layer 2 and Layer 3, with configuration backup and drift detection to catch unauthorized changes before they compound. See automated topology mapping for a detailed breakdown of what accurate discovery requires.
- PSA/ITSM integration with ConnectWise, Autotask, HaloPSA, and ServiceNow, plus intelligent ticket triage that routes and enriches alerts before a human touches them.
- AI-driven anomaly detection with dynamic thresholds, not static ones, and automated remediation workflows that attempt resolution before escalating.
- Edge visibility via hardware sensors (Vergepoints) or lightweight virtual collectors for sites where cloud-only polling misses physical-layer events.
- API throughput, data retention options, and tenant-level reporting as scalability markers. Ask vendors for documented performance baselines under load.
- RBAC with least-privilege scoping, detailed audit logging, and encryption in transit and at rest as non-negotiable operational controls.
Pro Tip: Request a live multi-tenant demo with at least three simulated client tenants. Platforms that struggle to isolate alert streams or dashboards at demo scale will fail at production scale.
Deployment models, timelines, and TCO drivers
Cloud-based monitoring is the baseline deployment model for MSPs, but the choice between pure SaaS, SaaS with edge hardware, and self-hosted variants carries real cost and operational tradeoffs.
Pure SaaS minimizes infrastructure overhead and accelerates initial onboarding, but it depends on reliable WAN connectivity for telemetry. Adding Vergepoints hardware at each site introduces local buffering and physical-layer visibility, which matters for sites with intermittent uplinks or strict latency requirements. Self-hosted deployments give maximum data-residency control but add patching and infrastructure overhead your team must absorb.
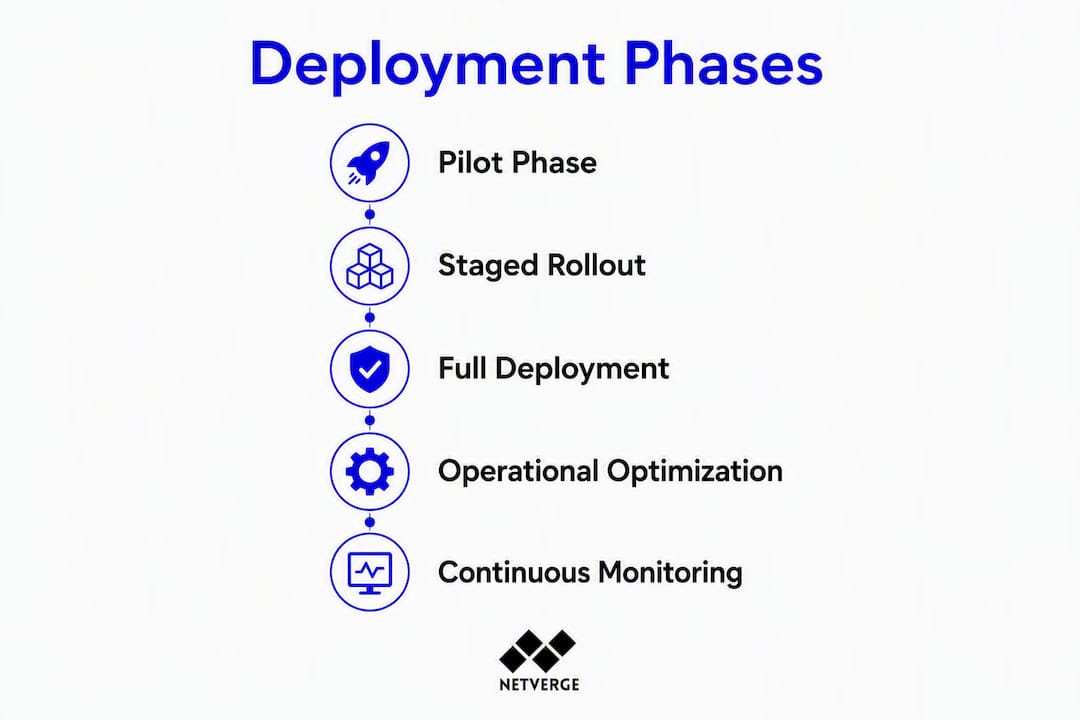
A realistic multi-site MSP rollout follows three phases: a pilot phase at a few representative sites, a staged rollout covering a portion of the estate, then full-scale deployment. Delays most often occur at the PSA integration and data-normalization steps, not the agent deployment itself.
| Cost Line Item | Key Sizing Variable | Where It Moves TCO |
|---|---|---|
| Platform license | Per-site vs. per-device model | Per-site pricing favors many small branches; per-device favors fewer large sites |
| Data ingestion/retention | Polling frequency and retention period | High-frequency telemetry at scale multiplies storage costs quickly |
| Edge hardware (Vergepoints) | Number of sites requiring physical sensors | One-time hardware cost plus firmware management overhead |
| PSA/ITSM integration | Custom field mapping and workflow complexity | Professional services hours often underestimated here |
| Professional services | Onboarding complexity and template build-out | Front-load this cost; it reduces ongoing operational spend |
Automation and intelligent ticket triage reduce L1 and L2 labor costs materially. Platforms that resolve routine alerts autonomously keep ticket volume from growing in proportion to monitored device count.
Pro Tip: Pilot with your two highest-variance client sites, not your easiest ones. Locking down per-site TCO on complex environments gives you a defensible budget ceiling before full procurement.
What auditors and security teams will check
Compliance with HIPAA, PCI-DSS, and GDPR requires RBAC and detailed audit logging across every managed environment. Auditors will ask for specific artifacts, and your platform must produce them on demand.
- RBAC with tenant scoping: each administrator should access only the tenants and functions their role requires. Least-privilege enforcement must be configurable per client, not just globally.
- Immutable audit logs: every configuration change, login event, and policy modification must be logged with timestamps, user identity, and the before/after state. Exportable reports in standard formats (CSV, JSON) are required for most audit workflows.
- Encryption: TLS for all data in motion; AES-256 or equivalent for data at rest. Ask vendors for their key management options and whether customer-managed keys are available.
- Policy templating and segmentation: consistent firewall rules, VLAN assignments, and QoS policies pushed from a central template prevent the configuration drift that creates audit findings.
- SOC 2 / ISO 27001 evidence: request the vendor's current attestation scope, their change history reports, and documented incident response integrations. These are the artifacts auditors will pull first.
Compliance note: Regulatory requirements vary by industry, data type, and jurisdiction. Confirm current obligations with your legal or compliance team before finalizing platform selection.
How do you operate a monitoring platform across hundreds of sites?
Architecture standardization is the only practical way to prevent operational friction from compounding as site count grows. Without it, every new location introduces unique configurations that multiply troubleshooting time and erode security posture.
- Baseline inventory: run automated discovery across all sites to build a complete asset register before writing any policy.
- Build standard templates: define group policies, VLAN schemas, firewall rule sets, and QoS profiles for each site tier (branch, hub, data center). Push these from a central controller.
- Staged enforcement: apply templates to a pilot cohort first. Measure drift incidents and MTTR before expanding.
- Continuous audit: schedule automated drift detection scans. Any deviation from the approved template generates an alert, not a ticket, unless remediation fails.
- Governance layer: define change windows, delegated access patterns for client-side technicians, and escalation runbooks that tie monitoring alerts directly to PSA/ITSM automations.
Configuration drift is the hidden failure mode that multiplies troubleshooting time and quietly degrades security posture across distributed estates. Versioned configuration backups with automated comparison catch it before it becomes an incident.
Pro Tip: Tiered alerting matters as much as detection. Route only actionable, enriched incidents to human operators. Everything else should be handled autonomously or suppressed with a logged reason.
Which integrations remove the most operational friction?
PSA and ITSM integrations deliver the highest immediate ROI because they close the loop between detection and ticketing without manual handoff.

| Integration Type | Platform Examples | Expected Value |
|---|---|---|
| PSA/ITSM | ConnectWise, Autotask, HaloPSA, ServiceNow | Automated ticket creation, enrichment, and closure |
| RMM | Major RMM platforms | Asset sync and correlated endpoint + network context |
| SIEM | Splunk, Microsoft Sentinel | Threat correlation and security event escalation |
| Cloud providers | AWS, Azure, GCP | Unified visibility across on-prem and cloud workloads |
| Identity providers | Okta, Microsoft Entra ID | Identity-driven access control and user-context enrichment |
A well-built automation workflow looks like this: an anomaly alert fires, the platform enriches it with topology context and the most recent configuration change on that device, an autonomous agent attempts remediation, and a ticket is created in your PSA only if remediation fails. That sequence keeps L1 ticket volume flat even as your monitored estate grows.
API readiness and webhook support are prerequisites for any custom orchestration. Ask vendors for documented API rate limits, authentication methods, and webhook payload schemas before signing.
Pro Tip: Map your current PSA workflow before integration. Platforms that require you to rebuild your ticket routing logic from scratch add weeks to onboarding and hidden professional services cost.
Why edge sensors matter and how to deploy Vergepoints
Cloud polling catches most network events, but it misses physical-layer failures, local broadcast storms, and telemetry from sites with degraded WAN links. Hardware sensors at the edge close that gap.
- Placement: deploy at least one Vergepoint at each site's core switch uplink. Add sensors at DMZ boundaries and secondary uplinks for sites with high availability requirements.
- Local buffering: Vergepoints store telemetry locally during WAN outages and sync when connectivity restores, preventing data gaps in your monitoring record.
- Firmware and bootstrap: establish a documented firmware update process and secure bootstrap procedure before deployment. Tag each unit in your asset management system at installation.
- Power and connectivity: confirm PoE availability or plan for local power. Remote management access (out-of-band or dedicated management VLAN) is required for firmware updates and troubleshooting without a site visit.
| Deployment Variable | Recommendation |
|---|---|
| Sensors per small branch | 1 Vergepoint at core uplink |
| Sensors per hub/data center | 2+ Vergepoints at uplink and DMZ |
| Firmware update method | Centralized, staged rollout via Netverge platform |
| Asset tagging | Serial number logged at installation; synced to platform inventory |
Pro Tip: Deploy Vergepoints at your pilot sites during the evaluation phase. Physical-layer telemetry from real environments surfaces requirements you cannot anticipate from a cloud-only demo.
RFP checklist and scoring matrix for vendor evaluation
Structure your RFP around these weighted categories. Score each vendor response and use the pilot metrics to validate scores before final selection.
Scored RFP questions:
- Multi-tenant architecture with client isolation (10 pts): Can the platform enforce strict data and alert separation across tenants without custom development?
- PSA/ITSM integration depth (8 pts): Does the integration support bidirectional sync, custom field mapping, and automated ticket closure?
- Pricing model transparency (8 pts): Is per-site or per-device pricing clearly documented, with no hidden ingestion or API overage fees?
- API coverage and webhook support (7 pts): Are all platform functions accessible via API? Are webhook payloads documented and versioned?
- RBAC and audit logging (7 pts): Can audit logs be exported on demand? Are they immutable and timestamped to the user action?
- Edge hardware availability (6 pts): Does the vendor offer physical sensors, and are they managed through the same platform interface?
- Automated remediation workflows (6 pts): Can the platform attempt autonomous resolution before escalating to a human?
Pilot success metrics to collect:
- Onboarding time per site (target: under four hours for a standard branch).
- MTTR delta between pre- and post-deployment incidents.
- Ticket volume change per monitored device after automation is active.
- Policy drift incidents detected in the first 30 days.
Scoring matrix template:
| Category | Max Score | Vendor A | Vendor B | Notes |
|---|---|---|---|---|
| Multi-tenancy | 10 | Client isolation test required | ||
| PSA integration | 8 | Verify bidirectional sync | ||
| Pricing transparency | 8 | Request written pricing schedule | ||
| API coverage | 7 | Review API docs before scoring | ||
| RBAC/audit logging | 7 | Request sample audit export | ||
| Edge hardware | 6 | Confirm managed via same UI | ||
| Automated remediation | 6 | Demo autonomous resolution |
Pro Tip: Weight pricing transparency as heavily as technical features. Platforms with opaque per-device or ingestion-based pricing consistently exceed initial budget estimates at scale.
For a detailed MSP onboarding checklist covering pilot setup and staged rollout steps, Netverge publishes a complete guide for IT teams.
What Netverge delivers: platform capabilities and outcomes
Netverge provides a unified AI-powered monitoring platform purpose-built for MSPs and multi-location enterprises. Its core capabilities address every category in the RFP checklist above.
- Unified monitoring and knowledge graph: real-time infrastructure monitoring with a knowledge graph that correlates device relationships, configuration history, and alert context automatically.
- Autonomous AI agents: diagnose and resolve routine incidents without human intervention, reducing L1 ticket volume and MTTR.
- Multi-tenant dashboards: native client isolation with RBAC scoping and white-label options for MSP service delivery.
- Vergepoints: hardware edge sensors that deliver physical-layer telemetry, local buffering, and on-site visibility integrated directly into the Netverge platform.
- AI ticket triage: intelligent routing and enrichment that sends only actionable, contextualized incidents to human operators.
- Audit logging and compliance controls: exportable, immutable logs with RBAC enforcement to support HIPAA, PCI-DSS, and GDPR audit workflows.
Netverge's autonomous agents and Vergepoints hardware address the two most common gaps in distributed network management: alert noise without resolution, and physical-layer blind spots at the edge.
Key Takeaways
AI-powered, multi-tenant network monitoring with edge sensors is the most effective approach for MSPs and multi-location enterprises managing distributed infrastructure at scale.
| Point | Details |
|---|---|
| Recurring issues are common | Over 30% of network teams see recurring issues more than once a month, and many incidents take over two hours to resolve. Centralized management reduces both frequency and time to resolution. |
| Pricing model drives TCO | Per-site pricing favors many small branches; per-device pricing suits fewer large sites. Clarify this in every RFP. |
| Compliance requires specific artifacts | RBAC, immutable audit logs, and exportable policy reports are the artifacts auditors will request first. |
| Standardization prevents drift | Templated policies pushed centrally are the only way to prevent configuration drift from compounding across dozens of sites. |
| Netverge covers the full stack | Netverge combines AI monitoring, autonomous agents, Vergepoints edge sensors, and multi-tenant RBAC in one platform. |
What actually separates good deployments from failed ones
Most platform evaluations focus on feature lists. The deployments that fail do so for a different reason: teams underestimate the integration work and skip the pilot phase.
PSA integration is where the gap between a vendor demo and production reality shows up most clearly. A platform that creates tickets is not the same as one that creates the right tickets with the right context, routed to the right queue, and closed automatically when the autonomous agent resolves the issue. That distinction takes weeks to validate, which is exactly why the pilot phase exists.
Configuration drift deserves more attention than it typically gets during procurement. It is not a dramatic failure mode. It accumulates quietly, one manual change at a time, until a site's configuration no longer matches the approved template and nobody can explain why an incident took three times longer to resolve than it should have. Automated drift detection with versioned backups is not a nice feature. It is the control that keeps your security posture intact as your estate grows.
The teams that get the most value from AI-powered monitoring are the ones that define success metrics before deployment, not after. MTTR, ticket volume per device, and policy drift incidents are the three numbers worth tracking from day one of the pilot.
Netverge gives you visibility from edge to cloud
Fragmented monitoring tools and manual ticket workflows cost MSPs and enterprise IT teams more than they realize, in engineer hours, missed SLAs, and audit findings that could have been prevented. Netverge consolidates monitoring, documentation, ticketing, and edge telemetry into one AI-powered platform, so your team spends time resolving issues, not hunting for context.

Three reasons procurement teams choose Netverge:
- Fast onboarding: staged rollout support and pre-built templates reduce per-site deployment time from days to hours.
- Vergepoints edge sensors: physical-layer telemetry at every site, managed through the same interface as your cloud monitoring.
- AI ticket triage: autonomous agents handle routine L1 incidents before they reach your engineers, keeping ticket volume flat as your estate scales.
Request a demo or start a trial to see how Netverge performs against your RFP criteria in a live environment.