
Integrated network dashboards are unified platforms that combine data collection, analysis, alerting, and reporting into a single interactive interface, replacing the fragmented tool stacks that slow down modern IT operations. For IT professionals managing multi-vendor, hybrid, or distributed environments, understanding why integrated network dashboards matter is no longer optional. The difference between a reactive team and a proactive one often comes down to whether your monitoring infrastructure gives you a single source of truth or forces you to manually assemble context from five separate consoles. Platforms like Microsoft's Infrastructure Graph and tools like FineReport demonstrate what becomes possible when topology, telemetry, and incident data converge in one place.
Why integrated network dashboards improve real-time visibility
Integrated dashboards provide a single interactive interface where teams see not only what is happening across the network, but why it is happening and what to do next. That distinction matters enormously. Traditional monitoring tools answer the "what" question. Integrated platforms answer all three questions simultaneously, which is what separates incident response measured in minutes from incident response measured in hours.
The latency gap between fragmented and unified monitoring is significant. Without a unified, low-latency view of topology and telemetry, accessing data from multiple sources takes minutes to hours, directly hindering real-time reasoning. Microsoft's Infrastructure Graph addresses this by correlating topology and telemetry in one platform, delivering insights often within seconds. That speed difference is not a minor convenience. It determines whether an engineer catches a cascading failure before it affects users or after.
Real-time topology mapping is one of the most underappreciated capabilities in this space. When you can visualize device relationships and traffic flows as they exist right now, rather than as they existed during the last polling cycle, impact localization becomes precise. You identify which downstream devices are affected by a failing switch before the helpdesk queue fills up.

Pro Tip: Configure your topology map to display real-time interface utilization alongside device health status. When a link degrades, you immediately see which dependent devices are at risk, cutting the time to identify blast radius from minutes to seconds.
Key visibility gains from integrated network monitoring include:
- Real-time device health and interface status across all vendors in one view
- Automated alert correlation that groups related events into a single incident
- Live traffic flow analysis tied directly to topology context
- Drill-down from network-wide overview to individual device telemetry without switching tools
What challenges do multi-vendor environments create?
Multi-vendor environments force organizations to manage multiple dashboards simultaneously, creating operational challenges and visibility gaps that compound over time. A network running Cisco routers, Juniper switches, Palo Alto firewalls, and AWS cloud workloads generates telemetry in different formats, through different APIs, with different polling intervals. No single vendor's native tool covers the full picture.
The result is operational silos. Network engineers, security analysts, and cloud operations teams each work from their own console, and cross-domain correlation requires manual effort. When an incident spans multiple domains, which most significant ones do, the time lost to assembling context across incompatible systems directly inflates mean time to detect and mean time to repair.
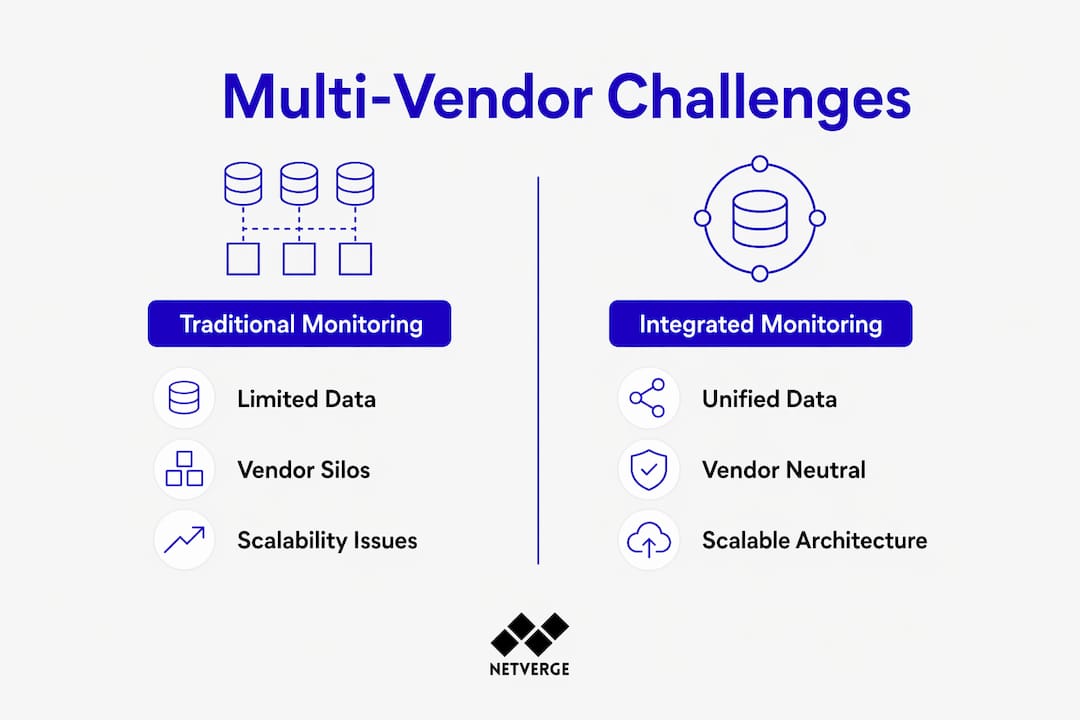
Centralized, vendor-neutral dashboards solve this by ingesting data through protocol and API flexibility, normalizing it into a common schema, and presenting it in a unified view. The comparison below illustrates the operational difference:
| Capability | Traditional monitoring | Integrated monitoring |
|---|---|---|
| Data sources | Single vendor or tool | Multi-vendor, cloud, IoT unified |
| Incident correlation | Manual, cross-tool | Automated, cross-domain |
| Topology visibility | Partial, siloed | Full-stack, real-time |
| Alert management | Per-tool thresholds | Centralized, context-aware |
| Scalability | Limited by tool architecture | API-driven, horizontally scalable |
Scalability is a practical concern that often gets underestimated during initial deployment. As organizations add cloud workloads, IoT sensors, and remote sites, a vendor-neutral platform scales without requiring additional point tools. The role of dashboards in managing this complexity grows proportionally with network size.
What are the benefits of AI and automation in network dashboards?
AI integration changes the fundamental operating model of network monitoring. AI-powered dashboards predict hardware or software failures before they occur and sometimes execute automatic remediation, which is a fundamentally different posture than waiting for an alert after failure. This proactive approach reduces operational impact in ways that traditional threshold-based alerting cannot match.
Machine learning baselines are particularly valuable in dynamic environments. Static thresholds generate noise because normal traffic patterns shift throughout the day, week, and month. ML-driven baselines adjust dynamically, so alerts fire when behavior genuinely deviates from the expected pattern rather than when traffic spikes during a predictable business event. The result is fewer false positives and higher confidence in every alert that does fire.
Microsoft's IGraph Agent demonstrates what AI-driven reasoning over unified data looks like in practice. Microsoft's AI-powered Infrastructure Graph links topology, telemetry, and incident context in one interface, providing near-real-time incident reasoning and proactive problem detection. The agent does not just surface an alert. It reasons over the full topology and telemetry context to identify root cause and recommend or execute a response.
Pro Tip: Use AI-driven alert grouping to suppress child alerts when a parent cause is identified. A single BGP session drop can generate dozens of downstream alerts. Grouping them under one incident record keeps your operations queue clean and your team focused on resolution rather than triage.
Automation capabilities that deliver the most measurable impact include:
- Automated device discovery and inventory updates when new hardware joins the network
- Configuration compliance checks that flag drift from approved baselines without manual audits
- Intelligent ticket routing that assigns incidents to the right team based on device type and alert category
- Automated runbook execution for common fault scenarios, reducing mean time to repair
Unified monitoring platforms that combine these automation capabilities with AI-driven analytics are the architecture pattern that separates high-performing operations teams from those still fighting alert fatigue.
How do integrated dashboards support security and compliance?
Security operations benefit directly from the same unified data model that improves network operations. Security analysts spend disproportionate time assembling data across fragmented systems, limiting investigation speed and effectiveness. Even organizations that have invested in SIEM and SOAR platforms find that analysts still function as manual integration layers between incompatible data sources. An integrated network dashboard eliminates a significant portion of that assembly work.
Real-time detection of anomalous traffic becomes more accurate when the dashboard correlates network behavior with topology context. An unusual spike in east-west traffic between two servers means something different depending on whether those servers are in the same subnet, connected through a firewall policy, or communicating across a trust boundary. Topology context turns a raw alert into an actionable security signal.
Centralized logging and reporting make audit preparation for compliance frameworks like PCI-DSS and FISMA significantly less painful. When all network event data is organized in one place rather than scattered across multiple tools, generating the evidence packages that auditors require becomes a reporting task rather than a multi-week data collection project.
Specific security and compliance capabilities that integrated dashboards deliver:
- Unified event logs across all network domains, retained in a single queryable store
- Role-based access controls that limit dashboard visibility to authorized personnel
- Automated compliance reporting mapped to specific framework controls
- Proactive threat detection through behavioral baselines and anomaly scoring
- Reduced exposure time because organizations without full-stack observability are nearly twice as likely to experience high-impact outages weekly compared to those using integrated solutions
What steps should organizations take to create unified network dashboards?
Building an effective integrated monitoring platform requires a structured approach. Skipping the assessment phase is the most common mistake, and it leads to dashboards that look unified but still have blind spots because key data sources were never onboarded.
- Audit your current monitoring stack. Document every tool, every data source, and every gap. Identify where correlation currently requires manual effort.
- Define your data sources and integration requirements. Map out all vendors, protocols, and APIs in your environment. Prioritize SNMP, NetFlow, syslog, REST API, and streaming telemetry support.
- Prioritize scalability and hybrid cloud support. Your platform must handle on-premises infrastructure, cloud workloads, and IoT devices under a single data model.
- Evaluate AI and automation capabilities. Look for ML-driven anomaly detection, automated discovery, and runbook automation. These capabilities determine long-term operational efficiency.
- Design for your team's workflow. Customizable views, role-based dashboards, and drill-down navigation reduce the time engineers spend searching for context during incidents.
- Plan your rollout in phases. Start with your most critical network segments, validate data quality, then expand coverage. A phased approach surfaces integration issues before they affect the full environment.
The step-by-step approach to network visibility matters as much as the platform you choose. Even the best tool delivers limited value without a deliberate onboarding and configuration process.
Key takeaways
Integrated network dashboards deliver measurable operational gains only when they unify topology, telemetry, and incident context into a single low-latency platform with AI-driven correlation.
| Point | Details |
|---|---|
| Unified visibility reduces response time | Correlating topology and telemetry in one platform cuts data access from hours to seconds. |
| Multi-vendor environments require neutral platforms | Vendor-specific tools create silos; centralized dashboards normalize data across all sources. |
| AI automation shifts teams from reactive to proactive | ML baselines and automated runbooks reduce alert fatigue and shrink mean time to repair. |
| Compliance reporting becomes a reporting task | Centralized logging organizes audit evidence for PCI-DSS and FISMA without manual data collection. |
| Phased implementation protects data quality | Starting with critical segments and validating data before expanding prevents blind spots at scale. |
Why integrated dashboards changed how I think about network operations
The shift I have seen in teams that adopt integrated dashboards is not primarily technical. It is behavioral. Engineers who spent years in firefighting mode, jumping between five consoles to piece together what happened, start spending time on capacity planning and architecture review instead. That shift only happens when the platform gives them enough confidence in the data that they stop second-guessing it.
The hardest lesson from multi-vendor environments is that data quality matters more than data volume. I have seen organizations ingest telemetry from every device they own and still miss incidents because the correlation logic was never configured to account for their specific topology. A dashboard that shows everything but explains nothing is just a more expensive version of the fragmented tools it replaced.
The trend I find most significant in 2026 is the move toward near-real-time telemetry as the default architecture, replacing snapshot-based polling. Streaming telemetry from platforms like Cisco IOS-XR and Junos gives AI agents the continuous signal they need to reason accurately. Snapshot architectures will always produce delayed, fragmented insights regardless of how good the dashboard layer is. The infrastructure underneath the dashboard is what determines whether AI-driven reasoning actually works.
The future belongs to teams that treat their monitoring platform as a live knowledge graph of the network, not a collection of charts. That mental model changes what you build, what you configure, and what you ask the platform to do for you.
— Jim
See integrated network monitoring in action with Netverge
Netverge consolidates network visibility, documentation, ticketing, and AI-driven automation into a single platform built for MSPs and multi-location enterprises. Its AI-powered monitoring platform ingests telemetry from multi-vendor environments, correlates events across topology and device context, and surfaces incidents with root cause reasoning rather than raw alerts. Autonomous AI agents diagnose and resolve common faults automatically, reducing the manual workload that slows down operations teams.
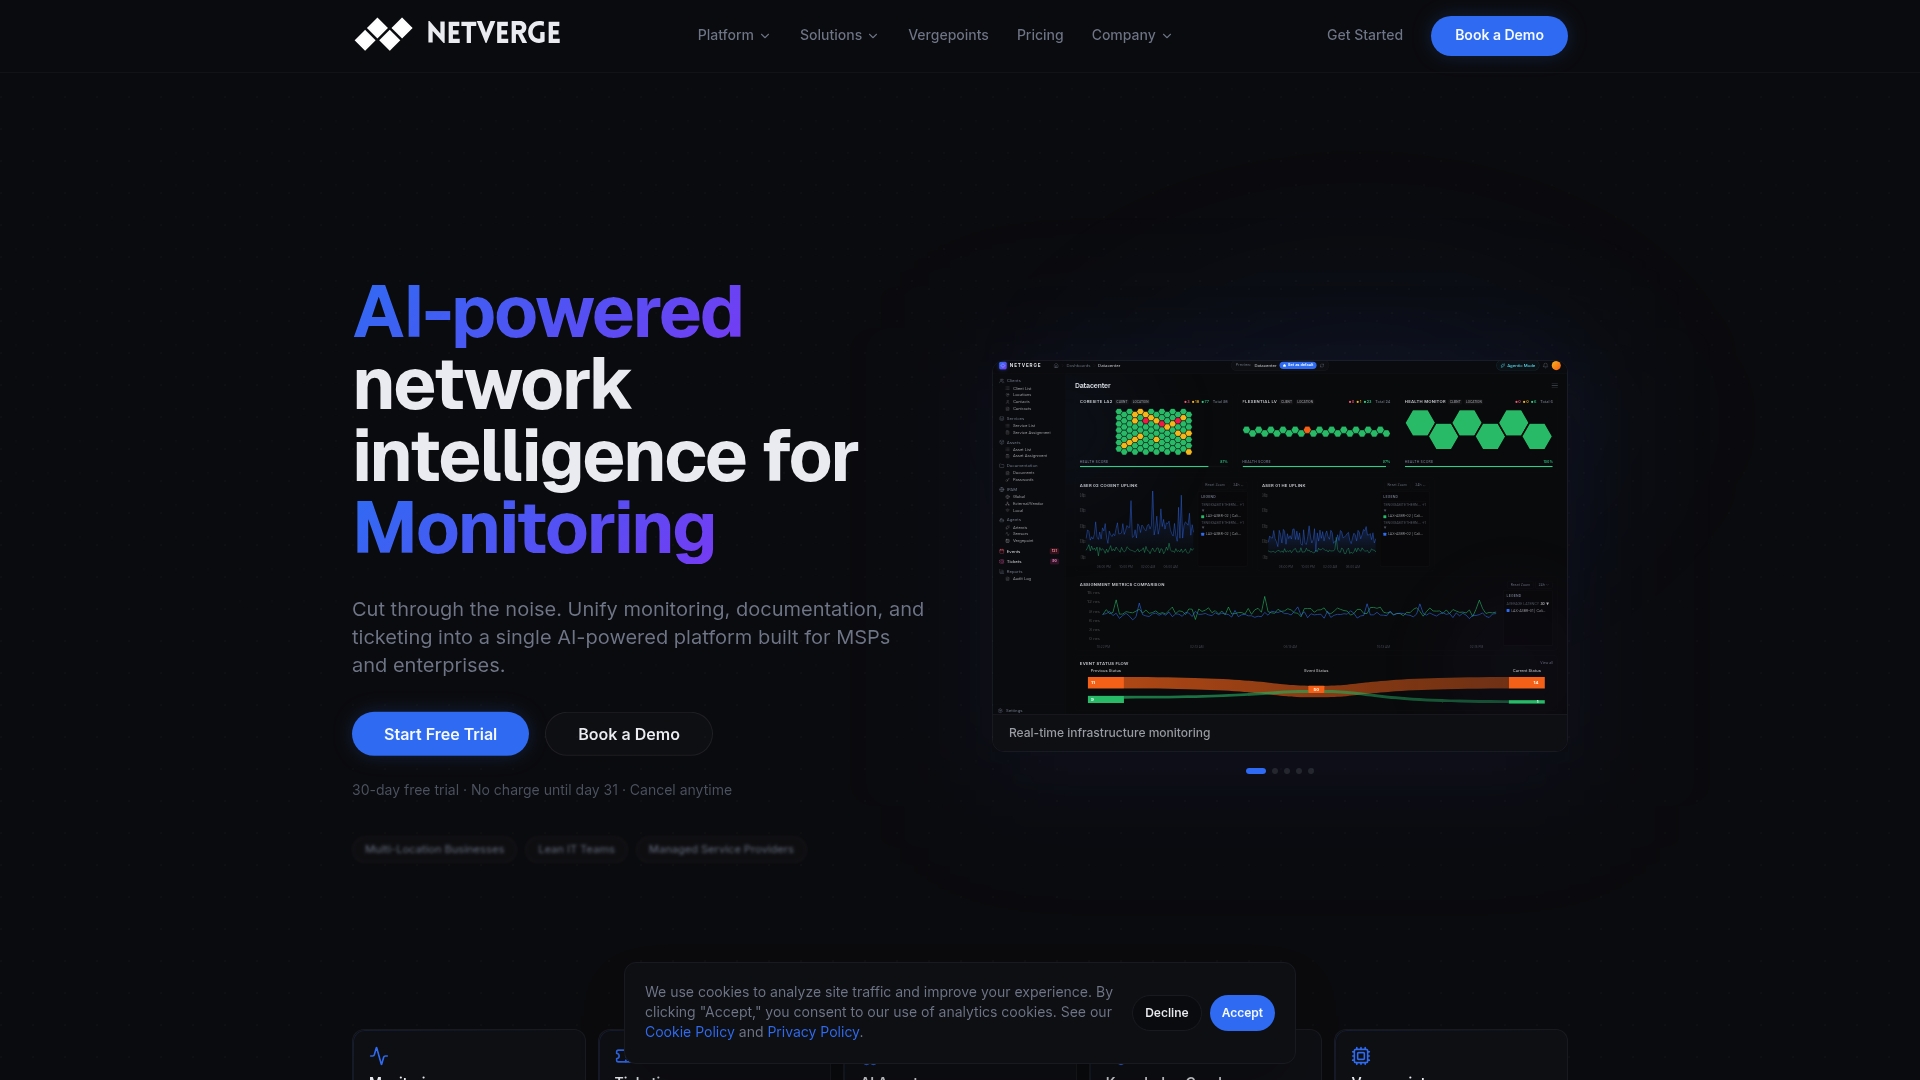
If your team is managing distributed infrastructure across multiple vendors and still context-switching between disconnected tools, Netverge is built to replace that workflow. Request a demo to see how the platform handles your specific environment, or explore the AI agent designer to understand how automated workflows map to your existing runbooks.
FAQ
What is an integrated network dashboard?
An integrated network dashboard is a unified platform that combines data collection, analysis, alerting, and reporting from multiple network sources into a single interactive interface. It replaces separate vendor-specific tools with one view that covers topology, device health, and telemetry simultaneously.
How do integrated dashboards reduce mean time to detect?
By correlating topology and telemetry in real time, integrated dashboards eliminate the manual data assembly that slows incident investigation. Microsoft's Infrastructure Graph demonstrates this by delivering network insights within seconds rather than the minutes or hours required when accessing multiple fragmented systems.
Can integrated dashboards handle multi-vendor environments?
Yes. Vendor-neutral integrated dashboards ingest data through multiple protocols including SNMP, NetFlow, syslog, and REST APIs, normalizing it into a common schema. This allows a single dashboard to cover Cisco, Juniper, Palo Alto, and cloud platforms simultaneously without requiring separate consoles.
How do integrated dashboards support compliance requirements?
Centralized logging and reporting organize all network event data in one queryable store, making audit preparation for frameworks like PCI-DSS and FISMA a reporting task rather than a manual data collection effort across multiple tools.
What is the first step in creating a unified network dashboard?
Audit your existing monitoring stack first. Document every tool, every data source, and every gap where correlation currently requires manual effort. That inventory defines your integration requirements and prevents blind spots during platform deployment.