
A single pane of glass is a governed operational control layer that aggregates and correlates telemetry from your network, security, and service systems into one interface, so teams triage and act without switching tools. It delivers real value only when governance, tagging, and ownership are locked down first. Without that groundwork, it just becomes one more noisy dashboard.
TL;DR:
- Ensuring governance, tagging, and ownership are in place is critical before deploying a single pane of glass to prevent noisy, unusable dashboards.
- Effective normalization of logs, metrics, and security signals during data ingestion is essential to enable accurate querying and correlation across systems.
- A true control plane links alerts to raw data through a correlation engine, drill-down paths, and distinct dashboards for reading versus acting.
- Automation gaps, inconsistent tagging, and single points of ingestion failure are the main obstacles that cause SPOG implementations to falter.
- The fastest benefits apply to network operations, security, service desks, and identity management, especially when pilots are run in parallel with existing tools.
Table of Contents
- What Is a Single Pane of Glass, Really?
- What Features Actually Matter in a SPOG?
- What Benefits Should You Actually Expect?
- Where Do SPOG Projects Actually Fail?
- How Do You Roll Out a SPOG Without Breaking Everything?
- Where Does a Unified View Pay Off Fastest?
- What's the Publisher's Take on Getting This Right?
- See What a Governed SPOG Looks Like in Practice
- Sources
What Is a Single Pane of Glass, Really?
A working single pane of glass monitoring setup pulls from ingestion sources like logs, metrics, traces, events, and security signals, then normalizes them into a common schema. That normalization step is where most projects succeed or fail. Field mapping, consistent timestamps, and ownership tags have to be enforced before anything gets displayed, or you end up with a screen full of data that nobody can query.
The architecture generally follows a repeatable pattern: telemetry receivers sit at the edge, a normalization layer cleans and tags the data, routing boundaries send signals to the right storage type, and a unifying interface sits on top, according to this unified data platform and connectors example that demonstrates data-aggregation approaches and third-party integration patterns.
What separates a true control plane from a passive, read-only dashboard is the correlation layer. This is the part that links a spike in latency to a specific device, a failed login, and an open ticket. That layer needs:
- A correlation engine that connects related events across systems automatically
- Drill-down paths from a summary alert down to raw logs or packet data
- Ownership metadata attached at ingestion, not bolted on later
- A clear separation between dashboards you read and controls you can act on
What Features Actually Matter in a SPOG?
Feature checklists for centralized network monitoring tools tend to bury the few things that actually determine whether the platform works under pressure. Four categories deserve real scrutiny:
- Protocol breadth and resilient collectors. Look for agent-based collection, OTLP support, syslog, and webhook ingestion, so you're not locked out of half your estate.
- Schema and tag normalization. If two teams tag the same service differently, your queries will silently miss half the relevant data.
- Correlation, timelines, and dependency maps. A timeline view that shows what changed right before an incident is worth more than a dozen individual charts.
- Role-based defaults with action links. An alert should link directly into a runbook or a ticket, not just describe a problem in isolation.
Pro Tip: Before evaluating any unified monitoring platform on features, audit your current tag taxonomy. A platform with excellent correlation logic still fails if your source systems feed it inconsistent service names.
What Benefits Should You Actually Expect?
The clearest gain from centralized network monitoring is speed at the moment an incident starts. When telemetry arrives already correlated, an on-call engineer spends less time hunting across five browser tabs and more time acting on a diagnosis.
Teams typically see gains in a few concrete areas:
- Faster mean time to acknowledge (MTTA) and mean time to resolve (MTTR), since context arrives with the alert instead of after a manual search
- Fewer tool switches per incident, which cuts the cognitive overhead of context switching
- Cleaner, consolidated audit trails that make compliance reporting far less painful during a review
The evidence behind the claim: A case study on centralized IT monitoring found that aggregation-based architectures reduced the number of personnel required for initial incident triage. That's not a marketing promise. It's a documented staffing effect of moving from fragmented tools to one correlated view.
For a deeper look at how unified visibility changes day-to-day operations, see this breakdown of benefits of unified dashboards for IT leaders.
Where Do SPOG Projects Actually Fail?
Every unified network monitoring rollout eventually runs into the same set of obstacles, and most of them have nothing to do with the dashboard itself.
The biggest one is what practitioners call the automation gap. Somewhere between 20% and 40% of the applications in a typical environment lack the APIs or SCIM support needed for automated remediation. You can see an alert perfectly and still have no automated way to act on it, because the underlying app was never built to accept programmatic commands. Some vendors compound this by gating SCIM access behind their highest-priced tiers, a practice sometimes called a "SCIM tax."
Beyond automation, expect these failure modes:
- Duplicate metrics and inconsistent tagging inherited from years of disconnected tools, which produce alert noise instead of clarity
- No resilience plan, meaning a single ingestion outage blinds the entire pane at once
- Multi-tenant data bleeding across customer boundaries for MSPs, which is both an operational and a legal problem
Redundant ingestion paths, local buffering during outages, and fallback notification channels aren't optional extras. They are what keeps a single dependency from becoming a single point of failure.
How Do You Roll Out a SPOG Without Breaking Everything?
Governance comes first, always. Skipping this step is the single most common reason unified network monitoring dashboards get abandoned within a year. Centralized governance practices call for standardizing alert policies, severity definitions, and escalation rules before any tool decision gets made.
- Define ownership and naming conventions first. Every service, tag, and severity level needs one owner and one name across every team before data gets unified.
- Pick one high-value workflow to pilot. Incident triage or deployment verification both work well as narrow first projects that prove value fast.
- Choose an integration strategy that matches your estate. Native connectors handle most modern systems; resilient collectors and managed bridges cover the rest, especially apps without SCIM.
- Retire, merge, or rename existing monitors. Map every surviving alert to a specific owner and a specific runbook before it goes live in the new pane.
- Operationalize the pane. Set role-based defaults, escalation rules, and a recurring review cadence, or the taxonomy you just built will drift within a quarter.
Pro Tip: Run your pilot workflow in parallel with your existing tools for two to three weeks before cutting over. Discrepancies between the old and new views usually expose a tagging gap, not a platform bug.
For guidance on connecting distributed environments during this phase, this piece on network infrastructure monitoring strategies covers integration patterns in more depth.
Where Does a Unified View Pay Off Fastest?
Four teams tend to see the fastest, clearest return from centralized network monitoring, each for a different reason.
- Network operations gets device health, topology maps, and edge visibility down to the individual switch port, especially with hardware sensors deployed on site.
- Security operations benefits from correlated alerts that tie an endpoint anomaly to an identity event happening at the same moment.
- Service desks resolve tickets faster because linked incidents carry cross-system context instead of forcing an agent to reconstruct the timeline manually.
- Identity teams catch orphaned accounts, expired access, and unused licenses that would otherwise sit unnoticed for months.
For network teams specifically, understanding what infrastructure monitoring actually delivers helps set realistic expectations before a rollout starts.
What's the Publisher's Take on Getting This Right?
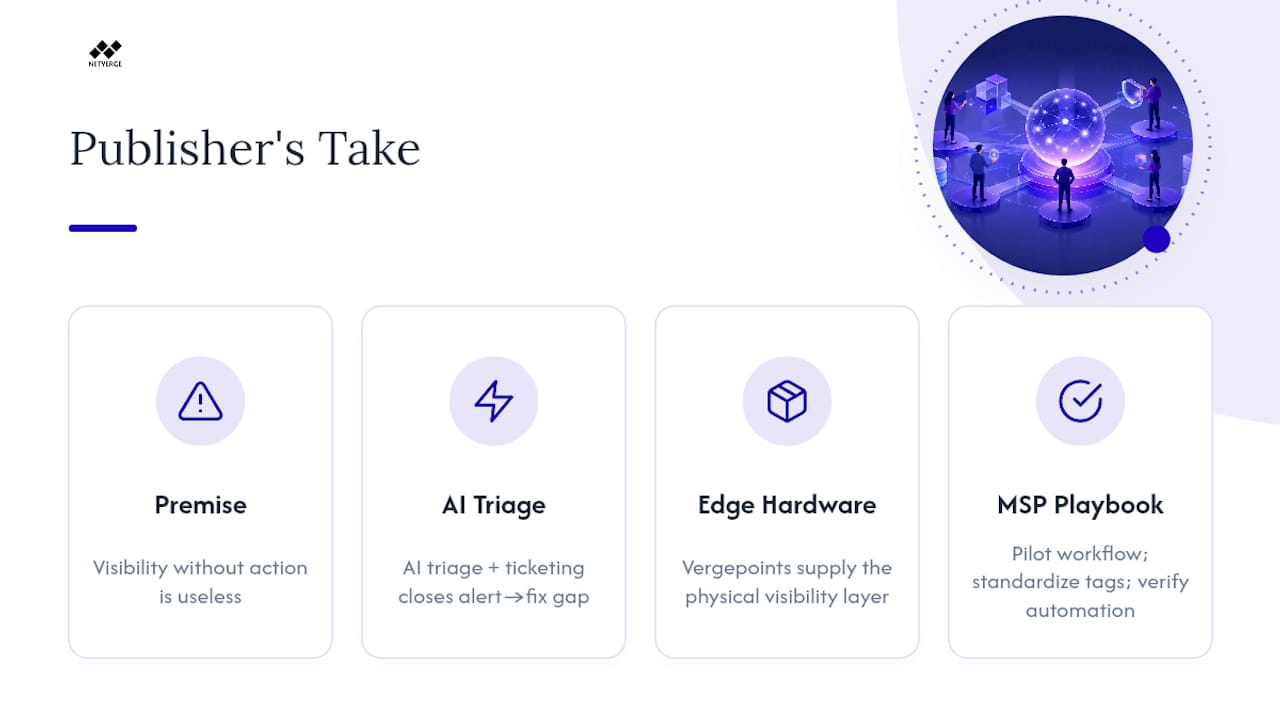
Netverge builds its approach around a simple premise: visibility without action is just a prettier version of the same problem. Its AI-driven triage and integrated ticketing exist to close the gap between "we saw the alert" and "we fixed it," while edge hardware like Vergepoints handles the physical visibility layer that pure software often misses.
For MSPs and multi-site enterprises, the playbook starts small: pilot one workflow, standardize tags before scaling, and confirm automation coverage before promising it to clients.
— Jim
See What a Governed SPOG Looks Like in Practice
One platform combines real-time visibility, AI-assisted triage, and automated ticketing, backed by hardware for on-site edge visibility where software alone falls short.

If your team is still stitching together five tools to answer one incident question, that's the exact gap this platform is built to close. You can see how the pieces fit together on the AI-powered network monitoring platform page, or look at Vergepoints hardware if edge visibility is your immediate pain point. The practical next step is a demo: bring one real workflow, whether it's incident triage or a deployment check, and see how it looks correlated in a single view before you commit to a broader rollout.
Sources
For deeper technical grounding, review the centralized monitoring case study on triage staffing reductions, Dremio's governance framework, and Fluxtail's SPOG architecture guide.