
Incident correlation automatically groups related alerts, logs, traces, and metrics into a single actionable incident instead of dozens of disconnected pages. The immediate payoff is measurable: fewer duplicate tickets, faster mean time to detect (MTTD), and a much shorter path to root cause. Methods like OpenTelemetry trace propagation, service dependency graphs, and platforms like Netverge make this practical at scale, not just theoretical.
TL;DR:
- Combining multiple correlation methods, such as fingerprinting, topology, traces, and ML, produces more accurate incident grouping than relying on a single approach.
- Layering correlation techniques along a pipeline that includes ingestion, normalization, enrichment, and incident creation reduces false merges and enhances root cause visibility.
- Regularly updating dependency graphs and instrumenting services with trace IDs are crucial for maintaining reliable, precise correlation in microservice environments.
- Tracking key metrics like alert-to-incident ratio, incidents-per-alert ratio, and resolution time helps evaluate the effectiveness and prevent over- or under-grouping alerts.
- Prioritizing improved instrumentation, topology accuracy, and human-in-the-loop review arrangements yields better results than focusing solely on ML clustering.
Table of Contents
- What Is Incident Correlation and Why It Matters for ITOps
- Correlation Methods: Fingerprinting, Topology, Traces, Time Windows, and ML
- The Correlation Pipeline: From Raw Alerts to Actionable Incidents
- A Practical Checklist for Rolling Out Correlation
- Tracking Correlation Effectiveness: The Metrics That Matter
- Where Correlation Rules Go Wrong
- How Netverge Applies This Playbook in Practice
- What ITOps Teams Should Prioritize Over the Next Year
- Put Correlation Into Practice With Netverge
- Sources
What Is Incident Correlation and Why It Matters for ITOps
Incident correlation links alerts, logs, traces, and metrics that share a root cause into one incident record. It differs from simple deduplication, which only strips out repeated copies of the identical alert. Correlation goes further: it recognizes that a database timeout, a spike in 500 errors, and a Kubernetes pod restart might all be symptoms of the same upstream failure, even though they arrive from three different monitoring tools.
The operational payoff shows up fast once correlation is working. Teams see fewer pages per shift, faster MTTD because the real trigger surfaces instead of hiding under 40 duplicate alerts, and clearer ownership since the incident record points at a specific service or dependency rather than a wall of noise.
Consider three common scenarios where correlation makes the difference between chaos and clarity:
- A network switch failure cascades into dozens of downstream device alerts, but correlation collapses them into one incident tied to the switch.
- A bad deployment causes latency spikes across five microservices; trace context ties every alert back to the same deploy ID.
- A shared database connection pool exhausts, triggering timeout alerts from unrelated application teams who have no idea they share the same dependency.
Without correlation, each of these becomes ten or more separate tickets. With it, responders see one incident with the actual cause attached.
Correlation Methods: Fingerprinting, Topology, Traces, Time Windows, and ML
No single method handles every incident type well, which is why mature ITOps teams layer multiple techniques rather than betting on one. Here's how the core approaches actually work and where each one earns its keep.
- Fingerprint deduplication hashes alert attributes (host, message, metric name) to collapse repeated instances of the identical alert into one entry. Setup effort is low, but it only catches exact repeats, not related-but-different symptoms.
- Topology and dependency mapping uses a service map to group alerts that share an upstream or downstream relationship. This is where most correlation engines earn their value, but it depends entirely on an accurate, current dependency graph.
- Trace-context correlation via OpenTelemetry ties alerts to the exact request path using trace IDs and consistent resource attributes. It is the most precise method in microservice environments, but it only works where instrumentation coverage is complete.
- Time-window clustering groups alerts that fire within a defined window, useful when topology data is thin. The risk is coincidental grouping. Two unrelated failures within the same five minutes can get merged incorrectly.
- ML-based similarity scoring clusters alerts based on historical patterns and textual similarity, catching correlations that rule-based methods miss but requiring a training period and ongoing model review.
Fingerprint dedup and time-window clustering are cheap to deploy and work reasonably well on legacy infrastructure where topology data is sparse. Trace-context correlation dominates in containerized, microservice-heavy environments where every service already emits OpenTelemetry spans. Topology mapping sits in between, reliable anywhere you can maintain a dependency graph, whether that's a flat network topology or a service mesh.
The strongest setups don't pick one. They layer fingerprint dedup as a first noise filter, add topology or trace correlation for grouping logic, and let ML similarity catch what the rules miss. Automated root-cause analysis treats this as a multi-signal problem across signal type, time, and topology simultaneously, which is exactly why layering outperforms any single method run alone.
The Correlation Pipeline: From Raw Alerts to Actionable Incidents
Reliable correlation depends on a pipeline, not a single clever algorithm. Each stage has a distinct job, and a weak link anywhere downgrades everything after it.
- Ingestion pulls alerts, logs, traces, and metrics from every monitoring source into a common stream. Gaps here mean the correlation engine is working with partial information from the start.
- Normalization standardizes field names, severity scales, and timestamps across tools so a "critical" alert from one system matches a "P1" from another.
- Enrichment attaches context: host metadata, service ownership, recent deploy IDs, and dependency relationships pulled from the topology graph.
- Correlation engine applies fingerprinting, topology traversal, trace matching, and similarity scoring to group related signals into a candidate incident.
- Incident creation packages the grouped signals into a single record with a confidence score and the evidence that produced it.
- Routing and automation sends the incident to the right on-call team or triggers an automated remediation workflow based on service ownership.
Dependency graphs and OpenTelemetry resource attributes carry real weight in stages 3 and 4. A correlation engine without an accurate service map defaults to time-window guessing, which is exactly how symptom-heavy groupings happen: the tool sees ten alerts firing close together and lumps them into one incident even when only three are actually related.
A well-built incident record should present its evidence, not just a verdict. That means trace IDs linking the affected requests, the specific metric breaches that triggered escalation, and the deploy ID if a recent release correlates with the failure window. Automated RCA scoring that shows its reasoning, temporal cohesion, graph traversal path, and a confidence percentage, lets a human responder validate the finding in seconds instead of re-deriving it from scratch.
A Practical Checklist for Rolling Out Correlation
Improving incident correlation is rarely one big project. It's a sequence of smaller fixes, most of which pay off before you touch the correlation engine's actual logic.
- Inventory your signals. List every monitoring, logging, and tracing tool currently feeding alerts, and note which ones lack consistent tagging.
- Standardize naming and tagging. Enforce a consistent service name and environment tag across every tool before correlation logic can trust any of them.
- Propagate trace IDs end-to-end. Instrument services with OpenTelemetry so a request's trace ID survives every hop, from load balancer to database call.
- Verify and update the dependency graph. A topology map that's six months stale will misroute correlation logic toward the wrong upstream service.
- Enable fingerprint dedup first, then layer time-window grouping, then add entity overlap checks (same host, same service, same deploy) before trusting broader clustering.
- Roll out in staging before production. Run new correlation rules against replayed incident data and compare grouping results against what a human on-call engineer would have grouped manually.
- Close the loop with postmortems. Every incident review should ask whether the correlation was accurate, and update topology data or rule thresholds based on the answer.
Rushing straight to machine-learning clustering before tagging and topology are solid is the most common mistake teams make, and it's the one that causes the most rework later.
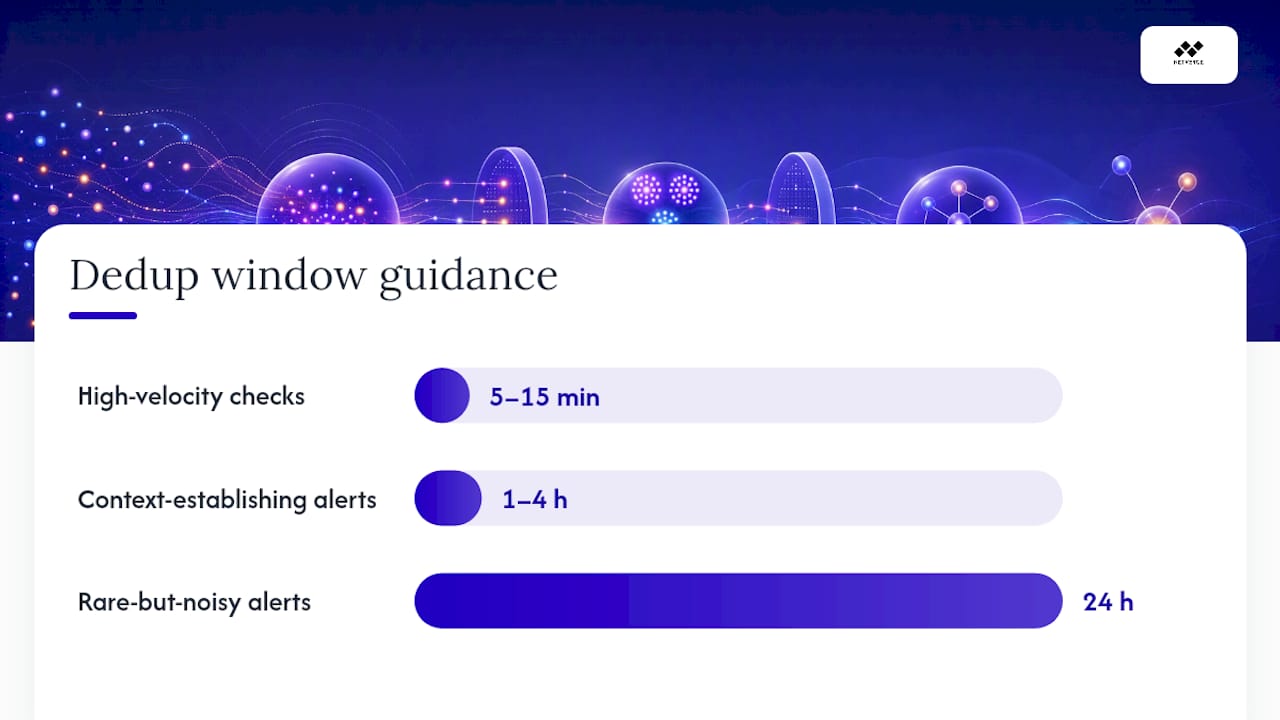
Pro Tip: Set dedup windows per alert type instead of one global value. High-velocity checks work well with 5 to 15 minute windows, context-establishing alerts need 1 to 4 hours, and rare-but-noisy alerts often warrant a full 24-hour window to avoid re-escalating the same known issue.
For teams still relying on manual tagging conventions, reviewing how intelligent alerting practices structure metadata upfront will save real time during the tagging step above.
Tracking Correlation Effectiveness: The Metrics That Matter
Correlation is only as good as its measurable output, and that means instrumenting the pipeline itself, not just trusting that it "feels" quieter.
Three metrics carry the most weight. The alert-to-incident ratio (alerts received divided by incidents created after correlation) tells you how much noise reduction is actually happening. The incidents-per-alert ratio flags the opposite failure: if it creeps toward 1:1, your correlation rules aren't grouping anything. Incident resolution time at the 50th percentile (p50) shows whether faster diagnosis is translating into faster fixes, not just tidier dashboards.
| Metric | What it shows | Watch for |
|---|---|---|
| Alert-to-incident ratio | Noise reduction from correlation | Ratio flattening toward 1:1 signals rules have stopped grouping |
| Incidents-per-alert ratio | Whether grouping is under or over-aggressive | Sudden drops suggest over-merging unrelated alerts |
| Incident resolution time (p50) | Whether correlation speeds actual fixes | No improvement despite fewer incidents means enrichment is thin |
BMC's documentation on intelligent event correlation describes a real deployment collapsing 66 individual events into a single situation, a concrete illustration of how far the alert-to-incident ratio can move once topology-aware correlation is running well.
Build a dashboard that tracks these three numbers weekly, not just during incident reviews. A sudden shift in any of them, especially the incidents-per-alert ratio dropping fast, usually means a recent rule change is either too aggressive or too loose, and it's worth catching before it shows up in an on-call engineer's complaint.
Where Correlation Rules Go Wrong
The most common failure is symptom-heavy grouping: the engine bundles every alert firing near the same time into one incident without tracing which one is upstream. This buries the actual trigger under a pile of downstream noise, and it happens most often when the dependency graph is stale or incomplete.
A few tuning knobs fix most of these problems:
- Set dedup windows per rule instead of one global default, since a database timeout and a login failure don't share the same noise profile.
- Require entity overlap (same host, same service, same deploy ID) before merging two alerts, not just temporal proximity.
- Add confidence scoring to every correlated incident so low-confidence merges route to a human for review instead of auto-closing.
- Route any merge below your confidence threshold to human-in-the-loop review rather than letting the engine decide alone.
Stale topology causes a second, quieter failure: alerts from a service that moved to a new dependency six weeks ago keep correlating against the old one. Test rule changes in staging against replayed incidents first, keep a rollback path ready, and treat every postmortem as a chance to check whether the correlation call was actually right.
Pro Tip: If your incidents-per-alert ratio suddenly drops, check for over-aggressive dedup windows before assuming your correlation logic improved. A quiet dashboard sometimes means alerts are being merged, not resolved.
How Netverge Applies This Playbook in Practice
Some platforms map directly onto the pipeline above rather than treating correlation as a bolt-on feature. Knowledge graphs handle the topology and dependency mapping that correlation engines depend on, keeping service relationships current instead of letting them go stale between manual updates. AI-powered ticket triage takes correlated incidents and routes them automatically, aiming to close the gap between "incident created" and "right team notified."
Some platforms include on-site physical sensors feeding real-time telemetry back into the correlation pipeline, so a switch failure or a local network anomaly may get tied to the same incident record as the downstream application alerts it triggers. That's enrichment and topology working together at the edge, not just in the cloud.
For MSPs managing dozens of client networks, this combination reduces the manual triage work that normally falls on a human dispatcher. Reviewing how AI triage handles network outages shows the same enrichment-then-routing logic covered in the checklist above, applied to real multi-site environments.
What ITOps Teams Should Prioritize Over the Next Year
Automation should assist judgment, not replace it. The teams getting real value from correlation right now are the ones pairing automated grouping with human review on low-confidence merges, not the ones handing full control to an algorithm.
If you're planning pilots for the next 12 to 18 months, put trace context and dependency graph accuracy ahead of flashier ML clustering. Neither works without the other, and both are cheaper to fix than most teams assume.
The tactical move: budget for instrumentation and a postmortem feedback loop before budgeting for a fancier correlation engine. Better inputs beat a better algorithm every time.
— Jim
Put Correlation Into Practice With Netverge
Some platforms support running the practices in this playbook without stitching together multiple separate tools. AI-powered triage can group related alerts using topology and trace signals, while on-site hardware can extend visibility beyond software-only platforms. Knowledge graphs can help keep dependency data current automatically instead of relying on manually updated spreadsheets that become out of date.

The measurable outcome teams report is fewer duplicate tickets reaching human responders, since correlated incidents arrive pre-enriched with the evidence needed to act. For teams that need major-incident routing tied into broader detection and response processes, pairing correlation with managed detection and response practices closes the loop between alert and resolution.
Start with a demo of AI-powered network monitoring to see how correlated incidents look in your own environment before your next on-call rotation.
Sources
- Incident Correlation: How to Auto-Group Related Alerts (2026)
- Automating root cause analysis at scale: Multi-signal correlation for cloud native incident response | CNCF
- What is incident correlation? Meaning, Architecture, Examples, Use Cases, and How to Measure It (2026 Guide) – AiOps School