
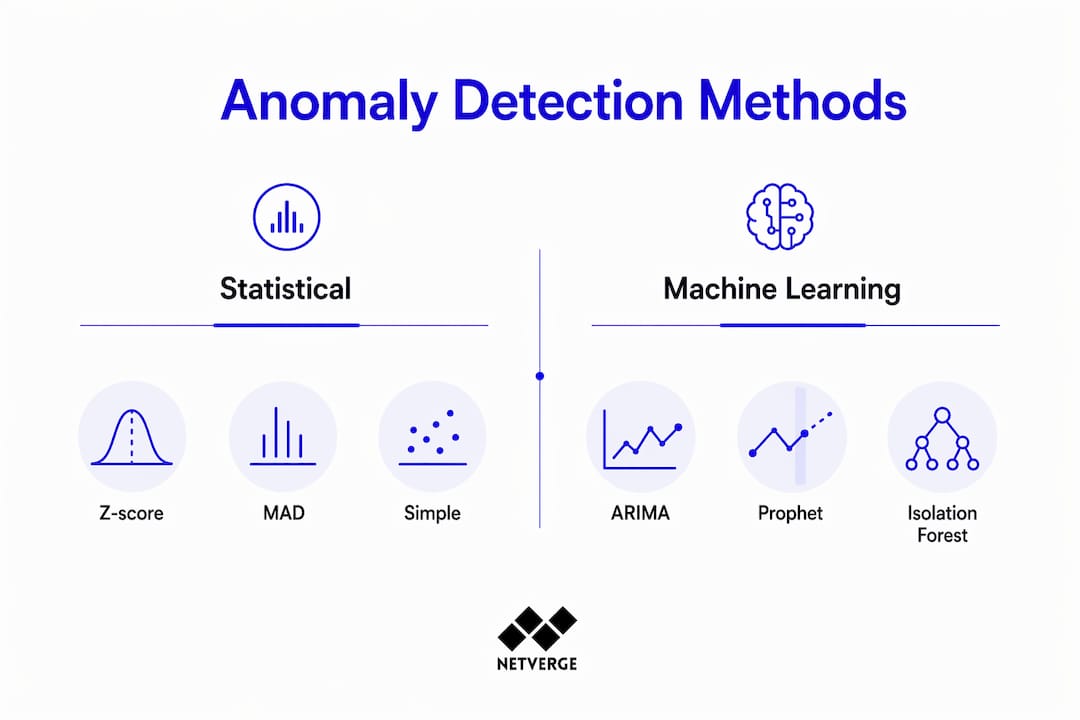
Anomaly detection is defined as the automatic identification of deviations from expected patterns in observability data, including metrics, logs, and traces. Unlike static threshold alerting, it runs continuously and adapts to what "normal" looks like for your specific systems. The field draws on algorithm families ranging from statistical baselines like z-score and Mean Absolute Deviation (MAD) to machine learning methods like Isolation Forest and ARIMA. For data analysts and IT professionals managing complex infrastructure in 2026, understanding how these methods work and where they fit in your monitoring workflow is the difference between catching failures early and chasing alerts after the damage is done.
What is anomaly detection and how does it work?
Anomaly detection is the automated process of comparing observed system behavior against a learned or calculated baseline, then flagging data points that fall outside acceptable bounds. The term covers a broad set of techniques, but all share the same core goal: surface the unexpected before it becomes an outage.
Statistical baseline methods
Statistical methods are the oldest and most interpretable approach. Z-score calculates how many standard deviations a data point sits from the mean. MAD uses the median instead of the mean, which makes it far more resistant to extreme outliers. When your infrastructure metrics are noisy, as they almost always are in production, MAD reduces false positives in ways that z-score cannot.
Time-series and tree-based ML methods
Time-series models like ARIMA and Prophet capture seasonality and trend, making them well-suited for metrics that follow daily or weekly cycles, such as API request rates or database query volumes. Tree-based methods like Isolation Forest and Random Cut Forest work differently: they isolate anomalies by randomly partitioning data, and unusual points require fewer cuts to isolate. These methods handle multivariate detection well, meaning they can flag anomalies that only appear when multiple signals are considered together, not just one metric in isolation.

Univariate vs. multivariate detection
Univariate detection monitors one metric at a time. It is fast and easy to tune but misses correlated failures. Multivariate detection monitors relationships between metrics simultaneously. A CPU spike alone may be normal; a CPU spike paired with a drop in disk I/O and a spike in error logs is almost certainly not. Multivariate methods catch the second scenario where univariate methods stay silent.
Pro Tip: Start with MAD-based univariate detection on your highest-value metrics, then layer in multivariate methods once you have a clean baseline. Trying to do everything at once produces noisy, untrustworthy alerts from day one.
| Method | Best for | Key strength |
|---|---|---|
| Z-score | Clean, low-noise metrics | Simple and fast |
| MAD | Noisy infrastructure telemetry | Resistant to outliers |
| ARIMA / Prophet | Seasonal time-series data | Captures trends and cycles |
| Isolation Forest | High-dimensional, multivariate data | Scales to complex environments |
How does anomaly detection fit into monitoring workflows?
Anomaly detection is the first stage of a diagnostic pipeline, not the last. An alert signal tells you something is wrong. It does not tell you why, where, or how to fix it. That distinction matters enormously in practice.
The full pipeline looks like this:
- Detection. The algorithm flags a data point or pattern as anomalous based on deviation from the learned baseline.
- Correlation. The platform groups related alerts across metrics, logs, and traces to identify whether multiple signals point to the same underlying event.
- Root cause analysis. Correlated signals are mapped to a probable cause, such as a misconfigured deployment, a saturated network link, or a failing disk.
- Response. The team, or an automated agent, acts on the root cause rather than the symptom.
Skipping steps two and three is the most common mistake in IT operations. Teams that treat every anomaly alert as an immediate action item burn out fast and start ignoring alerts entirely.
Static thresholds vs. dynamic baselining
Static thresholds set a fixed ceiling, say 90% CPU, and alert when it is crossed. Dynamic baselining learns expected ranges that account for daily and weekly seasonality, growth trends, and deployment changes. A web server that routinely hits 85% CPU every Monday morning does not need an alert at 86%. Dynamic baselining knows that. Static thresholds do not.
Types of anomalies you will encounter
Three anomaly types appear consistently in IT environments. Point anomalies are single data points that deviate sharply from the norm, such as a sudden latency spike. Contextual anomalies are normal in one context but abnormal in another, such as high traffic at 3:00 AM on a system that is quiet overnight. Collective anomalies are groups of data points that are individually normal but abnormal as a sequence, such as a gradual memory leak that only becomes visible over hours.
Pro Tip: Map your real-time monitoring methods to the anomaly type you are most likely to encounter. Point anomalies need fast detection; collective anomalies need longer observation windows and trend analysis.
What are the key challenges in deploying anomaly detection?
Deploying anomaly detection in production is harder than selecting an algorithm. The real challenges are operational, not mathematical.
- Noisy telemetry. Infrastructure metrics contain natural variance from garbage collection, batch jobs, and scheduled tasks. Algorithms that cannot distinguish signal from noise generate constant false positives. MAD-based monitoring handles this better than z-score in most production environments.
- High cardinality metrics. Monitoring every metric across every microservice produces thousands of signals. Focusing on high-value metric groups reduces alert fatigue and keeps detectors precise.
- Poor log parsing. Log parsing quality directly determines whether downstream anomaly detection succeeds or fails. Inaccurate parsing distorts log templates and makes pattern recognition unreliable, regardless of how sophisticated the algorithm is.
- Serverless and microservices architectures. Stateless, ephemeral compute produces high false positive rates unless context-aware, multi-source data fusion is applied. A function that spins up and down in milliseconds looks anomalous to a model trained on persistent processes.
- Lack of domain context. Treating anomaly detection as context-free leads to failures. An alert that is critical in a payment processing service may be irrelevant in a batch reporting job. Human-in-the-loop feedback and domain expertise are not optional extras.
"Anomaly detection without context is just noise generation. The algorithm tells you a number is unusual. Your team's domain knowledge tells you whether that matters. Both are required for reliable operations."
The most common deployment failure is treating anomaly detection as a plug-and-play solution. It requires tuning, feedback loops, and ongoing model maintenance to stay accurate as your systems evolve.
What practical steps help implement anomaly detection effectively?
Effective implementation starts before you choose an algorithm. Data quality and preparation determine more of your outcome than method selection.
- Fix log parsing first. Invest in structured logging and validate that your parsing pipeline preserves operationally meaningful patterns. Garbage in means garbage out, and no algorithm compensates for malformed log data.
- Choose the right method for your data profile. Use statistical methods for simple, low-noise metrics where interpretability matters. Use ML-based methods like Isolation Forest for high-dimensional or seasonal data where manual tuning is impractical.
- Retrain models continuously. Systems change. A model trained on last quarter's traffic patterns will drift out of accuracy as your infrastructure grows. Schedule regular retraining cycles and monitor for model performance drift.
- Integrate with alerting and ticketing. Anomaly signals need to flow into your incident management workflow. Isolated alerts that sit in a dashboard no one checks are operationally worthless.
- Apply human-in-the-loop feedback. Build a mechanism for engineers to mark alerts as true positives or false positives. That feedback directly improves model accuracy over time.
Pro Tip: Before deploying any detection model in production, run it in shadow mode for two to four weeks. Compare its output against your existing alerts to calibrate sensitivity without affecting your team's workflow.
| Implementation step | Why it matters |
|---|---|
| Structured log parsing | Prevents distorted templates that break detection |
| Method selection by data profile | Matches algorithm strength to your actual data |
| Continuous model retraining | Keeps accuracy as infrastructure evolves |
| Alerting integration | Turns signals into trackable incidents |
| Human feedback loops | Reduces false positives over time |
For a closer look at how these steps apply in real environments, the network anomaly detection examples from Netverge cover seven practical scenarios across different infrastructure types.
Key Takeaways
Anomaly detection works when it combines the right algorithm, clean telemetry, domain context, and a structured diagnostic pipeline that moves from detection through to root cause and response.
| Point | Details |
|---|---|
| Algorithm selection matters | Match MAD, ARIMA, or Isolation Forest to your specific data profile and noise level. |
| Dynamic baselining beats static thresholds | Learned baselines adapt to seasonality and growth; fixed thresholds cannot. |
| Detection is the start, not the end | Alerts must feed into correlation and root cause analysis to produce real resolution. |
| Log parsing quality is foundational | Poor parsing breaks downstream detection regardless of algorithm sophistication. |
| Human context is non-negotiable | Domain expertise and feedback loops are required for reliable, low-noise alerting. |
Anomaly detection in 2026: what I've learned from the field
After years of working with IT teams on monitoring and observability, one pattern stands out clearly. Teams that treat anomaly detection as a finished product fail. Teams that treat it as a living system succeed.
The biggest misconception I see is that deploying an ML-based detector automatically reduces alert noise. It often increases it at first. Models need time, feedback, and tuning to learn what normal looks like for your specific environment. Skipping that phase and going straight to production alerting is the fastest way to destroy your team's trust in the system.
The other thing I would push back on is the idea that AI replaces human judgment here. It does not. AI expands what you can monitor and speeds up detection. But the decision about whether an anomaly is operationally significant still requires someone who understands the business context. A 40% drop in API response time is catastrophic for a customer-facing service and completely irrelevant for an overnight batch job. The algorithm cannot make that call. Your team can.
The direction the field is moving toward, multi-source data fusion, context-aware detection, and tighter integration with intelligent alerting systems, is the right one. The teams that will operate most effectively in the next few years are the ones building those feedback loops now, not waiting until their current approach breaks down.
— Jim
How Netverge brings anomaly detection into your monitoring workflow

Netverge's AI-powered monitoring platform applies dynamic anomaly detection across your full network infrastructure, covering metrics, logs, and traces in a single unified interface. The platform moves beyond static thresholds by learning your environment's normal behavior and flagging deviations with the context your team needs to act. Alerts flow directly into Netverge's ticketing and triage system, so anomaly signals become trackable incidents rather than dashboard noise. For MSPs and multi-location enterprises managing distributed infrastructure, that end-to-end pipeline from detection through to response is what separates proactive operations from reactive firefighting. Request a demo to see how Netverge fits your environment.
FAQ
What is anomaly detection in simple terms?
Anomaly detection is the automated process of identifying data points or patterns that deviate significantly from expected behavior. It flags unusual activity in metrics, logs, or traces so IT teams can investigate before issues escalate.
What are the main types of anomaly detection algorithms?
The main algorithm families are statistical methods like z-score and MAD, time-series models like ARIMA and Prophet, and tree-based methods like Isolation Forest. Each suits different data profiles, noise levels, and infrastructure types.
Why do anomaly detection systems produce false positives?
False positives occur when algorithms lack context, use static baselines, or operate on noisy or poorly parsed telemetry. Using MAD over z-score and focusing on high-value metric groups significantly reduces false positive rates.
How does anomaly detection differ from traditional threshold alerting?
Traditional alerting fires when a metric crosses a fixed value. Anomaly detection learns expected ranges dynamically, accounting for seasonality and growth, so it catches subtle deviations that static thresholds miss entirely.
What is the role of anomaly detection in IT operations?
Anomaly detection serves as the first stage in the diagnostic pipeline, surfacing signals that feed into correlation, root cause analysis, and incident response. It does not resolve incidents on its own but makes the path to resolution faster and more accurate.