Streaming Telemetry vs SNMP: Which to Use and When
Published
- snmp vs telemetry
- streaming telemetry vs snmp
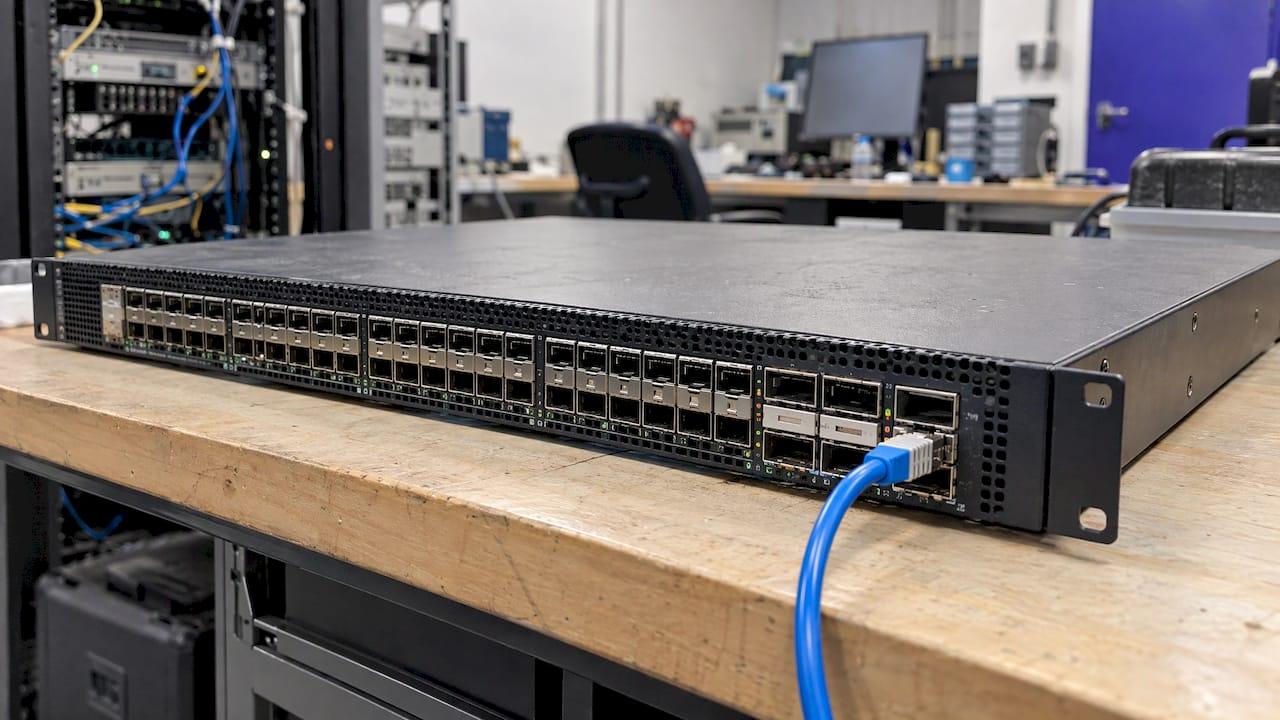
Use streaming telemetry for high-resolution performance data on devices that support it, and keep SNMP for inventory, static state and older gear. Most distributed networks run both for years, so the practical question is not which protocol wins. It is how to collect from both without ending up with two disconnected monitoring stacks. This guide covers how each method works, where each one fits, what to check before you switch, and how to run a hybrid setup.
TL;DR
- SNMP is pull-based: a collector polls devices on a timer. Streaming telemetry is push-based: devices send data to a collector on a schedule or when something changes.
- Telemetry shows short events that polling misses and puts less polling load on device CPUs. SNMP works on almost every device you already own.
- Telemetry needs device support, encrypted sessions with certificates, and a data pipeline that can absorb far more samples.
- For mixed fleets, a combination is the usual answer. Migrate in stages and run both in parallel on the same devices first.
- Netverge brings monitoring, documentation, ticketing and AI agents into one platform, so a mixed fleet stays in one view.
Table of Contents
- How SNMP and streaming telemetry differ
- Update frequency and visibility
- Device load and data quality
- When SNMP is still the right tool
- When streaming telemetry is worth the effort
- What to check before you switch
- Running both: a staged approach
- Using the data for incident diagnosis
- How Netverge fits a mixed fleet
- What it costs to start
- FAQ
- Sources
How SNMP and streaming telemetry differ
SNMP (Simple Network Management Protocol) is a request-and-response protocol. A management server sends a GetRequest, GetNextRequest or GetBulkRequest for values identified by object IDs (OIDs), which are organized in a MIB, the device's catalog of readable data. Devices also send events as traps or syslog. According to TechTarget's comparison, SNMP runs over UDP, which keeps overhead low, and SNMPv3 adds authentication and encryption.
Streaming telemetry reverses the direction. The device pushes data to a collector: counters at a set interval, or state changes the moment they happen. The most common implementation today is gNMI (gRPC Network Management Interface), an open specification from the OpenConfig working group. Netflix's engineering team describes four gNMI operations: Capabilities, Get, Set and Subscribe. Subscribe is the one that carries the stream.
Three practical differences follow from that design.
| SNMP | Streaming telemetry (gNMI) | |
|---|---|---|
| Direction | Collector polls the device | Device pushes to the collector |
| Timing | Fixed poll interval | Sample interval or on-change events |
| Data model | MIB and OIDs | YANG models, often OpenConfig |
| Transport | UDP | gRPC over TCP with TLS |
| Device support | Nearly universal | Newer platforms and software versions |
| Security | Community strings (v2c) or SNMPv3 | Mutual TLS with X.509 certificates |
Update frequency and visibility
This is where the two methods differ most in daily operations.
Microsoft reports that its legacy SNMP polling ran at intervals from five minutes to six hours, while gNMI streaming used a push model at intervals as short as one minute. Microsoft ties the change to finding and fixing outages in minutes rather than hours.
A Swedish field study published in 2024 shows the effect on a single switch. Researchers at Waystream monitored six interfaces on an access switch with SNMP at five-minute sampling and telemetry at ten-second sampling. The higher-resolution telemetry captured traffic peaks more effectively. They also read optical transceiver values (receive and transmit power, bit rate, temperature) and environmental sensors through telemetry only.

Short events are the sharper case. IP Infusion notes that even one-minute SNMP polling misses events lasting seconds, and that transient behavior such as PFC pause storms or ECN marking in high-speed fabrics is invisible to polling. gNMI offers an On-Change mode for state changes and a Sample mode for counters at configured intervals.
A five-minute average can hide a ten-second saturation entirely. If your tickets read "the network was slow for a few seconds, then fine," polling data will not explain them.
Device load and data quality
Polling has a cost on the device. TechTarget explains that the MIB's lexicographical ordering does not match how devices store interface performance data, so answering polls takes extra CPU work. Streaming telemetry sends data at a higher rate with less strain on the device, and it supports event triggers such as threshold breaches or interface state changes.
Netflix's engineering team lists further SNMP limits: data that is largely unstructured, untyped and vendor-proprietary, no inherent reliability on UDP, no source timestamps, and collection that always depends on a strict polling clock. Source timestamps matter in incident diagnosis. When a device stamps the sample, you can correlate events across devices without guessing how much the poll cycle skewed the order.
When SNMP is still the right tool
SNMP remains the practical choice in several situations:
- Older devices. If a switch, UPS, printer or firewall does not support telemetry, SNMP is the only standard option. TechTarget says SNMP suits networks with many older devices.
- Static and inventory data. Serial numbers, slot locations, routing peers and NTP peers change rarely. Polling them at a slow interval is cheap and sufficient.
- Small, stable sites. Where five-minute granularity answers the questions you actually ask, SNMP does the job without new certificates or pipelines.
- Customer-owned equipment. MSPs often inherit gear they cannot upgrade or reconfigure. SNMP is usually the one protocol every device already speaks.
SNMP also gives a clean path to see inside VPN tunnels and remote sites. Our guide to site-to-site VPN monitoring with SNMP shows what that looks like in practice.
When streaming telemetry is worth the effort
Telemetry pays off where timing and volume matter:
- High-speed interfaces and uplinks where bursts and microbursts cause drops that averages hide.
- Fast failure detection. Event-driven updates on interface state changes arrive when the change happens, not at the next poll.
- Large fleets. The Waystream study showed it is feasible to collect streaming telemetry from more than a thousand switches and watch network health continuously, using a pipeline of Kafka, Telegraf, PostgreSQL and Apache Superset. The authors also flag the challenge of many parameters, high collection frequency and large data volumes.
- Anomaly detection. Dense, timestamped data gives analytics more to work with than a five-minute average.
- Optical and environmental health. Transceiver power and temperature trends can show a link degrading before it fails.
The trade-off is volume. At a ten-second interval, one counter produces 8,640 samples per day per device. Multiply that by hundreds of interfaces and many sites, and storage and retention planning become part of the project.
What to check before you switch
These are the checks that decide whether a telemetry rollout goes smoothly.
- Device and software support. Support depends on platform and release. As one example, NVIDIA's Cumulus Linux 5.13 documentation states that switches with the Spectrum 1 ASIC do not support gNMI streaming. Build a per-model, per-version inventory first.
- Dial-in or dial-out. In dial-in, the collector connects to the device. In dial-out, the device connects out to the collector. The same Cumulus documentation describes a gNMI agent on default port 9339 that supports both modes. Dial-out can be easier when sites sit behind NAT or restrictive firewalls, which is common in multi-site and MSP environments.
- Certificates and authentication. The gNMI specification requires the session to be encrypted with TLS, with no fallback to unencrypted sessions, and recommends TLS 1.2 or higher. New connections are mutually authenticated with X.509 certificates. You need a plan for issuing and rotating certificates across every device, and for storing the credentials the Subscribe calls use.
- Data models. TechTarget points out that the large number of vendor-specific YANG models can make analyzing streamed data difficult. Normalize on OpenConfig paths where your platforms support them.
- Collector capacity. TCP-based collectors can use significant memory for receive buffers, depending on the implementation. Size the pipeline for the sample rate you intend to run, not the rate you test at.
- Retention. Decide how long to keep raw high-resolution data and when to roll it up.
Microsoft's engineers advise starting small: run pilots on a few high-value scenarios, expect onboarding issues around vendor software and security controls, and make sure the data storage is in place before turning on real-time telemetry at scale.
Running both: a staged approach
TechTarget concludes that for networks with a mix of old and new devices, a combination of SNMP and telemetry is likely best, and a full move to telemetry is realistic only when every device supports it. A workable sequence for a distributed environment:
- Classify devices into telemetry-capable, telemetry-capable but not yet configured, and SNMP-only.
- Pick a pilot. Choose one site or one device class where fast detection has a clear payoff, such as core uplinks or WAN edges.
- Run in parallel. Keep existing SNMP polling untouched and enable telemetry on the same devices. Compare what each shows during real incidents.
- Assign roles. Telemetry for interface counters, state changes and optics. SNMP for inventory, slow-changing values and unsupported devices.
- Expand by site or device family, not all at once, and review storage growth at each step.
- Keep a single view. Whatever the transport, the result should land in one place where an operator can see the alert, the device, the site and the documentation together.
The last step is where fragmented toolsets hurt most. If SNMP alerts live in one tool, streaming dashboards in another and tickets in a third, the person diagnosing an incident does the correlation by hand. For more on the protocol choices around this, see our comparisons of gNMI vs NETCONF and NETCONF vs SNMP.
Using the data for incident diagnosis
Better data shortens diagnosis only when it reaches the right person with context. A practical diagnosis workflow looks like this:
- Detect. A threshold breach or interface state change raises an alert. With telemetry the alert can fire within seconds. With SNMP it fires at the next poll.
- Scope. Identify which site, client and upstream or downstream devices are affected.
- Correlate. Line up the alert with recent changes, neighboring device state and documentation: circuit IDs, ISP contacts, device roles.
- Triage. Route the ticket with that context attached, so the first responder does not start from zero.
- Act. Apply the fix, and record what was done.
For automation, keep a clear rule: diagnostic steps that only read state can run automatically, while anything that changes configuration should require human approval and leave an audit trail. Whichever platform you use, confirm in its current documentation which automated actions it supports and which are still planned, and set approval requirements before enabling them.
Passive telemetry and active probes also complement each other for quality-of-service work. Our article on QoS monitoring with passive telemetry and probes covers how that cuts false alarms.
How Netverge fits a mixed fleet
Netverge is a unified network monitoring and management platform for MSPs and multi-location enterprises. It combines real-time infrastructure monitoring, anomaly detection, network documentation, AI-powered ticketing and triage, knowledge graphs and autonomous AI agents in one interface, so the data from different devices and sites does not scatter across separate tools. Multi-tenant management and role-based access support the MSP model of many clients under one roof.
For on-site visibility, Vergepoints provide edge hardware, and the platform includes 28+ intelligent sensors. You can read how the sensors cover different monitoring needs in 24 specialized sensors for complete network visibility, or see the broader AI-powered monitoring and observability overview. For the wider design questions, our guide to network infrastructure monitoring and management strategies is a good companion.

What it costs to start
The Starter Package is $299 per month. Hardware Vergepoints are $49 per month per device, and a Software Vergepoint is $29 per month per Vergepoint. Growth add-ons are $100 per month each for 100 additional monitoring sensors, 100 additional clients, 100 additional sites, 10 additional AI agents, or 500GB of storage. The full list is on the pricing guide, and the pricing calculator estimates a monthly total for your site and client counts.
To see how a mixed fleet looks in one console, start a free trial. Before you rely on a specific protocol or integration, confirm it against Netverge's current product documentation.
FAQ
Does streaming telemetry replace SNMP?
Not completely, and not soon for most networks. Streaming telemetry is better for high-resolution performance data, but SNMP is supported on far more existing devices. TechTarget notes that a full switch is possible only when every device supports telemetry, so mixed environments typically use both.
Is SNMP polling too slow for modern networks?
It depends on what you need to see. Microsoft reports legacy polling intervals from five minutes to six hours. That is fine for inventory and slow trends, but it misses events lasting seconds, such as bursts and brief link flaps.
Is streaming telemetry secure?
The gNMI specification requires TLS-encrypted sessions with no fallback to unencrypted connections, and uses X.509 certificates for mutual authentication. The operational work is issuing and rotating certificates across all devices. SNMPv3 adds authentication and encryption to SNMP, while older SNMPv2c relies on community strings.
Can I run SNMP and streaming telemetry on the same device?
Yes. Running them in parallel for a trial period is a common way to validate telemetry before relying on it. Keep SNMP polling as it is, enable telemetry on the same devices, and compare both during real incidents.
What is the difference between SNMP traps and streaming telemetry?
Traps are event notifications a device sends when something happens, but they carry limited, unstructured detail and travel over UDP. Streaming telemetry delivers structured, timestamped data continuously or on change, so you get both the event and the surrounding counters.
Sources
- TechTarget: Telemetry vs. SNMP: Which is better for network management?
- Netflix Technology Blog: Simple Streaming Telemetry
- Microsoft Inside Track: Boosting network performance with real-time telemetry
- Microsoft Inside Track: Finding and fixing network outages in minutes, not hours
- Waystream, SNCNW 2024: On the use of streaming telemetry data for network health monitoring and anomaly detection
- IP Infusion: gNMI vs SNMP: Streaming Telemetry in OcNOS
- OpenConfig: gRPC Network Management Interface (gNMI) specification
- NVIDIA: gNMI Streaming, Cumulus Linux 5.13