QoS monitoring continuously measures latency, jitter, packet loss, and class-based throughput so you can verify that delay-sensitive applications meet their service objectives. The first move is practical, not theoretical: inventory the applications that actually matter (voice, video, ERP transactions), map them to explicit service objectives, and start collecting both interface/flow telemetry and active probe data right away.
TL;DR:
- Active probes accurately assess network capacity and delay under ideal conditions but may overlook congestion points visible only through passive telemetry during real traffic.
- Placing monitoring sensors at ingress and egress points captures the most relevant data on congestion, loss, and marking issues where stress usually occurs.
- Baseline data collection over multiple full business cycles before setting thresholds prevents false alarms caused by traffic pattern variations.
- Combining direction-specific latency and jitter measurements with detailed percentile data provides a clearer picture of real-time user experience beyond average metrics.
- Automating correlation between device health, configuration changes, and flow data reduces investigation time and prevents issues like silent marking loss or asymmetric delays from going unnoticed.
Table of Contents
- What QoS Monitoring Measures: Metrics to Collect and How to Interpret Them
- Monitoring Methods: Combining Passive Telemetry With Active Tests
- Operational QoS Monitoring Workflow and Best Practices
- Placement and Architecture: Where to Collect Telemetry
- Troubleshooting Patterns: Classification Failures, One-Way Issues, and Transient Spikes
- How Netverge Applies These Principles
- Choosing Between Probes and Full Telemetry
- Netverge: Turning QoS Monitoring Into a Repeatable Process
- Sources
- FAQ
What QoS Monitoring Measures: Metrics to Collect and How to Interpret Them
QoS monitoring lives or dies on five metrics: latency, jitter, packet loss, throughput, and MOS (or R-Factor). Get the interpretation of these wrong, and a network that looks fine on a dashboard will still generate a flood of user complaints.
Latency comes in two flavors, and mixing them up causes real confusion. Round-trip time (RTT) is easy to measure with a ping, but it hides asymmetric problems. One-way latency, which requires synchronized clocks at both ends, catches issues that RTT averages out. Accurate timestamps matter more than most teams realize here. CISA's guidance on network time synchronization points out that unreliable time sources undermine your ability to correlate events across devices, which makes one-way delay measurements unreliable exactly when you need them most.
Jitter measures the variation in packet arrival timing, not the delay itself. A steady 80ms delay is far less damaging to a VoIP call than a delay that swings between 20ms and 150ms. Most voice codecs tolerate jitter under 30ms comfortably; above that, you start hearing choppy audio even if average latency looks acceptable.
Packet loss needs to be read in context of pattern, not just percentage. Sustained loss points to congestion or a failing link; bursty loss often points to a wireless retransmission storm or a route flap.
Throughput, tracked per traffic class rather than as a single aggregate number, tells you whether your QoS policy is actually doing its job. If your voice class is starving because a backup job got misclassified into the same queue, aggregate throughput numbers will never reveal it.
MOS and R-Factor translate technical metrics into something closer to human experience, but averages here are dangerous. A session with a MOS average of 4.0 can still contain a 20-second stretch that scored 2.5, and that stretch is what the caller remembers.
- Latency: one-way for asymmetric detection, RTT for quick health checks
- Jitter: flag anything consistently above 30ms for real-time voice traffic
- Packet loss: track burst loss separately from sustained loss
- Throughput: measure per DSCP class, not just per interface
- MOS/R-Factor: store the distribution, not just the mean
Pro Tip: Store min, average, max, and at least the 95th percentile for every metric, not just the mean. A network that averages "good" can still be failing your worst 5% of sessions every single day.
Monitoring Methods: Combining Passive Telemetry With Active Tests
VoIP QoS monitoring and video quality monitoring both depend on blending two fundamentally different data sources: what the network is actually carrying, and what a controlled test says the path is capable of carrying.
Passive telemetry watches real traffic without injecting anything new onto the wire. It includes:
- NetFlow and IPFIX for flow-level visibility into who is talking to whom, over which protocol, and how much data moved.
- sFlow for sampled packet-level detail, useful on high-throughput links where full flow export would be too expensive.
- SNMP and interface counters for queue depths, drops, and errors at the interface level.
- RTP/RTCP for session-level jitter and loss reports generated by the endpoints themselves.
- Packet capture for the deepest level of detail, reserved for specific troubleshooting windows rather than continuous collection.
Active testing takes a different approach: it generates synthetic traffic designed to mimic real application behavior. Cisco's IP SLA framework is the most widely deployed example. Its UDP jitter operations for VoIP simulate specific codecs, then calculate jitter, one-way delay, packet loss, and an estimated MOS score, provided a responder is available at the far end.
Here is the catch that trips up a lot of otherwise solid monitoring programs: synthetic tests confirm what a path is capable of, not what it is actually delivering under real load. The IETF's alternate-marking method for measuring loss, delay, and jitter on live traffic exists precisely because probes can miss congestion, queue drops, encryption overhead, and wireless contention that only show up when genuine application traffic is flowing.
The practical pattern that works for most operations teams: run active probes continuously for SLA verification on critical paths, but treat passive telemetry as the ground truth for anything involving actual user experience. If a probe says the path is healthy but user tickets say otherwise, trust the passive data and start digging into flow records for the affected time window.
Operational QoS Monitoring Workflow and Best Practices
A QoS performance evaluation program only works if it follows a repeatable sequence. Skipping steps, especially the baselining step, is the single most common reason teams end up chasing false alarms.
- Define critical applications and service objectives first. Voice, video conferencing, and transactional ERP traffic each need their own latency, jitter, and loss thresholds, mapped explicitly to DSCP markings or traffic classes. Without this mapping, your monitoring data has no way to tell you whether a number is good or bad.
- Deploy collectors and probes at the right points. Flow exporters belong at WAN edges, branch aggregation points, and cloud gateways, anywhere traffic crosses a trust boundary or a bandwidth constraint.
- Baseline before you alert. Collect data per site, per path, per traffic class, and per time of day for at least two full business cycles before setting thresholds. A contact center's 9 AM traffic pattern looks nothing like its 9 PM pattern, and a single global threshold will misfire constantly if you ignore that.
- Alert on persistence and service impact, not on every blip. A single lost ping means nothing. Three consecutive minutes of loss above your threshold on the voice class means something. Route confirmed incidents into your ticketing workflow automatically so nobody has to manually triage a raw metric spike.
- Correlate before you touch policy. Configuration changes, routing table shifts, capacity exhaustion, and device health all need to be checked against the timeline of any QoS degradation before you start editing queue policies.
That correlation step matters more than most teams give it credit for. The RAQMON framework exists specifically because session data, endpoint conditions, and transport-layer counters typically live in separate systems, and QoS investigations stall out when nobody connects them. A device might show clean interface counters while the endpoint itself is CPU-starved and dropping RTP packets internally. Neither dataset alone tells the full story.
Building alerting logic that avoids alert storms takes deliberate design, not just a lower threshold:
- Use time-bucketed persistence checks (three consecutive intervals, not one)
- Suppress downstream alerts when an upstream link is already flagged
- Group correlated alerts by root path rather than firing one per affected session
- Route alerts by service impact severity, not by raw metric deviation
CISA's guidance on communications infrastructure reinforces this same discipline from a security angle: maintain an accurate device inventory, keep configurations versioned, and alert on unexpected configuration drift as rigorously as you alert on performance drift. A queue policy that got silently overwritten during a maintenance window is just as damaging as a failing link.
Placement and Architecture: Where to Collect Telemetry
Network performance monitoring only produces useful answers if the collection points sit where the traffic actually experiences stress. Placing every sensor at the network core and calling it done misses most of the real problems.
Flow exporters and collectors belong at ingress and egress points: WAN edges, internet gateways, cloud on-ramps, branch aggregation switches, and peering points where you hand traffic to a carrier or another autonomous system. These are the locations where congestion, marking loss, and capacity limits actually happen, not the datacenter core where bandwidth is rarely the constraint.
- Ingress/egress at every WAN and internet edge
- Branch aggregation points feeding into SD-WAN or MPLS
- Cloud gateways where on-prem traffic meets a hyperscaler network
- Carrier peering points where DSCP markings frequently get rewritten or dropped
Centralizing this data for cross-site correlation is non-negotiable if you manage more than a handful of locations, but keep short-term local packet captures available too. When a specific incident needs deep forensic detail, pulling from a central log warehouse days later rarely has the packet-level resolution you actually need.
Retention strategy deserves its own attention. Ten-second interim buckets reveal transient quality dips that session averages erase completely; Oracle's session border controller documentation on interim QoS updates makes this point directly, and it applies well beyond SBCs. Keep short-interval granularity for your critical voice and video classes, and roll up to longer intervals for general trending and SLA proof once the short-term forensic window has passed.
Security has to travel alongside all of this. CISA's enhanced visibility guidance recommends carrying telemetry over dedicated, out-of-band management paths rather than mixing it with production traffic, and encrypting that transport end to end. A monitoring system that exposes flow data or SNMP community strings on the same network it's watching is a liability, not a safeguard.
Troubleshooting Patterns: Classification Failures, One-Way Issues, and Transient Spikes
Most persistent QoS complaints trace back to one of three root causes, and each has a specific diagnostic path.
DSCP marking loss across tunnels, VPN boundaries, or service-provider handoffs is one of the hardest failures to catch because it's invisible from either endpoint alone. RFC 6374's packet loss and delay measurement methods for MPLS networks exist partly because marking gets rewritten or stripped so often at provider boundaries. Check marking preservation explicitly at every tunnel ingress and egress point, not just at the network edge.
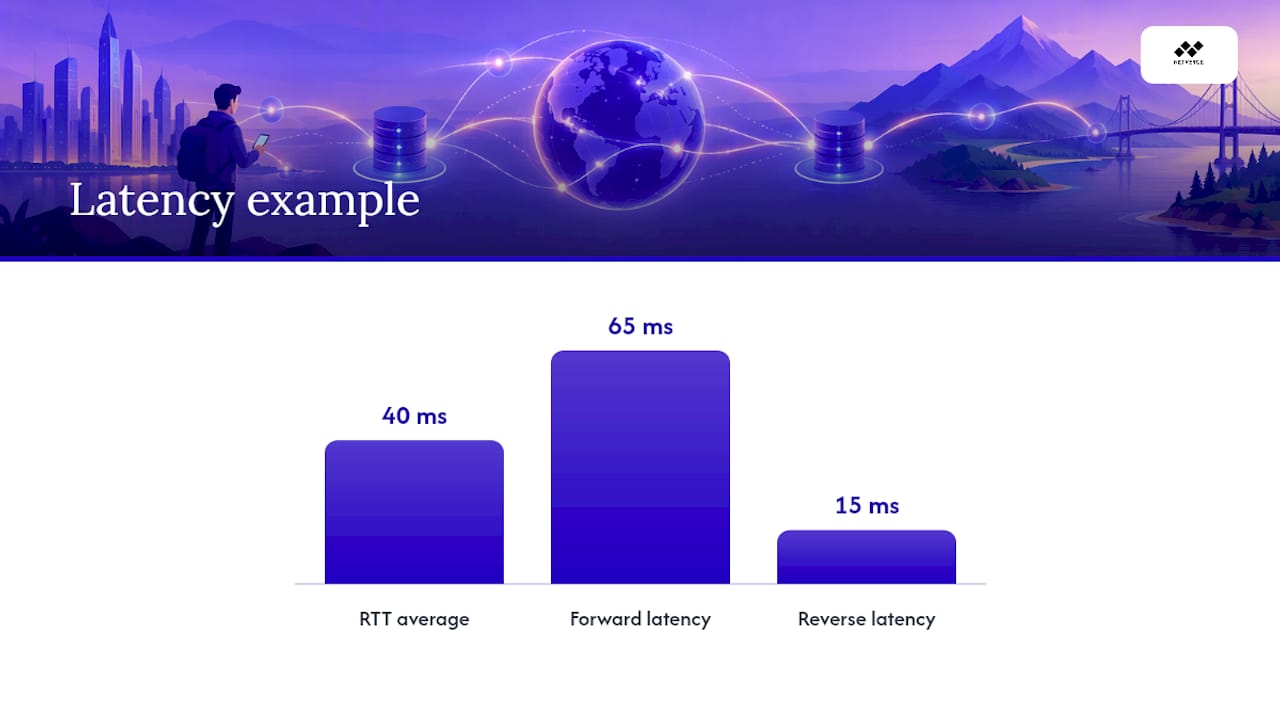
One-way asymmetry hides behind healthy-looking RTT averages constantly. A path can show a perfectly normal 40ms round trip while carrying 65ms in one direction and 15ms in the other, a split that will wreck a voice call while your monitoring dashboard shows green. Measuring both directions independently, and correlating endpoint counters with transport-level data as RAQMON's model recommends, is the only reliable way to catch this.
Transient spikes get buried by session averages almost every time. A five-minute session average can look flawless while containing a genuine 15-second outage.
- Check DSCP/marking integrity at every tunnel and provider boundary
- Measure latency and jitter in both directions, not just as an RTT average
- Review endpoint CPU, memory, and wireless retransmission counters alongside transport metrics
- Inspect percentile and interval data before touching any queue configuration
- Correlate queue drops and routing table changes against the incident timeline
- Confirm root cause with a targeted packet capture before making a policy change
Pro Tip: When a user reports "choppy calls" but your average metrics look clean, pull the 10-second interval data first. The averages are lying to you; the intervals usually aren't.
How Netverge Applies These Principles
Netverge builds this exact workflow into a single platform rather than leaving operators to stitch together flow collectors, SNMP pollers, and separate ticketing tools by hand. Vergepoints, Netverge's on-site hardware sensors, sit at branch and edge locations to capture the interface, flow, and probe data this article recommends, right at the ingress and egress points where problems actually originate.
On top of that telemetry layer, Netverge's AI-powered monitoring platform runs automated baselining across sites and time windows, so thresholds adjust to real traffic patterns instead of relying on one static number for every location. Its autonomous AI agents handle the correlation step that trips up manual investigations, cross-referencing device health, configuration changes, and flow data before an alert ever reaches a technician.
- Consolidated visibility across flow, interface, and probe data in one interface
- Automated baselining per site and per traffic class
- AI-driven alert triage that reduces noise before tickets get created
- Correlation across config, routing, and device health for faster root-cause work
Choosing Between Probes and Full Telemetry
Synthetic probes are enough when you're verifying a specific SLA or confirming that a single path meets a contracted threshold. They're fast to deploy and easy to interpret for a narrow question.
Full passive telemetry becomes necessary once you're dealing with distributed user complaints, multi-tenant visibility requirements, or any situation where you need to see what real traffic experienced, not just what a test packet experienced. Most mature operations settle on a hybrid: continuous probes on a handful of critical paths, selective flow capture everywhere else, and targeted packet captures reserved for active incidents.
— Jim
Netverge: Turning QoS Monitoring Into a Repeatable Process
Building the workflow this article describes by hand, separate flow collectors, a probe scheduler, a ticketing system, and someone stitching the correlation together manually, is exactly the fragmented setup Netverge was built to replace. Netverge consolidates monitoring, alerting, and automated triage into one platform, so the baselining and correlation steps happen continuously instead of during a crisis.

The Starter Package runs $299 per month and gets your core monitoring stack running without piecing together separate tools. If you need on-site visibility at branch locations, Hardware Vergepoints add physical sensor coverage at $49 per month per device, with a software-only option at $29 per month per Vergepoint for sites that don't need dedicated hardware. Teams scaling across more clients or sites can add capacity in blocks to cover additional sensors, clients, or sites; please refer to the pricing guide for details.
If you want to see how the correlation and alerting logic works against your own network before committing, start a free trial and connect it to a live site.
FAQ
Is It Better to Have QoS On or Off?
QoS should stay on for any network carrying voice, video, or latency-sensitive application traffic alongside bulk data. Turning it off removes the prioritization that keeps a large file transfer from starving a phone call, which is the exact problem QoS classes exist to prevent.
How Can You Tell if Your Router Has QoS?
Check the router's administration interface for a section labeled "QoS," "Traffic Prioritization," or "Bandwidth Control," usually under advanced or traffic management settings. Most consumer and enterprise routers manufactured in the last decade support at least basic class-based QoS, though the depth of control varies widely by model.
Which Routers Support QoS?
Most modern consumer routers from major manufacturers include basic QoS controls, typically simple traffic prioritization by device or application type. Enterprise-grade routers and switches go further, supporting DSCP marking, class-based queuing, and the granular policy controls needed for the workflow described in this article.
Does QoS Slow Down Overall Internet Speed?
QoS does not reduce your total available bandwidth; it changes the order in which traffic gets sent when the link is busy. A correctly configured policy can actually make latency-sensitive traffic feel faster by giving it priority, while bulk transfers simply wait slightly longer during congestion instead of degrading everything equally.
What Is the Difference Between Passive and Active QoS Monitoring?
Passive monitoring observes real production traffic through flow records, interface counters, and RTP/RTCP reports without injecting anything new onto the network. Active monitoring, like Cisco's IP SLA probes, generates synthetic test traffic to verify a path's capability, which is useful for SLA checks but can miss congestion that only appears under real application load.