
For network operations and MSPs, "knowledge base software" means one specific thing: a knowledge graph and runbook system embedded directly inside your monitoring platform, wired to real-time telemetry and AI ticket triage. Not a wiki. Not a help center. A living, executable documentation layer that turns alert data into automated action.
The recommended approach: choose a platform with a knowledge graph, executable runbook hooks, real-time telemetry enrichment, multi-tenant RBAC, and open APIs. Then run a focused pilot to validate fit before committing to a full rollout.
Start here — your next 48–72 hours:
- Identify your pilot scope: 1–3 customer sites or internal environments, one device class, top 5 alarm types.
- Pick three KPIs to track: mean time to repair (MTTR), ticket deflection rate, and automation run rate.
- Secure sandbox credentials and a baseline telemetry export from your PSA or RMM.
Key Takeaways
An integrated knowledge graph with executable runbooks and AI triage is the architecture that separates reactive NOC operations from automated, scalable MSP service delivery.
| Point | Details |
|---|---|
| Define scope before day one | Limit the pilot to 1–3 sites, one device class, and five alarm types to get clean KPI data. |
| Require adapter pattern docs | Ask vendors for a sample device schema mapping before procurement to confirm telemetry normalization. |
| Automate low-risk tasks first | Start with high-frequency, low-risk runbooks to prove integration value before touching complex procedures. |
| Measure three KPIs | Track MTTR, ticket deflection rate, and automation run rate from baseline through the full pilot window. |
| Netverge as the pilot platform | Netverge's knowledge graph, Vergepoints hardware, and multi-tenant RBAC align directly with the MSP checklist above. |
Table of Contents
- What does an integrated knowledge graph and runbook system actually do?
- What capabilities must your vendor actually deliver?
- Runbook authoring, validation, and automation best practices
- How do the knowledge graph, telemetry, and AI triage connect?
- Security, governance, and compliance checks before production
- Pilot to scale: a practical roadmap
- How to measure ROI and which KPIs matter
- An illustrative example: automating a DB schema-change runbook
- Why Netverge fits the MSP checklist
- What operators actually learn after the first pilot
- Netverge offers a structured pilot for MSPs ready to validate
- Sources
What does an integrated knowledge graph and runbook system actually do?
A knowledge graph for network management models your infrastructure as entities and relationships: sites, devices, circuits, services, and the dependencies between them. When an alert fires, the graph gives the AI triage engine instant context, including what changed recently, which services depend on the affected device, and what the SLA exposure is.
Runbooks sit alongside that graph as both text procedures and executable automations. A technician searching for "interface flap on Cisco ASR" gets the right runbook immediately, with steps, required permissions, rollback paths, and an automation hook to execute non-destructive checks automatically.
The operational outcomes are concrete. Faster diagnosis because context is pre-attached to every alert. Automated L1 resolutions for high-frequency, low-risk events. Consistent escalations because the runbook defines the decision tree. Reduced tribal knowledge because the procedure lives in the system, not in a senior tech's head.
Typical telemetry sources feeding this layer include NMS polling (SNMP, Netflow), syslog collectors, RMM agents, PSA ticket history, and cloud provider APIs. The knowledge graph contextualizes all of it.
What capabilities must your vendor actually deliver?
Evaluate every vendor against this checklist before procurement.
Core functional requirements:
- Knowledge graph with entity/relationship modeling (site, device, circuit, service, dependency)
- Runbook library supporting both text procedures and executable automation hooks
- Real-time telemetry enrichment tied to graph entities
- API-first architecture with documented adapter patterns
- Multi-tenant support with tenant isolation for MSP environments
- RBAC with fine-grained roles, audit logs, and SSO/SAML
- Low-latency integrations with your NMS, RMM, and PSA
Operational requirements:
- Version control for runbooks (Markdown in Git is the standard; GitLab runbooks demonstrate this pattern)
- Change-management integration so runbook edits tie to change tickets
- Natural-language search across the knowledge base
- ML-aided content ranking so the most relevant runbook surfaces first
Non-functional requirements:
- Event throughput at scale (events per second your fleet generates at peak)
- Data residency controls for U.S. compliance needs
- Emergency break-glass access with time-bound elevation and dual-approval logging
Pro Tip: Require vendor-provided adapter pattern documentation and a sample device schema mapping for at least one vendor in your fleet. A vendor who cannot produce this in a pre-sales call will struggle to normalize your telemetry in production.
For multi-vendor MSP fleets, the adapter pattern is the architectural linchpin: a common device schema with per-vendor adapter modules lets you add new hardware without rewriting downstream workflows. AWS Systems Manager Automation compatibility is worth verifying explicitly, since many teams use it for cloud-adjacent runbook execution.
Runbook authoring, validation, and automation best practices
Every runbook must open with its desired outcome, not its title. A technician under pressure at 2 AM needs to know in one sentence whether this is the right procedure. After that, the structure follows AWS Well-Architected guidance: preconditions, exact step list, required permissions and tools, error handling, rollback path, escalation criteria, owner, and last-updated date.
INOC's NOC runbook anatomy adds a critical requirement: the runbook must be the single source of truth, including links to monitoring tools, contact lists, and an alarm-to-action guide that maps specific alert signatures to specific procedures. Without that alarm-to-action mapping, the AI triage engine has nothing to anchor its suggestions to.
Validation before publishing:
- Peer-run validation: a second technician executes the runbook cold, without coaching.
- Sandbox test run: execute in a non-production environment and confirm the acceptance criteria are met.
- Publish to a central, version-controlled repository in Markdown so history, diffs, and rollbacks are automatic.
Automation prioritization: start with short, high-frequency runbooks — password resets, interface flap checks, service restarts. These are low-risk, high-volume, and prove value fast. AWS Systems Manager Automation provides a low-code visual designer that converts text runbooks into executable automation documents, which is a practical starting point for teams without dedicated automation engineers. For teams that prefer code-driven definitions, Rubix offers a Python-based runbook library built on Jupyter Notebooks.
Pro Tip: Version your runbooks as code and add a smoke-run check — a short automated test that confirms the runbook's preconditions are met before execution begins. This catches environment drift before it causes a failed automation.
How do the knowledge graph, telemetry, and AI triage connect?
The integration flow has four stages: ingest, enrich, decide, execute.
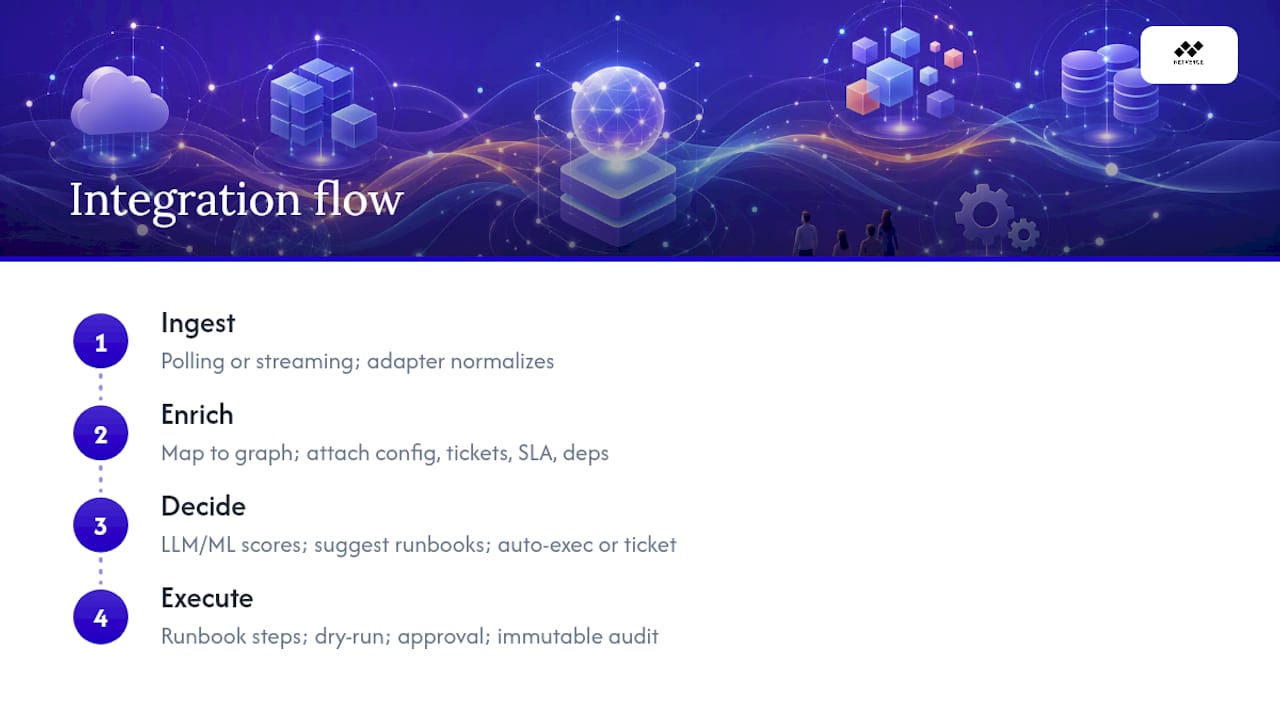
Ingest: events arrive via polling (SNMP, API) or streaming (webhooks, syslog, message bus). An adapter layer normalizes each vendor's payload into a common schema. For multi-vendor fleets, adapter-pattern normalization preserves vendor metadata while exposing a consistent interface to downstream workflows.
Enrich: the normalized event maps to a graph entity. The system attaches recent config changes, open tickets, SLA context, and dependency relationships before the alert reaches the triage engine. An alert that arrives with full context takes seconds to classify; one that arrives raw can take minutes.
Decide: an LLM or ML classifier scores the enriched alert, suggests one or more runbooks, and either auto-executes the top match (for pre-approved low-risk actions) or creates an enriched ticket with the suggested runbook pre-attached for a human operator. AI automation workflows at this stage materially increase auto-resolution rates.
Execute: the automation engine calls the runbook's executable steps. Dry-run mode confirms the action before committing. Destructive steps require an approval gate. Every execution writes an immutable audit record.
Security, governance, and compliance checks before production
Access control is the first gate. Require SSO/SAML, least-privilege RBAC with role definitions scoped to tenant and device class, and time-bound elevation for break-glass scenarios. In MSP environments, tenant isolation must be enforced at the data layer, not just the UI.
Audit and change history must be immutable. Every runbook edit, automation execution, and AI triage decision needs a timestamped, tamper-evident log. This is non-negotiable for incident post-mortems and client-facing SLA reporting.
Data governance covers telemetry retention windows, PII filtering where applicable (some syslog streams contain usernames), and data residency options for U.S. compliance requirements. Confirm where telemetry is stored and whether it can be scoped to a specific region.
Pre-production validation checklist:
- Penetration test of all API endpoints, including automation trigger endpoints
- Review of automation sandboxing and dry-run enforcement
- Dual-approval workflow test for destructive automation steps
- Emergency access playbook documented and tested with the incident response team
Pilot to scale: a practical roadmap
Pilot scoping first. Pick 1–3 customer sites or internal environments. Limit the device class to one category (edge routers, for example). Define your top 5 alarm types and set baseline KPIs: MTTR, automation run rate, and ticket deflection. Structured, centralized documentation with automated discovery reduces onboarding time significantly compared to manual methods, so document your baseline before the pilot starts.
Week-by-week timeline:
- Weeks 0–1: Discovery. Export telemetry samples, map device inventory, confirm API credentials.
- Weeks 1–3: Ingest and map. Connect data sources, build the initial knowledge graph entities, validate enrichment.
- Weeks 2–5: Author runbooks and train AI. Write 5–10 runbooks for the top alarm types, validate each, publish to VCS.
- Weeks 5–7: Validate and harden. Run automation in dry-run mode, peer-review outputs, fix gaps.
- Weeks 8–12: Scale. Expand to additional customers, build adapter modules for secondary vendors, automate onboarding for new sites.
Pilot checklist:
- Baseline KPIs captured from PSA/RMM before day one
- Exportable telemetry samples from each pilot site
- Sandbox credentials confirmed and tested
- Runbook authoring owner assigned with a weekly review cadence
- Rollback plan documented for each automated action
- Stakeholder sign-off criteria defined in writing before the pilot starts
How to measure ROI and which KPIs matter
Track five metrics: MTTR, ticket deflection rate, automation run rate, new-tech onboarding time, and SLA compliance rate. Collect baselines from your PSA and RMM before the pilot starts. Post-pilot, pull the same metrics from the same sources for a clean comparison.
A simple example calculation:
These are illustrative figures using a small sample calculation. Your actual numbers depend on fleet size, labor rates, and automation coverage. The point is to run this calculation with your real baseline data before the pilot ends, so you have a defensible ROI figure for the renewal conversation.
For a deeper look at IT operations efficiency frameworks and MTTR measurement methods, the Netverge blog covers practical templates.
An illustrative example: automating a DB schema-change runbook
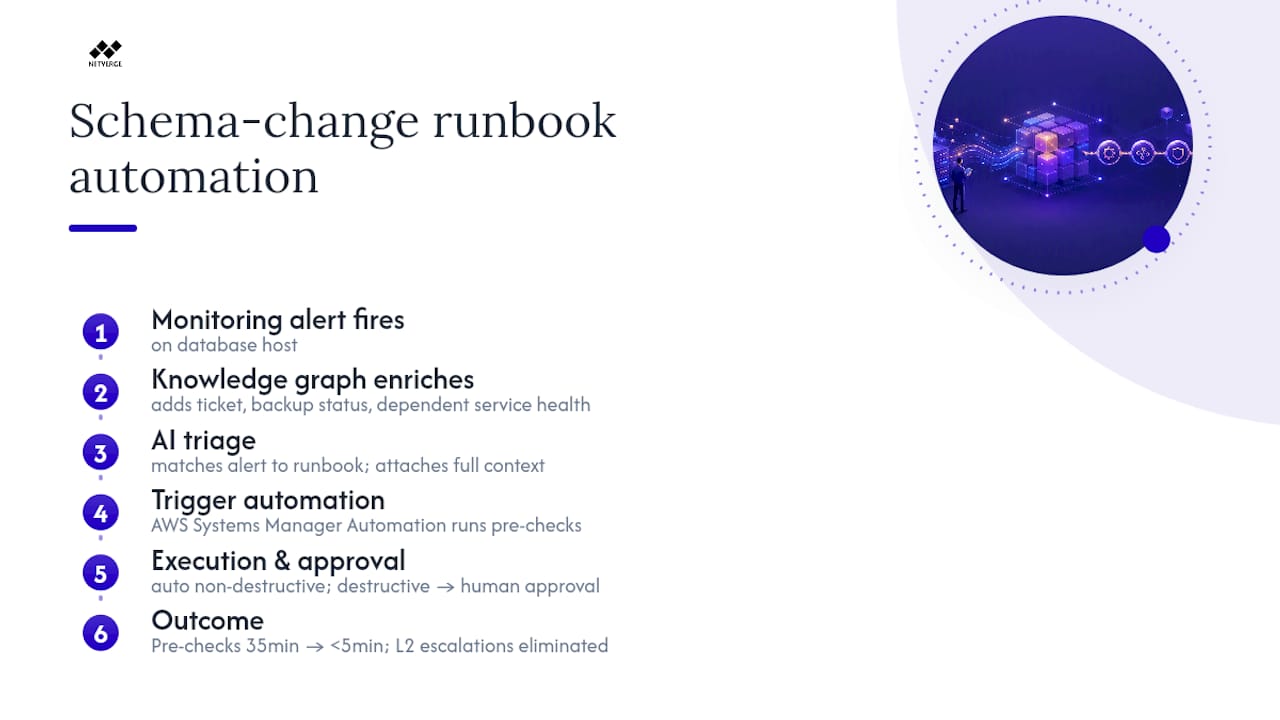
A network operations team managing a multi-site retail client needed to reduce MTTR for database schema-change alerts, which were generating repeated L2 escalations. The team authored a runbook covering the desired outcome (confirm schema change is non-destructive and services are healthy), preconditions (change window open, backup confirmed), step list, and rollback path. They published it to a version-controlled repository in Markdown.
The automation flow: a monitoring alert fires on the database host. The knowledge graph enriches the event with the active change ticket, backup status, and dependent service health. The AI triage engine matches the alert to the schema-change runbook and triggers the automated pre-checks via AWS Systems Manager Automation — confirming backup status, checking dependent service health, and validating the change window. Non-destructive steps execute automatically. The destructive schema-apply step routes to a human approval gate with full context pre-attached.
Outcome: The team reduced time spent on pre-check steps from roughly 35 minutes of manual work to under 5 minutes of human review. Ticket handling time for this alarm type dropped substantially, and escalations to L2 were eliminated for the pre-check phase entirely. This pattern mirrors the AnyCompany-style automation examples in AWS Well-Architected runbook guidance.
Why Netverge fits the MSP checklist
Netverge is built around the exact architecture this guide describes: a knowledge graph, runbook automation hooks, real-time telemetry, and AI ticket triage in a single platform.
Checklist alignment:
- Knowledge graph: Netverge models sites, devices, circuits, and services as graph entities with live relationship mapping.
- Runbook automation hooks: the platform connects runbook procedures to automation execution, with approval gates for destructive steps.
- Edge visibility: Vergepoints hardware deploys on-site to provide physical-layer telemetry where cloud agents cannot reach, feeding 28+ sensor types into the graph.
- Multi-tenant RBAC: purpose-built for MSP environments with tenant isolation, role-based access, and audit logging.
- API integrations: open APIs with documented adapter patterns for NMS, RMM, and PSA platforms.
- AI ticket triage: autonomous agents classify alerts, suggest runbooks, and execute pre-approved automations, reducing L1 ticket volume.
To validate fit, run the pilot on the Netverge monitoring platform with your three chosen KPIs and one customer environment. Request an adapter mapping for your primary device vendor before the pilot starts — this single step confirms the platform can normalize your telemetry before you commit engineering time.
What operators actually learn after the first pilot
The most common mistake MSP leaders make is automating the wrong runbooks first. Complex, high-stakes procedures feel like the biggest wins, but they carry the most risk and take the longest to validate. The teams that see results fastest automate the boring stuff: interface flap checks, service restart confirmations, credential rotation. Those tasks are high-frequency, low-risk, and prove the integration works before anyone touches a production change.
The cultural shift is harder than the technical one. Engineers resist writing runbooks because documentation feels like overhead. The fix is to make the runbook the path of least resistance: if the runbook exists, the automation runs and the ticket closes faster. If it does not exist, the tech handles it manually every time. That asymmetry changes behavior faster than any mandate.
On the trade-off between speed and safety: invest in sandboxing and dry-run enforcement early. A failed automation in production at 3 AM costs more in trust and recovery time than the weeks spent building proper test coverage. The teams that skip this step regret it at the worst possible moment.
Netverge offers a structured pilot for MSPs ready to validate
MSPs that have read this far know what they need: a knowledge graph tied to live telemetry, executable runbooks with approval gates, and AI triage that actually reduces L1 volume. Netverge delivers all three in one platform, with Vergepoints hardware for edge visibility and open APIs that normalize multi-vendor telemetry from day one.

The pilot path is straightforward: pick one customer environment, connect your primary data sources, author 3–5 runbooks for your top alarm types, and measure MTTR and ticket deflection over 8–12 weeks. Netverge's multi-tenant architecture means the pilot runs in isolation without touching other client environments.
Request a pilot at Netverge monitoring and ask for an adapter mapping for your primary device vendor. That single deliverable tells you everything about whether the platform can normalize your fleet's telemetry before you commit to a full deployment.
Sources
- OPS07-BP03 Use runbooks to perform procedures
- Network Device Fleet Management for MSPs: Multi-Vendor Guide
- Documenting a Network: Why Manual Methods Break IT Operations
- Gitlab - Runbooks