Incident Priority Matrix: How to Build and Use One
Published
- incident priority levels
- incident priority matrix
- incident prioritization matrix

An incident priority matrix is a grid that crosses impact (how much of the business is hurt) with urgency (how fast that harm grows) to give every incident a priority level, usually P1 to P4. It replaces "whoever shouts loudest goes first" with a rule your whole team can apply the same way at 3 a.m. as at 3 p.m. This guide shows you how to define the two axes, fill in the grid, attach response targets and keep the levels meaningful.
TL;DR
- Priority equals impact times urgency. Impact is the size of the effect on the business; urgency is how soon that effect becomes serious.
- A 3x3 grid mapped to four levels (P1 to P4) is enough for most MSPs and multi-site IT teams. More levels create debate, not clarity.
- A level only counts if it changes something you can observe: who is paged, who owns the incident, how fast you acknowledge and how often you update.
- Severity describes how bad the technical failure is. Priority decides the order of work. Keep the two fields separate.
- Review the matrix against real tickets every quarter and retire any level that behaves like another one.
Table of Contents
- What an incident priority matrix does
- Impact and urgency, defined
- A working 3x3 priority matrix
- Attach response targets to each level
- Priority versus severity
- Incidents that affect many users, sites or core services
- How to build your matrix in seven steps
- Keeping the matrix honest
- Perspective: priority is only as good as the data behind it
- Put the matrix to work with Netverge
- FAQ
- Sources
What an incident priority matrix does
A prioritization matrix cross-references impact and urgency to assign priority levels to operational events, as the AWS Well-Architected Framework describes it. The point is consistency. Two technicians looking at the same outage should arrive at the same level without a meeting.
In practice the matrix does four jobs:
- Orders the queue. When ten tickets arrive in an hour, the matrix says which one is first.
- Triggers the right response. A P1 pages an on-call engineer; a P4 waits for the next business day.
- Sets expectations. Customers and internal stakeholders know what "high priority" means and when to expect updates.
- Protects scarce people. Senior engineers are pulled in only when the level justifies it.
AWS recommends making the matrix accessible to response teams and communicating the process to stakeholders so expectations are set in advance. A matrix that lives in one manager's head does none of these jobs.
Impact and urgency, defined
The University of Wisconsin's DoIT operational framework defines impact as the effect of an incident on business processes, including how many users are affected and how critical the service is. Urgency is how long it takes before the incident has a significant impact. Together they determine priority.
AWS adds that impact covers the potential effect on business operations and objectives: affected staff or customers, financial impact, reputational damage or injury. It classifies events that touch many staff or customers, carry high financial impact, risk reputational damage or risk injury as high impact.
Impact: score the blast radius
Write impact definitions your team can check against facts, not feelings. For a network environment, useful tests include:
- High: an entire site or a critical service is down or unusable; many users or several customer tenants are affected; a revenue system, voice platform or security control is lost.
- Medium: a department, a single floor or a non-critical service is degraded; a workaround exists but costs time.
- Low: one user or one non-critical device is affected; no business process stops.
For multi-site and multi-tenant environments, add a count. "Three or more sites" or "more than one client" is easier to apply than "widespread."
Urgency: score the clock
Urgency asks how soon the damage gets worse or becomes unacceptable. A failed backup circuit at a branch has low urgency while the primary link works, and high urgency the moment the primary drops. Typical tests:
- High: work has stopped now, or will within the hour; a hard deadline is imminent; the situation is spreading.
- Medium: work continues with a workaround, but the workaround will not hold through the day.
- Low: no deadline pressure; the issue can wait for planned work.
Urgency can change during an incident. Re-score when facts change, and record the reason in the ticket.
A working 3x3 priority matrix
Here is a practical starting grid. It is an example to adapt, not an industry standard.
| Impact \ Urgency | High | Medium | Low |
|---|---|---|---|
| High | P1 | P2 | P3 |
| Medium | P2 | P3 | P4 |
| Low | P3 | P4 | P4 |
The grid is symmetrical on purpose. A low-impact, high-urgency problem (one executive's laptop failing before a board call) lands at P3: it matters, but it should not pull the team away from a broader failure.
What each level means
| Level | Typical meaning | Example |
|---|---|---|
| P1 | Critical: major service or site down, wide impact, no workaround | Core firewall failure takes a headquarters offline |
| P2 | High: significant degradation or partial outage, or a P1-scale risk that has not hit yet | WAN link flapping at a site with a failing backup |
| P3 | Medium: limited group affected, workaround available | Wi-Fi coverage dropping in one department |
| P4 | Low: minor issue, single user or planned-work candidate | Printer VLAN misconfiguration for one user |
Four levels is deliberate. Teams that run five or six usually find that adjacent levels get the same response in practice, which defeats the purpose.
Attach response targets to each level
A level without targets is a label. Targets give it teeth: acknowledgment time, update cadence, escalation path and resolution goal.
A real-world reference point: DoIT handles Priority 1 incidents around the clock, acknowledges them within 10 minutes and targets resolution within four elapsed hours, according to its published framework. It may also engage a Situation Manager when priority warrants it, including a Priority 1 incident still unresolved two hours after diagnosis. Those numbers fit a large university IT organization. Yours should reflect your contracts, staffing and customers.
Use this as a template for your own table, filling in values you can actually meet:
| Level | Coverage | Acknowledge | Update cadence | Escalation |
|---|---|---|---|---|
| P1 | 24/7 | Minutes | Frequent, fixed interval | Incident commander and senior engineer immediately |
| P2 | Extended hours or on-call | Within the hour | Every few hours | Team lead notified |
| P3 | Business hours | Same business day | Daily | Standard queue |
| P4 | Business hours | Next business day | On resolution | None |
Do not copy numbers from another organization. Set them from your SLAs, then measure whether you hit them.
Make each level change behavior
Compliance guidance from Daydream makes a useful point: if Critical and High triggers do not lead to distinct, observable differences such as specific escalation paths, the matrix fails to allocate scarce response resources. Test your own matrix with one question per level: what happens differently when a ticket gets this level? If the answer is "nothing," merge it with its neighbor.
Escalation is where priority becomes action. A clear ICT escalation process with steps for service desks shows how to hand an incident from first line to specialists with named owners at each stage. For a deeper build, see our guide to the service desk escalation matrix.
Priority versus severity
The two terms get mixed up, and the confusion causes bad queues.
- Severity describes the technical seriousness of the failure: what broke and how badly. Many teams use SEV1 to SEV4 scales for this.
- Priority describes the order in which work should happen, based on business impact and urgency.
They often agree, but not always. A total failure of a test lab switch is technically severe and low priority. A minor packet-loss problem on the link carrying a customer's payment traffic is technically mild and high priority. Keep both fields in the ticket, and let the matrix drive priority.
Incidents that affect many users, sites or core services
The hardest calls in network operations involve scale. Use these rules:
- Count affected sites and tenants. Anything touching multiple sites or multiple customers starts at high impact, in line with how AWS treats events that affect many staff or customers.
- Prioritize shared dependencies first. An upstream failure (a core switch, an ISP circuit, an identity provider) generates dozens of downstream alerts. Fix the cause and the symptoms close. Correlating alerts to a single incident prevents ten engineers working ten tickets for one fault. Our write-up on six-stage incident correlation covers the method.
- Validate before you escalate. Not every alert is an incident. Confirm impact first, then assign priority. We explain how in alert vs incident.
- Name a commander for P1. Guidance summarized by OC Security Audit stresses a dedicated incident commander who coordinates priorities and resources, separating decisions from the technical investigation.
If your work touches security incidents, note that national-level scoring is a different exercise. In the US, CISA's National Cyber Incident Scoring System assigns levels from Emergency to Baseline using criteria such as functional impact, recoverability and cross-sector dependency, and its highest level covers imminent threats to wide-scale critical infrastructure. Your internal matrix serves your own operations. Do not treat it as a substitute for that scheme when an incident could meet national criteria.
How to build your matrix in seven steps
- Pull 90 days of tickets. Look at what your team actually escalated and what it regretted.
- Define three impact levels with measurable tests: users, sites, tenants, service tier.
- Define three urgency levels with time-based tests: work stopped, workaround window, deadline.
- Fill the grid and collapse it to four priority levels.
- Write the response targets for each level and the escalation path behind it.
- Wire it into your ITSM or ticketing tool and your SLAs, so priority is calculated from the two fields and alerts fire automatically. This is the integration AWS points to for automating prioritization.
- Publish it to your responders and stakeholders, with two or three worked examples.
We go through the fields a ticket needs in seven fields for prioritizing network incidents.
Keeping the matrix honest
A matrix decays. Customers learn that asking for "P1" gets faster service, and every ticket drifts upward.
Watch for these signs:
- More than about one in five tickets is P1 or P2.
- Priority is edited by hand after creation more often than it is calculated.
- P2 and P3 tickets get identical handling.
- Engineers argue about the level before they start the work.
Fixes that work:
- Lock the calculation. Technicians set impact and urgency; the tool sets priority. Overrides need a reason.
- Review monthly. Sample ten tickets per level and ask whether the level was right.
- Review quarterly. Adjust definitions and targets from the data, and drop levels that do not change behavior.
- Communicate in the same terms. Status updates should use the same level names. Our incident communication templates help with this.
Perspective: priority is only as good as the data behind it
We build network monitoring for MSPs and multi-site IT teams, and the same pattern shows up often. The matrix itself is easy. The weak point is the two inputs. Technicians guess impact because they cannot see which sites, clients and services an alert touches, and they guess urgency because nothing shows what is about to fail next.

That is why we put monitoring, documentation and ticketing in one place. When a ticket opens, the platform should already show the affected site, the client behind it, the dependent services and the recent changes. Impact then becomes a lookup, not an opinion. Correlation matters just as much: if forty alerts are really one upstream fault, the matrix should score one incident, not forty.
Our advice is plain. Keep the grid small, tie each level to a different action, and automate the inputs you can. Use AI triage to suggest impact and urgency from live telemetry, but keep a human accountable for P1 and P2 calls. Read more on how AI triage handles network outages.
— Jim
Put the matrix to work with Netverge
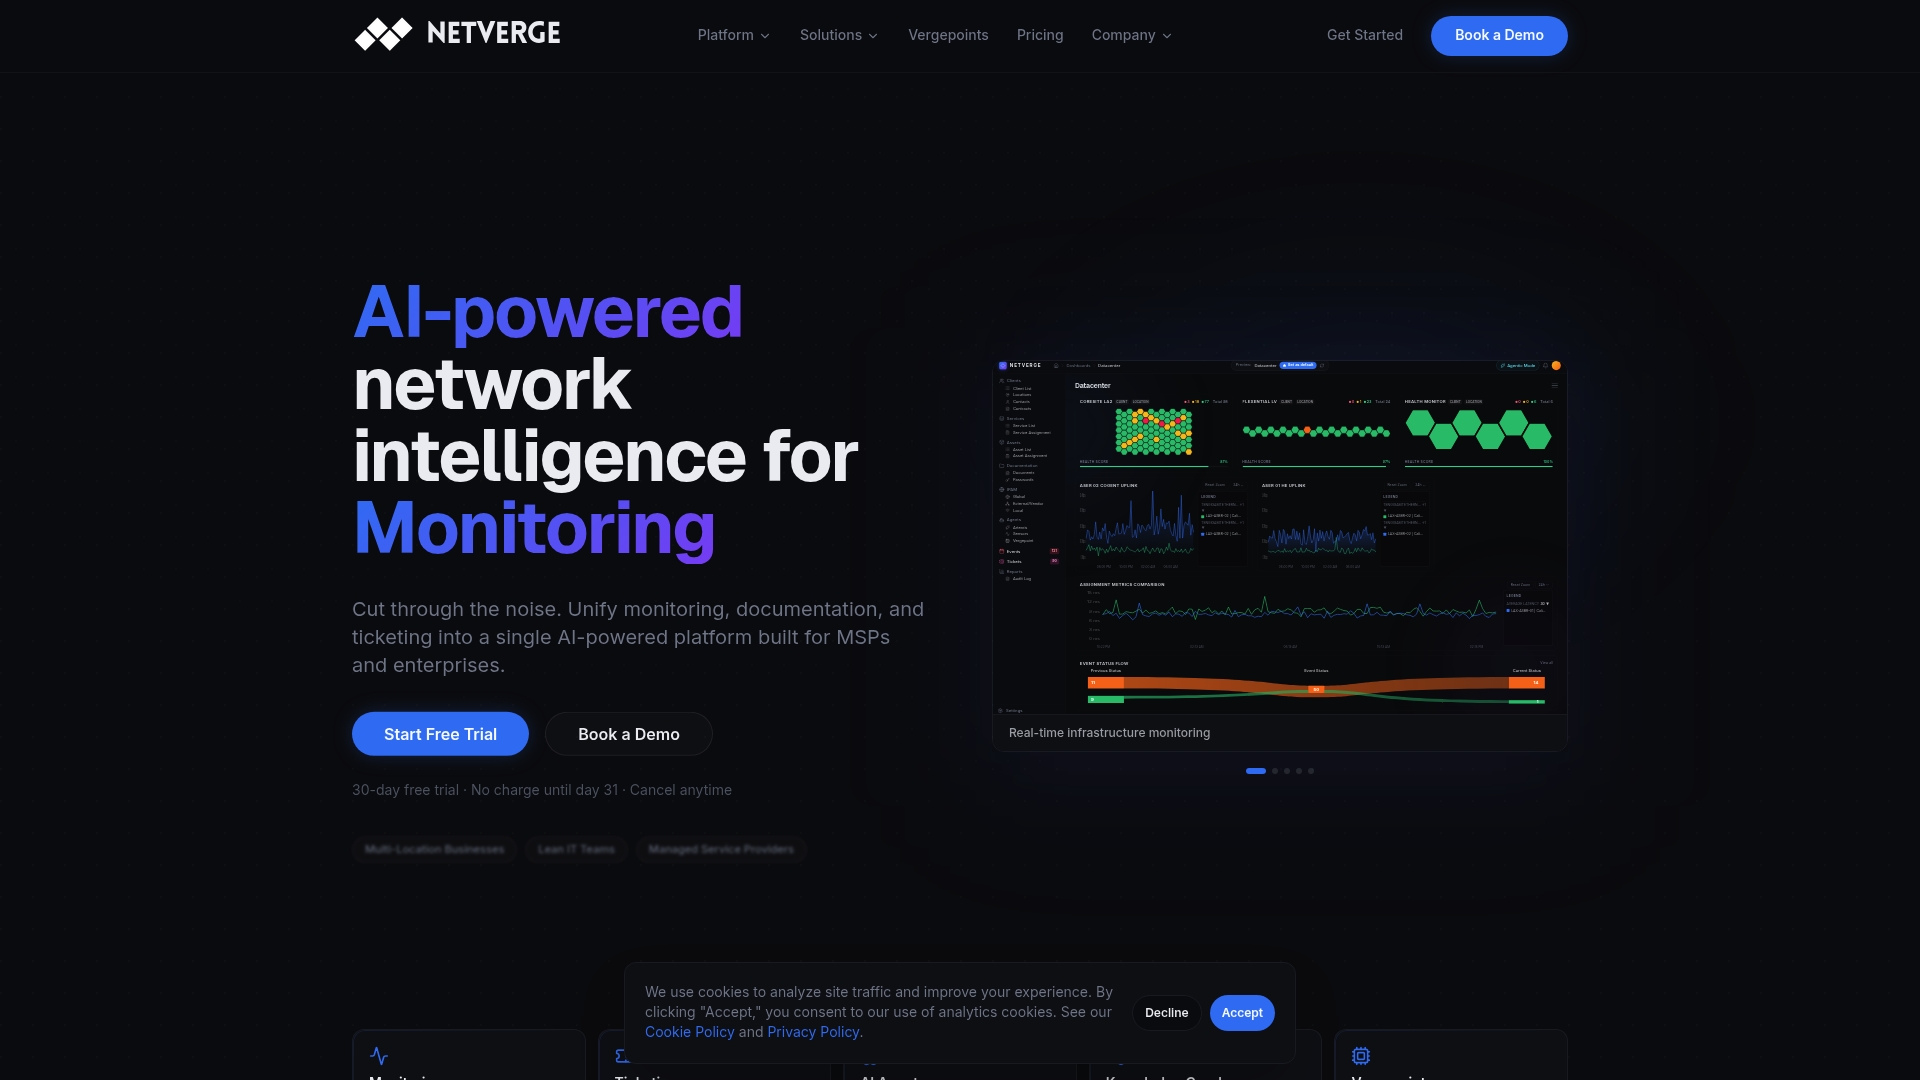
Netverge unifies network monitoring, documentation, ticketing and AI-driven automation for MSPs and multi-location enterprises. Sensors and Vergepoints give you on-site visibility, so impact scoring starts from live data on which sites and services are affected.
The Starter Package is $299 per month. Hardware Vergepoints are $49 per month per device, and Software Vergepoints are $29 per month per Vergepoint. Add-ons such as 100 additional monitoring sensors, sites or clients are $100 per month per 100, all listed in the pricing guide. You can estimate your own total with the pricing calculator, or start your free trial and run your matrix against live incidents.
FAQ
What is the difference between an incident priority matrix and an incident prioritization matrix?
Nothing meaningful. Both names describe the same grid that combines impact and urgency to produce a priority level. Pick one term and use it consistently in your documentation, tickets and customer communication.
How many incident priority levels should we use?
Four (P1 to P4) works for most teams. Each level needs a distinct response: a different on-call rule, update cadence or escalation path. If two levels get the same handling in practice, merge them.
Who should be allowed to change an incident's priority?
Technicians set impact and urgency, and the ticketing tool calculates priority. Overrides should be rare, require a recorded reason and be reviewed by a team lead. This stops priority inflation, where every customer request becomes P1.
Do priority levels need to match our SLAs?
Yes. Each level should map to the response and resolution commitments you have made to customers or internal stakeholders. Build the SLA table from what you can reliably deliver, then use the matrix to apply it automatically.
Sources
- AWS Well-Architected Framework: OPS10-BP03 Prioritize operational events based on business impact
- University of Wisconsin DoIT Operational Framework, Incident Management
- CISA National Cyber Incident Scoring System (NCISS)
- Daydream: NIST SP 800-61 incident prioritization implementation
- OC Security Audit: Incident response after the first alert, NIST guide