
For MSPs and multi-location enterprises, the fastest path to predictive, multi-tenant network visibility is a unified, AI- and IoT-driven, edge-embedded monitoring platform. That means deploying Vergepoints (Raspberry Pi edge nodes running Prometheus) at each client site, aggregating telemetry into a central Grafana stack backed by Grafana Mimir for long-term storage and Grafana Loki for logs, routing deduplicated alerts through Alertmanager, and layering containerized AI inference modules that publish predicted risk metrics back into Prometheus. A one-month pilot across five MSP clients with approximately 500 nodes validated this architecture, reporting measurable reductions in both downtime and incident resolution time. Industry guidance from Gartner and ChannelE2E confirms that AI-enabled infrastructure is now the commercial lever MSPs need to move from reactive SLA billing to outcome-based contracts.
Key immediate benefits of this approach:
- Predictive alerts fire before client-impacting failures, not after
- Per-client Prometheus instances with VPN tunnels and token authentication enforce strict multi-tenant isolation
- Containerized deployment via Docker Swarm and Portainer keeps the stack portable and auditable
- AI modules (SLR, K-Means, LSTM) publish
risk_score,anomaly_confidence, andpredicted_time_to_failuremetrics directly into Prometheus for Grafana alerting - Measured pilot outcomes provide the evidence base for outcome-based SLA language
Key Takeaways
A unified, edge-embedded AI monitoring platform with per-tenant isolation and predictive risk metrics is the most direct path for MSPs to reduce MTTR, lower NOC load, and support outcome-based SLA contracts.
| Point | Details |
|---|---|
| Edge-first collection | Deploy Vergepoints (Raspberry Pi + Prometheus) at each client site to eliminate WAN-outage blind spots and reduce backhaul. |
| AI risk metrics in Prometheus | Publish risk_score, anomaly_confidence, and predicted_time_to_failure so Grafana alerts fire before client-impacting failures. |
| Multi-tenant isolation | Per-client Prometheus instances, VPN tunnels, and token auth are non-negotiable for MSP deployments. |
| Pilot before production | Run a 30-day pilot across two to five sites; measure MTTR, downtime, and ticket volume to gate production rollout. |
| Netverge accelerates deployment | Netverge combines Vergepoints hardware, AI modules, and managed pilot programs to compress time-to-value versus a self-assembled open-source stack. |
Table of Contents
- What does GCP network monitoring look like as a unified MSP platform?
- How does each technical component fit into the deployment?
- What deployment topology fits your MSP environment?
- How do AI modules feed predictions back into your observability stack?
- How does predictive monitoring shift MSPs to outcome-based contracts?
- What security controls does a multi-tenant deployment require?
- What does a pilot-to-production checklist look like?
- What did the validated pilot actually show?
- How should you evaluate a vendor for this architecture?
- The case for edge-first monitoring is stronger than most MSPs realize
- Netverge gives MSPs a proven path to outcome-based monitoring
- Sources
What does GCP network monitoring look like as a unified MSP platform?
Effective cloud network monitoring for MSPs is not a single tool. It is a layered architecture where edge collection, central aggregation, AI inference, and alert routing each play a distinct role. Unified infrastructure monitoring pulls metrics, logs, traces, and events into one model, enabling cross-layer correlation and faster incident diagnosis. Broad integration coverage is what prevents blind spots across heterogeneous client environments.
At the highest level, the platform operates in three tiers:
- Edge tier: Vergepoints (Raspberry Pi units) run local Prometheus instances, scraping exporters for network devices, servers, and IoT sensors at each client site
- Aggregation tier: Central Grafana with Mimir (long-term time-series storage) and Loki (log aggregation) receives federated metrics and logs from all edge nodes
- Intelligence tier: Containerized AI modules perform anomaly detection and prediction, publishing results back to Prometheus as queryable risk metrics
This architecture integrates directly with NOC workflows. Alertmanager routes deduplicated alerts to ticketing systems, and the knowledge graph layer in platforms like Netverge ties alerts to documented topology, reducing mean time to diagnose. For MSPs, the commercial payoff is clear: AI-driven infrastructure lets MSPs prove predictive service quality and sell higher-value outcome-based contracts rather than defending reactive SLA credits.
How does each technical component fit into the deployment?
The MDPI Sensors architecture maps each component to a specific node role. Understanding those roles is what lets you size hardware correctly and avoid over-provisioning.
Core components and their roles
| Component | Role | Deployment node |
|---|---|---|
| Vergepoint (Raspberry Pi) | Edge Prometheus scrape, local exporter host | Edge (per client site) |
| Prometheus | Metrics collection and short-term TSDB | Edge + central |
| Grafana | Multi-tenant dashboards and alerting UI | Worker node |
| Grafana Mimir | Long-term time-series storage | Manager node |
| Grafana Loki | Log aggregation and querying | Manager node |
| Alertmanager | Deduplicated alert routing | Worker node (HA pair) |
| Docker Swarm | Container orchestration | Manager + worker nodes |
| Portainer | Container management UI and RBAC | Manager node |
| Nginx | Reverse proxy, TLS termination | Worker node |
| Promtail | Log shipping agent | Edge + worker nodes |
The manager node carries persistent storage: PostgreSQL for Grafana configuration and Mimir's object storage backend. Worker nodes host Grafana, Promtail, Alertmanager, and Nginx. Edge Vergepoints are intentionally lightweight, running only Prometheus and the exporters relevant to that site's device mix.
Pro Tip: Containerize AI inference modules centrally for cross-tenant model retraining and reserve edge inference only for latency-sensitive anomaly detection (sub-second response requirements). Edge inference increases compute cost per Raspberry Pi and complicates model refresh cycles; central inference lets you retrain on aggregated data and push updated containers via Portainer without touching each site.
Retention policies for Mimir and Loki should be defined per tenant at onboarding. A 13-month Mimir retention covers annual trending; Loki log retention of 30–90 days typically satisfies compliance requirements while controlling storage costs. Container images should be stored in a private registry with signed images to prevent supply-chain risk.
What deployment topology fits your MSP environment?
Lightweight collectors placed at each site reduce backhaul overhead and give more accurate, location-specific telemetry than centralizing all raw data. That principle drives the topology decision.
Fully edge (recommended for security-sensitive clients): Each client site has a Vergepoint running a full Prometheus instance. Metrics are federated to central Mimir over an encrypted VPN tunnel. Tenant isolation is absolute because no client's raw metrics traverse another client's network path.
Hybrid (recommended for most MSP deployments): Edge Prometheus scrapes locally and forwards aggregated metrics to central Mimir. Loki log shipping runs via Promtail over the same VPN. This balances bandwidth efficiency with isolation and is the pattern validated in the five-client pilot.
Central-only (low-security, low-complexity clients): A single central Prometheus scrapes all client devices via VPN. Simpler to operate but creates a single point of failure and higher cardinality pressure on one TSDB instance.
Scaling rules to apply as you grow:
- Add a Vergepoint edge node when a client site exceeds 100 monitored endpoints or when scrape intervals exceed 30 seconds due to cardinality load
- Scale Mimir horizontally (additional ingestor and querier replicas) when ingestion exceeds 1 million active time series
- Run Alertmanager in a minimum two-node cluster for redundancy; three nodes eliminate split-brain risk
- Grafana scales horizontally behind Nginx with session affinity; add instances when dashboard load times exceed 3 seconds under concurrent user load
How do AI modules feed predictions back into your observability stack?
The AI pipeline runs in five stages: collection, feature extraction, model inference, prediction publishing, and alert-driven workflow execution.
- Collection: Exporters on Vergepoints push metrics to edge Prometheus. Promtail ships logs to Loki.
- Feature extraction: A preprocessing container queries Prometheus via the HTTP API, computes rolling statistics (mean, variance, rate of change) over configurable windows, and writes feature vectors to a shared volume or message queue.
- Model inference: Three containerized models run in sequence or parallel depending on the use case: Simple Linear Regression (SLR) for trend-based capacity forecasting, K-Means for unsupervised anomaly clustering, and LSTM for time-series prediction of failure precursors.
- Prediction publishing: Inference containers expose a
/metricsendpoint that Prometheus scrapes, publishingrisk_score(0–1 normalized),anomaly_confidence(0–1), andpredicted_time_to_failure(seconds) as labeled time series per tenant and device. - Alert-driven workflows: Grafana alert rules threshold on these risk metrics and fire to Alertmanager, which routes to ticketing integrations and runbook automation.
Gartner's analysis confirms that GenAI and AIOps will automate routine diagnostics and configuration generation while human operators retain final decision authority for the next 3–5 years. Design your inference pipeline accordingly: AI fires the alert and suggests the remediation; the operator approves or overrides.
Pro Tip: Version every model container with a semantic tag (e.g., lstm-v1.3.2) and include a drift-detection sidecar that monitors prediction error rates against a rolling baseline. When error rates exceed a defined threshold, the sidecar suppresses alert firing and pages the ML ops team rather than flooding the NOC with stale-model false positives.
How does predictive monitoring shift MSPs to outcome-based contracts?
Predictive telemetry changes what MSPs can promise and prove. Instead of defending uptime percentages after an incident, you present continuous evidence that your monitoring caught and resolved issues before clients noticed them. That evidence is the foundation of outcome-based SLA language.
Operational model changes to implement:
- Pre-approved remediation playbooks trigger automatically when
risk_scoreexceeds a defined threshold, executing device restarts, failover switches, or configuration rollbacks without human initiation - MTTR tracking starts from the moment the AI alert fires, not from when a client calls in, compressing the detection-to-resolution window
- Incident-free interval metrics, tracked per tenant in Grafana, become the primary KPI reported in monthly service reviews
For SLA drafting, the metrics that hold up in outcome-based contracts are: availability windows (measured from Prometheus uptime data), Mean Time To Detect (MTTD, from alert timestamp to acknowledgment), Mean Time To Repair (MTTR, from acknowledgment to resolution), and incident-free interval length. Predictive metrics give you MTTD figures that are structurally lower than reactive monitoring can achieve.
Staffing impact: AI acts as a force-multiplier for MSP operations, handling routine fault diagnosis and configuration generation. NOC headcount requirements per managed node decrease, but senior engineers remain responsible for model governance, escalation decisions, and contract negotiation. See the AINetOps playbook for runbook templates and NOC workflow integration patterns.
What security controls does a multi-tenant deployment require?
Multi-tenant monitoring carries real liability if isolation fails. These controls are non-negotiable.
Isolation controls:
- Per-client Prometheus instances prevent metric cross-contamination at the collection layer
- WireGuard or IPsec VPN tunnels between Vergepoints and the central stack encrypt all telemetry in transit
- Token-based authentication on Prometheus remote-write endpoints ensures only authorized edge nodes can write to a tenant's Mimir namespace
- Separate Grafana organizations with dedicated PostgreSQL schemas isolate dashboard configurations, user accounts, and alert rules per tenant
Data handling:
- Define retention periods per tenant at onboarding and enforce them via Mimir's per-tenant retention configuration
- Pseudonymize device identifiers in Loki logs where client contracts require it
- Store Mimir object storage in a region that satisfies each client's data residency requirements; document this in the service agreement
Operational security:
- Use a private, signed container registry; scan images with a tool like Trivy before deployment
- Enforce RBAC in Portainer so NOC engineers cannot modify containers outside their assigned tenant scope
- Configure Nginx with TLS 1.2 minimum, HSTS headers, and rate limiting on the Prometheus remote-write endpoint
- Harden Alertmanager routing by restricting receiver configurations to named integrations; prevent arbitrary webhook additions without change-control approval
For MSPs managing AI workloads, the AI data governance framework provides structured guidance on data classification, access controls, and audit logging specific to MSP environments.
Compliance checklist before production:
- Encryption at rest confirmed for Mimir object storage and PostgreSQL
- Encryption in transit confirmed for all VPN tunnels and API endpoints
- Audit logs enabled in Portainer and Grafana for all administrative actions
- Data residency documented per tenant and validated against service agreements
- GDPR data processing agreements in place where EU client data is involved
What does a pilot-to-production checklist look like?
Full integrated network observability across distributed sites typically takes weeks to a few months, while simpler device monitoring can be operational within days. A structured pilot compresses that timeline and produces the evidence you need for production approval.
Pilot checklist:
- Define objectives: target client sites (recommend two to five), node count, and success criteria (MTTR reduction target, alert noise reduction percentage)
- Procure and image Vergepoints; configure base Prometheus and exporter stack per site
- Deploy central stack (manager node: Mimir, PostgreSQL; worker nodes: Grafana, Loki, Alertmanager, Nginx) via Docker Swarm using Portainer
- Establish VPN tunnels and validate per-tenant token authentication
- Enable AI inference containers; confirm
risk_scoreandanomaly_confidencemetrics appear in Prometheus - Run 30-day measurement period; collect MTTR, downtime events, and ticket volume data
- Review results against success criteria; document remediation runbook effectiveness
- Gate production rollout on: MTTR improvement confirmed, zero tenant isolation incidents, alert noise within acceptable thresholds
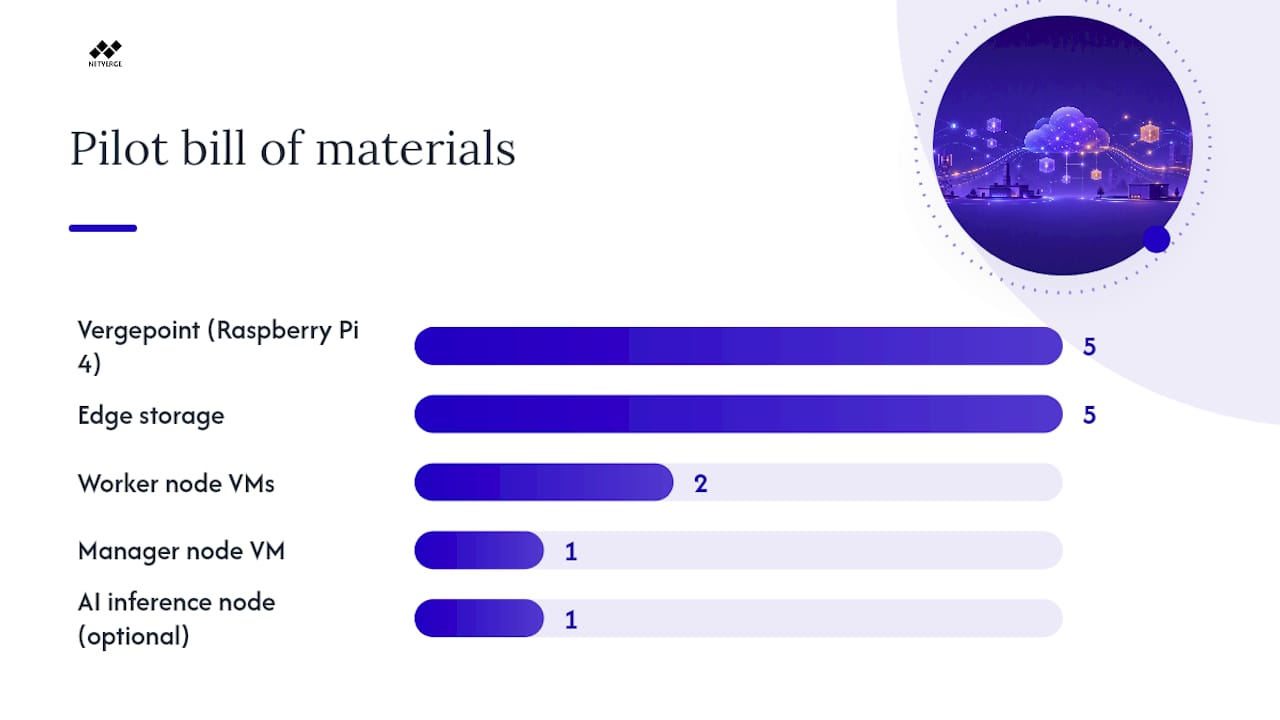
Bill of materials (per five-client pilot):
| Item | Specification | Quantity |
|---|---|---|
| Vergepoint (Raspberry Pi 4) | 4GB RAM, SSD, PoE HAT | 5 (one per site) |
| Edge storage | industrial microSD or USB SSD | 5 |
| Manager node VM | 8 vCPU, RAM, 500GB SSD | 1 |
| Worker node VMs | 4 vCPU, RAM, SSD | 2 |
| Container registry | Private registry (self-hosted or cloud) | 1 |
| VPN appliance/software | WireGuard or IPsec gateway | 1 |
| AI inference node (optional) | 8 vCPU, RAM, GPU optional | 1 |
For ROI measurement during the pilot, track: total unplanned downtime minutes per client, average MTTR per incident, and NOC ticket volume. These three metrics directly map to the outcome-based SLA language you will use in production contracts. Review automation benefits for MSPs for commercial modeling guidance.
What did the validated pilot actually show?
The MDPI Sensors pilot deployed this exact architecture across five MSP clients with approximately 500 monitored nodes over one month. Edge Prometheus instances ran on Raspberry Pi Vergepoints at each client site, federating to a central Grafana, Mimir, and Loki stack. Alertmanager handled deduplicated routing to ticketing integrations.
The pilot reported measurable reductions in both downtime duration and incident resolution time compared to the pre-deployment baseline. These are pilot results from a specific deployment context, not universal guarantees, but they represent the strongest available published evidence for this architecture class.
Key operational practices that drove the results:
- AI risk metrics fired alerts before client-reported incidents in the majority of cases
- Pre-approved remediation playbooks executed automatically for the most common fault types, eliminating manual triage steps
- Per-tenant Grafana dashboards gave NOC engineers immediate context without cross-tenant data access
For MSPs, the implication is direct: reduced NOC load per managed node and a documented evidence base that supports outcome-based billing conversations with clients. See real-world AI in IT management examples for additional deployment case data.
How should you evaluate a vendor for this architecture?
Not every platform that claims AI-powered monitoring can deliver multi-tenant isolation, edge hardware support, and model lifecycle management together. Use these questions to qualify vendors quickly.
Questions to ask every vendor:
- Does the architecture support per-client Prometheus instances with VPN-isolated telemetry paths?
- What edge hardware options exist, and do they support plug-and-play deployment without on-site engineering visits?
- How are AI models versioned, retrained, and monitored for drift?
- Where is telemetry data stored, and can data residency be configured per tenant?
- What integrations exist for ticketing, documentation, and NOC workflows?
- What does the pilot program include, and what success metrics are measured?
Evaluation criteria ranked by weight:
- Multi-tenant isolation architecture (non-negotiable)
- Edge hardware with local Prometheus support
- AI model lifecycle management (versioning, drift detection, retraining pipeline)
- Long-term metric storage with per-tenant retention controls
- Operational runbooks and professional services for onboarding
Red flags that disqualify a vendor:
- No demonstrable pilot metrics from real deployments
- Single-tenant-only architecture requiring separate infrastructure per client
- Opaque data handling with no documented residency or retention controls
- AI features with no model versioning or drift detection capability
- No integration with existing ticketing or documentation systems
For AI governance in vendor evaluation, an AI security governance framework provides a structured checklist covering model access controls, audit requirements, and compliance documentation that MSPs should request from any AI-enabled monitoring vendor.
The case for edge-first monitoring is stronger than most MSPs realize
The conventional wisdom in MSP monitoring has been to centralize everything: one platform, one data store, one team managing it all. That model made sense when client environments were homogeneous and network edges were thin. It does not hold when you are managing 50 client sites with mixed IoT, legacy hardware, and cloud workloads, each with different compliance requirements and different failure modes.
The edge-first architecture described here is not a workaround for central monitoring's limitations. It is a structurally better fit for distributed, multi-tenant environments. Local Prometheus instances mean that a WAN outage at one client site does not blind your monitoring for that site. Edge AI inference means you catch anomalies in milliseconds, not after a round-trip to a central inference server. And per-tenant isolation means a misconfiguration in one client's stack cannot cascade into another's.

What most MSPs underestimate is the commercial leverage this architecture creates. When you can show a client a Grafana dashboard with their predicted_time_to_failure metric trending toward zero three hours before their router failed, and then show the automated remediation that resolved it without a ticket, you have moved from a cost center to a strategic partner. That is the conversation that justifies premium outcome-based contracts.
Netverge gives MSPs a proven path to outcome-based monitoring
Netverge packages this entire architecture into a single platform: Vergepoints edge hardware, AI-powered observability modules, multi-tenant dashboards, automated ticketing triage, and a knowledge graph that ties every alert to documented topology. The difference from assembling open-source components yourself is time-to-value and operational support. A Netverge pilot deploys in days, not months, with defined success criteria and measurement frameworks built in.

For MSPs ready to move from reactive SLA defense to outcome-based contracts, the next step is a structured 30-day pilot. Prepare your inventory (client sites, node counts, device types), define your success criteria (MTTR target, downtime reduction threshold), and request a pilot scoped to two to five high-value client sites. Visit Netverge's monitoring platform to review pilot terms and request a demo, or explore Vergepoints hardware for edge deployment specifications.
Sources
- Comprehensive Modular and Edge-Embedded Monitoring Architecture for Multi-Tenant Networks | MDPI Sensors
- Gartner: How AI will transform managed network services | Computer Weekly
- MSPs can own the AI network readiness conversation | ChannelE2E
- Guide to End-to-End Unified Infrastructure Monitoring (2026) | New Relic