
Wi-Fi monitoring gives ops teams continuous visibility into signal quality, capacity, and device behavior across every access point, so problems surface before users file tickets. Done right, it detects dead zones and overloaded APs, flags anomalous devices before they become security incidents, and gives you the before-and-after data to prove a fix worked. Netverge and standards bodies like the Wi-Fi Alliance treat this as a KPI discipline, not just a dashboard you glance at once a week. The rest of this guide walks through the metrics, discovery methods, surveys, and troubleshooting steps that turn monitoring into a repeatable operational practice.
TL;DR:
- Monitoring should track signal quality, capacity, and client behavior, with metrics like SNR, throughput, latency, packet loss, and airtime to distinguish coverage from interference or overloads.
- Inventories rely on SNMP, APIs, and logs; regular automated comparisons help identify rogue devices and maintain accurate hardware and client records.
- Site surveys include predictive modeling before installation and active measurements after deployment to address design flaws, interference, and material attenuation effects.
- Troubleshooting requires symptom-specific workflows and baseline metrics to verify issues like DHCP exhaustion, sticky clients, high airtime, or authentication failures.
- Scalable solutions combine basic apps, low-cost self-hosted monitors, and enterprise platforms with AI and sensors to improve visibility and reduce resolution times at multiple sites.
Table of Contents
- What KPIs Should a Wi-Fi Monitoring System Track?
- How Do You Discover and Inventory Access Points and Clients?
- Heat Maps and Site Surveys: When to Run Which
- What's the Right Workflow for Common Wi-Fi Problems?
- Which Wi-Fi Monitoring Tools Fit Your Scale?
- How Netverge Extends Monitoring With AI and Vergepoints
- What Actually Moves the Needle on Wi-Fi Pain
- Ready to Pilot Enterprise-Grade Monitoring?
- Sources
What KPIs Should a Wi-Fi Monitoring System Track?
A Wi-Fi monitoring setup that only reports "connected" or "disconnected" tells you almost nothing. Ops teams need metrics that separate a coverage problem from a capacity problem from a stability problem, because each one gets fixed a different way.
Here's the core set every dashboard should expose:
- RSSI (Received Signal Strength Indicator): measures how strong a signal is at the client, typically from around negative 30 dBm (excellent) to negative 90 dBm (unusable).
- SNR (Signal-to-Noise Ratio): the gap between signal and background noise, and the metric Purple recommends prioritizing over RSSI because a strong signal buried in noise still performs badly.
- Throughput: actual data transfer rate, which usually lags theoretical AP specs once real-world interference and client mix enter the picture.
- Latency: round-trip delay, the metric that decides whether a video call feels normal or choppy.
- Packet loss: the percentage of packets that never arrive, a strong early indicator of interference or channel congestion.
- Airtime and channel utilization: how much of a channel's capacity is already consumed by other traffic, which matters more in dense office and event deployments than raw signal strength.
- Client counts per AP and auth/DHCP failure rates: these expose overloaded access points and infrastructure bottlenecks that RSSI alone will never show.
Weak RSSI with clean SNR usually points to a coverage gap, fixable with AP placement or power adjustment. Strong RSSI with poor SNR or high airtime utilization points to a capacity or interference problem, which placement alone won't solve.
Static thresholds cause a lot of false positives. A better approach is to baseline each AP's normal range over a week or two, then alert on deviation from the 90th or 95th percentile rather than a fixed number. An AP that normally runs at 40% airtime utilization and spikes to 55% during a Monday morning sync storm isn't broken. One that jumps from 40% to 85% and stays there is.
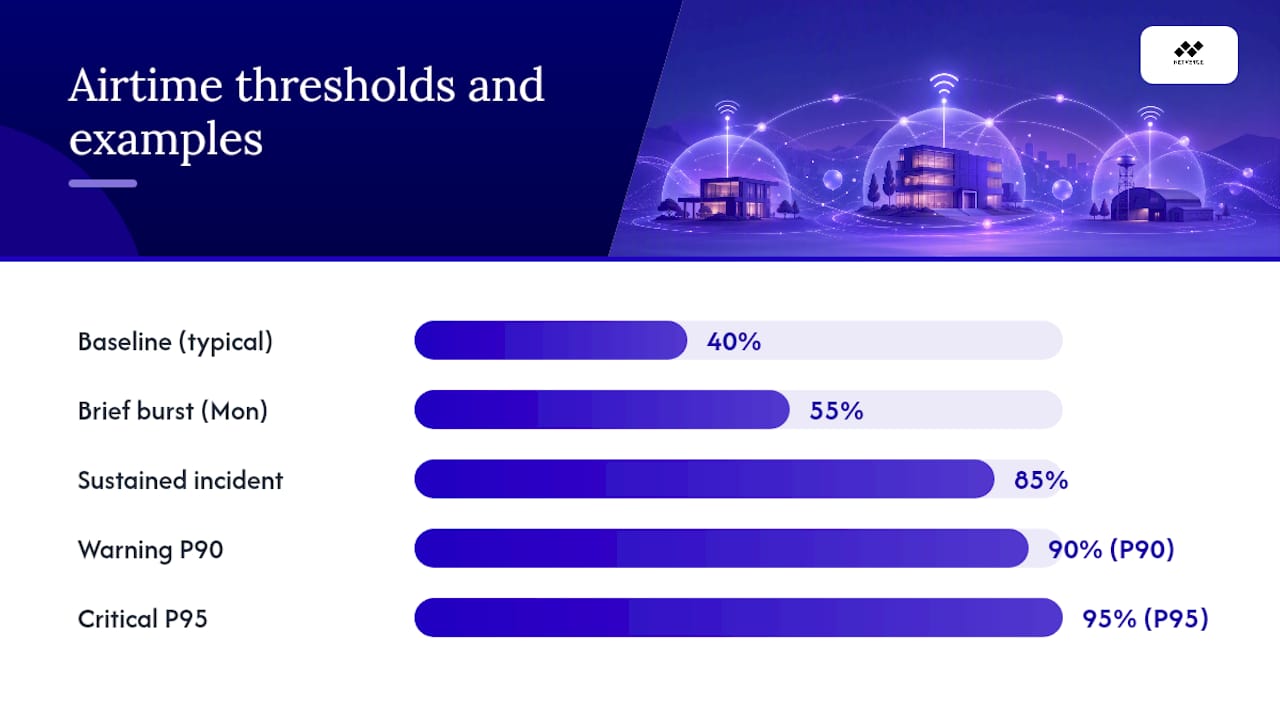
Pro Tip: Set two-tier alerts: a warning at your P90 baseline and a critical alert at P95 or above sustained for more than five minutes. This filters out normal traffic bursts while still catching real degradation.
The Wi-Fi Alliance's network management specifications, including Wi-Fi Data Elements and Wi-Fi QoS Management, standardize how these metrics get collected across vendors, which matters once you're pulling data from mixed-brand access points into one dashboard.
How Do You Discover and Inventory Access Points and Clients?
You can't monitor what you haven't found. Discovery is the step that turns a pile of hardware into a queryable inventory, and it's the step most teams skip until a rogue device or an unexplained dead zone forces the issue.
- Pull from SNMP and controller APIs first. Most enterprise-grade access points and controllers expose device lists, firmware versions, and client associations through SNMP or a vendor API, which should feed your inventory automatically rather than through manual spreadsheet updates.
- Cross-reference RADIUS logs. Authentication logs reveal every device that has ever connected, including ones that connected once and were never added to your official inventory.
- Add passive probe-sniffing for anything the above missed. Passive scanning catches devices broadcasting probe requests even before they authenticate, useful for catching rogue APs or unmanaged hardware.
- Maintain a living record, not a point-in-time snapshot: model, firmware version, physical location, SSIDs broadcast, current client count, and last-seen timestamp.
- Flag anything that doesn't match a known BSSID or vendor OUI as a candidate rogue AP, then physically locate and disconnect it before it becomes an open door onto your network.
When discovery breaks, the usual suspects are an SNMP community string that changed, an API token that expired, or a controller upgrade that altered the export format. Check those three before assuming your monitoring tool itself is broken.
Pro Tip: Schedule a weekly automated diff of your inventory against the last known-good state. New, unexplained entries are worth a five-minute look even when nothing else looks wrong.
Heat Maps and Site Surveys: When to Run Which
Predictive surveys happen on paper, or more accurately, in software, before a single AP goes up. You feed in building dimensions, wall materials, and AP placement plans, and the tool models expected coverage. Active surveys happen after deployment, with a technician physically walking the space carrying a laptop or tablet running survey software, capturing real RSSI and SNR readings at every point.
Both matter, and they answer different questions.
- Predictive surveys catch design mistakes before installation costs are sunk, particularly around concrete, metal shelving, or elevator shafts, which attenuate signal far more than drywall.
- Active surveys validate that the design actually performs once real materials, real furniture, and real interference sources are in place.
- Spectrum analysis earns its place when you suspect non-Wi-Fi interference: microwaves, older cordless phones, or industrial equipment operating in the 2.4 GHz or 5 GHz bands.
- Heat map outputs should include RSSI and SNR overlays, client density by zone, and channel utilization, all of which show where a redesign is actually needed instead of guessed at.
ABI Research points out that as more networks adopt 6 GHz spectrum and handle event-scale density, end-to-end visibility across the survey and monitoring stack becomes a requirement rather than a nice-to-have. Re-survey any time you add walls, move dense furniture, change AP hardware, or notice sustained complaints from a zone that previously tested clean. A yearly re-survey is a reasonable default for stable office space; high-turnover retail or event venues need it more often.
What's the Right Workflow for Common Wi-Fi Problems?
Symptom-based troubleshooting without data is guesswork dressed up as expertise. The fix is a consistent workflow that maps what users report to what your monitoring data can actually confirm.
Start by sorting the complaint into one of four buckets: can't connect at all, connects but drops repeatedly, connects but runs slow, or authentication fails intermittently. Each bucket points to a different data pull.
- Can't connect: check DHCP pool exhaustion and RADIUS server response times first. A full DHCP scope produces exactly this symptom and gets misdiagnosed as an AP failure constantly.
- Drops repeatedly: pull per-client RSSI and SNR trends over the drop window. A sticky client, one that clings to a distant AP instead of roaming to a closer one, shows up as a client with degrading signal that never triggers a handoff.
- Runs slow: check airtime utilization and client count on the serving AP. An AP serving 60 clients on a channel with 80% utilization will feel slow even with excellent signal strength.
- Auth fails intermittently: check RADIUS server load and response latency, particularly during peak login windows like the start of a shift or school period.
Fixes follow directly from the diagnosis: tune roaming aggressiveness and minimum RSSI thresholds for sticky clients, replan channel assignments where utilization is chronically high, and scale RADIUS or DHCP capacity where auth or lease failures cluster at predictable times.
Proving a fix worked means comparing baseline metrics from before the change against the same metrics for at least a week after, and correlating the drop in support tickets against that same window. Netverge's layered troubleshooting approach follows this same evidence-first sequence.
| Symptom | Likely Cause | Verification Data | Typical Fix |
|---|---|---|---|
| Can't connect | DHCP exhaustion, RADIUS timeout | DHCP lease logs, auth server response time | Expand DHCP scope, scale RADIUS |
| Drops repeatedly | Sticky client, weak roam threshold | Per-client RSSI/SNR trend | Adjust minimum RSSI roam threshold |
| Runs slow | High airtime utilization | Channel utilization, client count per AP | Channel replan, add capacity |
| Intermittent auth failure | RADIUS overload at peak times | Auth logs, server latency by time of day | Scale RADIUS, load balance auth |
Which Wi-Fi Monitoring Tools Fit Your Scale?
Not every network needs the same monitoring depth, and buying enterprise tooling for a five-AP office wastes budget just as much as running a spreadsheet for a 200-site MSP wastes engineering hours.
- Mobile Wi-Fi analyzer apps are the right starting point for quick, single-site checks. Apps like WiFi Monitor report SSID, BSSID, channel, signal strength, and security protocol in real time, useful for a technician standing in a dead zone trying to confirm what's actually reaching that spot.
- Lightweight self-hosted monitors fill the gap between a phone app and a full platform. A project like netmon runs on something as small as a Raspberry Pi and tracks latency, packet loss, DNS resolution time, and bandwidth continuously, at close to zero licensing cost.
- Full observability platforms become necessary once you're managing multiple sites, need historical retention for compliance or trend analysis, or want AI-driven anomaly detection instead of manually reading charts.
The tradeoffs are straightforward: apps give you zero deployment effort but no history and no alerting. Self-hosted monitors add continuous baseline data at low cost but require someone to maintain the box. Platforms add alerting sophistication, longer retention, and cross-site correlation, at the cost of a subscription and onboarding effort.
A sensible path: baseline your environment with a free analyzer app, add a self-hosted monitor if you want continuous low-cost tracking, then pilot a full platform once you're managing more than a couple of sites or need SLA-grade reporting.
How Netverge Extends Monitoring With AI and Vergepoints
An advanced approach layers physical sensors with AI-driven analysis so ops teams stop reading dashboards line by line and start acting on flagged anomalies instead.
- Vergepoints provide plug-and-play, on-site telemetry with more than two dozen sensors, giving you physical-layer visibility that pure software monitoring can't reach.
- Knowledge graphs connect device, location, and historical incident data, so a recurring problem at one site gets recognized as a pattern instead of a fresh mystery each time.
- AI triage flags anomalies against learned baselines automatically, cutting the manual work of deciding what's actually worth investigating.
A conservative evaluation path: pilot Vergepoints at one or two problem sites, validate the baselines against your existing metrics for two to three weeks, then measure the change in mean time to resolution before expanding further.
What Actually Moves the Needle on Wi-Fi Pain
Dashboards don't fix networks. Habits do. The single most useful practice I've seen described is a standardized complaint-tag system paired with a "Pain Index," a rolling score that turns scattered user complaints into a trend line, an approach IT in Trail documents well. Pair that with a fifteen-minute weekly loop where someone actually reviews the top three hotspot APs by complaint volume, not just the ones with the worst raw metrics. Automated signals catch what users don't report; user reports catch what your thresholds miss. Neither alone tells the full story.
— Jim
Ready to Pilot Enterprise-Grade Monitoring?
If you're managing Wi-Fi across multiple sites or client networks, the workflow described above, metrics, inventory, surveys, troubleshooting, gets exponentially harder to run manually past a handful of locations. The platform was designed to handle that scale by combining hardware sensors, AI-driven triage, and unified dashboards so MSPs and multi-site enterprises get one source of truth instead of a dozen disconnected tools. A sensible pilot looks like this: deploy Vergepoints at two or three representative sites, validate your baseline KPIs against what you're already tracking, then evaluate how much faster AI triage flags real issues compared to manual review. Providers managing large distributed footprints, like the setup described in this Wave Broadband case study, face the same visibility challenge at scale. Start by exploring Netverge's monitoring platform or check the enterprise deployment options to see what a pilot would look like for your environment.