
Real-time issue detection is the continuous, immediate identification of anomalies in operational systems, enabling IT teams to address problems before they escalate into failures. In network operations, this is also called continuous anomaly detection or instant issue monitoring, and it represents a fundamental shift from scheduled polling to always-on surveillance. Where traditional monitoring checks system health every few minutes, real-time detection flags deviations within seconds, giving engineers the window they need to act. For MSPs and multi-location enterprises, that speed difference is the line between a minor alert and a full-scale outage.
What is real-time issue detection and how does it work?
Real-time issue detection uses continuous telemetry collection across metrics, logs, traces, and events to flag anomalies the moment they appear, rather than waiting for a scheduled poll to surface them. The four telemetry types each serve a distinct role: metrics track numerical performance indicators like CPU utilization and packet loss, logs capture discrete system events, traces follow request paths across distributed services, and events record state changes. Together, they form a complete picture of infrastructure health at any given second.

The detection pipeline depends on low-latency ingestion. Data must move from collection point to analysis engine fast enough to trigger an alert before the issue compounds. Sub-second detection requires stream processing architectures, not batch jobs. Any delay introduced in the ingestion pipeline, whether from network hops, buffering, or serialization overhead, directly degrades detection effectiveness. Real-time is fundamentally a systems-timing problem.
Once data reaches the analysis layer, anomaly detection algorithms evaluate it against expected behavior. Static thresholds work for well-understood, stable signals: if CPU exceeds 90%, fire an alert. Dynamic baselining goes further by learning normal behavior over time and flagging deviations from that learned pattern. Unsupervised algorithms like Z-score and interquartile range (IQR) operate on streaming data without pre-labeled training sets, adapting to shifting baselines automatically. This matters because gradual anomalies, such as a slow memory leak, will never breach a static threshold until the damage is done.
- Metrics: CPU, memory, bandwidth, latency, error rates
- Logs: Application errors, authentication events, system warnings
- Traces: End-to-end request paths in distributed or microservices architectures
- Events: Configuration changes, device reboots, interface state transitions
Alert quality is the final and often underestimated layer. Deduplication, clustering, and severity normalization prevent alert storms that overwhelm on-call engineers and cause critical signals to get buried. A detection system that fires 500 alerts per hour trains your team to ignore them. The goal is fewer, higher-confidence alerts that each represent a genuine operational signal.
Pro Tip: Set up SOC triage feedback loops where engineers mark false positives directly in the alerting system. Over time, this data trains your anomaly models to reduce noise without manual threshold tuning.
What are the benefits of real-time detection vs. traditional monitoring?
The most direct benefit of real-time problem identification is the reduction of Mean Time To Detect (MTTD). Delayed detection beyond 30 minutes makes recovery significantly harder, and every minute added to MTTD adds corresponding time to Mean Time To Resolve (MTTR). Shorter MTTD means engineers reach the problem while it is still contained, before cascading failures propagate across dependent systems.
The table below shows the operational gap between traditional polling-based monitoring and real-time detection across the metrics that matter most to IT operations teams.
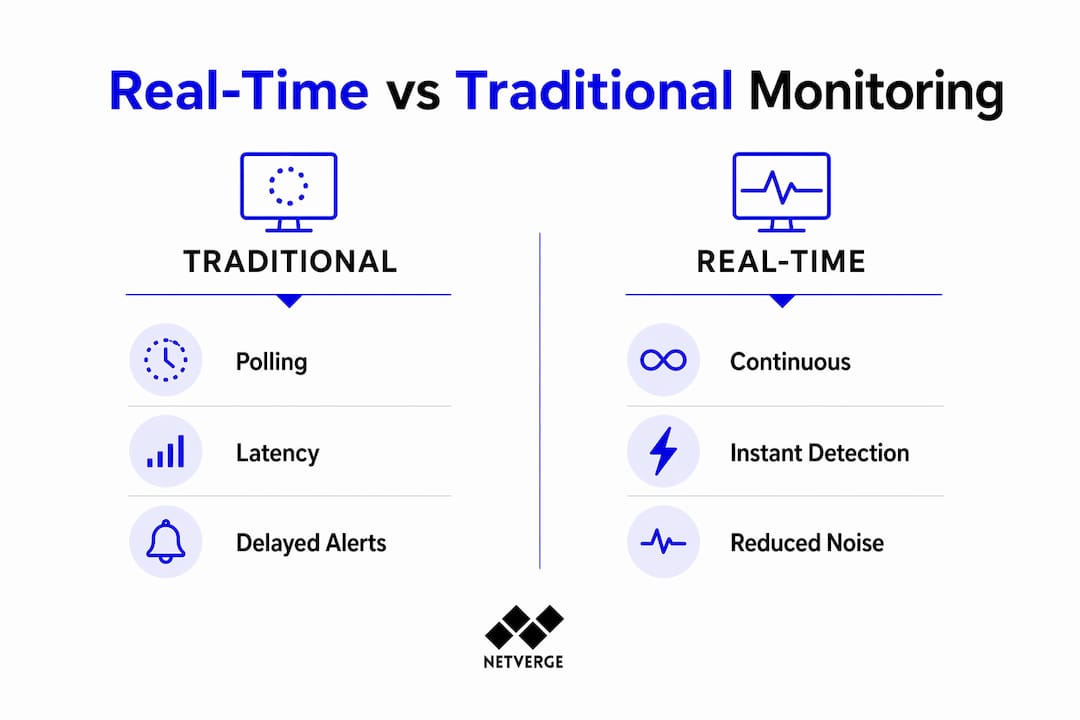
| Dimension | Traditional monitoring | Real-time detection |
|---|---|---|
| Detection latency | Minutes to hours | Seconds or less |
| Anomaly method | Static thresholds | Dynamic baselining + AI |
| Alert accuracy | High false positive rate | Reduced noise via deduplication |
| Fault isolation | Manual investigation required | Automated fault pinpointing |
| MTTR impact | Slow, compounding recovery | Faster containment and resolution |
Fault isolation speed is a concrete example of where real-time detection pays off in network operations. Rapid fault pinging confirms device status before the next standard polling interval, which typically runs at 60 seconds or longer. That confirmation lets network engineers escalate to the precise fault location immediately, rather than spending the first 10 minutes of an incident just determining which device is responsible.
Real-time detection also integrates directly with observability platforms to accelerate root-cause analysis. Detection answers the question "is something broken right now?" while observability tools answer "why is it broken?" The two functions are complementary, not interchangeable. Treating them as the same capability is a common architectural mistake that leaves teams with fast alerts but slow diagnoses.
How do IT teams implement effective real-time issue detection?
Effective implementation starts with instrumentation coverage. You cannot detect what you cannot see. Before selecting a detection platform, map every critical system component and confirm that telemetry is flowing from each one. Gaps in instrumentation create silent failures where MTTD stays high even when detection tooling is in place, because the signals needed to identify the problem simply do not exist in the data stream.
- Audit instrumentation coverage. Identify every network device, application, and service that needs monitoring. Confirm metrics, logs, and traces are being emitted and collected without gaps.
- Choose a stream processing architecture. Batch-based pipelines introduce ingestion delay. Use event-driven architectures with tools that support sliding window analysis and incremental anomaly scoring for sub-second detection.
- Layer static and dynamic detection. Apply static thresholds for known failure modes and add dynamic baselining for gradual or novel anomalies. Neither method alone covers the full range of failure patterns.
- Integrate with your CI/CD pipeline. Change-aware monitoring flags anomalies in the context of recent deployments. If a spike in error rates follows a code push, the detection system should surface that correlation automatically rather than requiring manual investigation.
- Connect detection to incident management. Real-time alerts have limited value if they do not trigger structured incident workflows. Integrate your detection layer with ticketing and incident management tools so that every confirmed anomaly creates a traceable response record.
For network anomaly detection specifically, deploying physical visibility hardware at distributed locations closes the telemetry gap that software-only monitoring leaves open. Physical sensors capture layer-1 and layer-2 signals that API-based monitoring cannot reach.
AI-powered correlation across multiple telemetry sources speeds root-cause analysis and reduces noise by prioritizing alerts based on contextual relationships between signals. A single AI-correlated alert that links a CPU spike, a log error, and a latency increase is more operationally useful than three separate threshold alerts with no context.
Pro Tip: Use deployment timestamps as a detection context layer. Tag every alert with the most recent change event in that environment. Engineers will resolve incidents faster when they know whether the anomaly predates or follows a deployment.
What challenges affect the accuracy of real-time issue detection?
The most common accuracy failure is stale data ingestion. Fast collection is insufficient if the ingestion pipeline introduces delays through buffering, batching, or network congestion. An alert that fires 90 seconds after the anomaly occurred is not real-time detection. Timing accuracy across the entire pipeline, from sensor to alert, is the defining constraint of any real-time system.
Silent failures represent a subtler and more dangerous problem. These occur when instrumentation exists but lacks the specific signals needed to identify the root cause. A service may emit health check responses while an underlying database connection pool is exhausted. The monitoring system sees "healthy" while users experience failures. Solving this requires deeper instrumentation, not faster polling.
Additional challenges IT teams encounter in production environments include:
- Static threshold drift: Thresholds set during initial deployment become outdated as traffic patterns and system behavior evolve, generating false positives or missing real anomalies.
- Alert storms: A single infrastructure failure can trigger hundreds of correlated alerts simultaneously. Without alert clustering and deduplication, on-call engineers face an unworkable volume of notifications.
- Data layering complexity: Correlating metrics, logs, and traces from heterogeneous systems requires normalization. Inconsistent timestamps, formats, or naming conventions across data sources degrade detection accuracy.
- Dynamic environment churn: In containerized or serverless environments, ephemeral workloads create constant baseline shifts that confuse static detection models.
The practical response to these challenges is a detection architecture that combines multiple methods rather than relying on any single approach. Static rules handle known failure signatures. Dynamic models handle gradual or novel anomalies. AI correlation handles multi-signal incidents. Each layer compensates for the blind spots of the others. For a deeper look at real-time monitoring methods, the interaction between these layers determines overall detection reliability.
Key takeaways
Real-time issue detection reduces MTTD to seconds by combining live telemetry ingestion, dynamic anomaly algorithms, and AI-driven alert correlation across metrics, logs, and traces.
| Point | Details |
|---|---|
| Detection speed defines impact | Systems that detect anomalies in seconds prevent the cascading failures that minutes-long delays allow. |
| Telemetry coverage is non-negotiable | Silent failures persist when instrumentation gaps exist, regardless of how fast the detection engine runs. |
| Layer static and dynamic methods | Static thresholds catch known failures; dynamic baselining and AI catch gradual or novel anomalies. |
| Alert quality matters as much as detection | Deduplication and clustering prevent alert fatigue, keeping on-call engineers focused on real signals. |
| Connect detection to incident workflows | Alerts without structured response integration slow MTTR and reduce the operational value of detection. |
Why detection speed is the metric most teams underestimate
I have reviewed network operations setups across dozens of IT environments, and the pattern is consistent: teams invest heavily in monitoring tooling and almost nothing in measuring their actual detection latency. They know their MTTR. They rarely know their MTTD. That gap matters because you cannot improve what you do not measure, and MTTD is where most incident time is silently lost.
The second thing teams consistently underestimate is the cost of alert noise. A detection system that fires accurate alerts 70% of the time and noisy alerts 30% of the time does not deliver 70% of its potential value. It delivers far less, because engineers learn to treat every alert with skepticism. The alert triage process is not an operational afterthought. It is a core component of detection effectiveness.
My view on AI in this space is grounded rather than enthusiastic. AI correlation genuinely reduces noise and surfaces multi-signal incidents faster than rule-based systems. But AI models trained on historical data will miss novel failure modes, which are exactly the failures most likely to cause major outages. The right posture is AI-assisted detection with human review of anomaly model performance on a regular cadence, not AI-only detection with set-and-forget configuration.
The teams with the best detection outcomes are not necessarily the ones with the most sophisticated tools. They are the ones who have embedded detection review into their operational culture: weekly reviews of false positive rates, quarterly instrumentation audits, and post-incident analysis that feeds back into detection model tuning.
— Jim
How Netverge delivers real-time detection for MSPs and enterprises
Netverge is built specifically for the detection challenges MSPs and multi-location enterprises face. The platform ingests live telemetry from distributed networks, applies AI-driven anomaly detection across metrics, logs, and events, and delivers correlated alerts with the context engineers need to act immediately.
Netverge's AI-powered monitoring platform combines Vergepoints hardware for physical-layer visibility with software modules for dynamic baselining, alert triage, and automated troubleshooting. Every alert connects directly to the ticketing and incident management workflow, so detection triggers structured response without manual handoff. If you are ready to reduce MTTD across your network, explore what Netverge delivers.
FAQ
What is real-time issue detection in IT operations?
Real-time issue detection is the continuous analysis of live telemetry, including metrics, logs, traces, and events, to identify anomalies within seconds of occurrence. It replaces periodic polling with always-on monitoring to prevent failures from escalating.
How does real-time anomaly detection differ from static threshold alerts?
Static thresholds fire when a metric exceeds a fixed value, while dynamic anomaly detection learns normal behavior and flags deviations from that baseline. Dynamic methods catch gradual issues like memory leaks that never breach a static threshold.
What is MTTD and why does it matter for real-time detection?
Mean Time To Detect (MTTD) measures how long it takes to identify an incident after it begins. Reducing MTTD directly reduces MTTR, and detection delayed beyond 30 minutes makes recovery significantly harder.
What causes false positives in real-time alert systems?
False positives occur when static thresholds become outdated, when ingestion pipelines introduce timing errors, or when anomaly models lack sufficient context to distinguish real failures from normal variation. Alert deduplication and SOC feedback loops reduce false positive rates over time.
What is proactive issue detection and how does it differ from reactive monitoring?
Proactive issue detection identifies anomalies before they cause user-visible failures, using trend analysis and dynamic baselining to catch degradation early. Reactive monitoring responds after a failure is already confirmed, resulting in longer outage windows and higher recovery costs.