Palo Alto Firewall Monitoring: What to Track and How
Published
- palo alto firewall monitoring
- palo alto snmp monitoring
Monitoring a Palo Alto firewall means collecting three kinds of data: health and resource metrics (usually through SNMP), traffic and threat logs (through log forwarding), and event alerts (through SNMP traps or syslog). Set up all three and send them to one place. Across many sites, that place needs to be a single view and not one firewall interface per customer. This guide walks through what to watch, how to configure SNMP securely, how to verify collection, and how to handle fleets of firewalls.
It is written for MSPs, multi-site IT teams and network operations staff who already run PAN-OS devices and need dependable visibility, not a firewall basics course.
TL;DR
- Track three layers: resource health (CPU, sessions, interfaces, power, fans), traffic and threat logs, and event-driven alerts.
- Use SNMPv3 where you can. SNMPv2c sends the community string in cleartext and has no integrity protection.
- SNMP is not real time: values can lag by up to a minute, so use traps and log forwarding for fast events.
- Forward logs from every firewall to Panorama or an external system, because each firewall only shows its own logs.
- Netverge brings firewall data into the same view as the rest of your network, which matters when you run dozens of sites.
Table of Contents
- What to monitor on a Palo Alto firewall
- How to set up SNMP monitoring on a Palo Alto firewall
- Log forwarding and traps for faster detection
- Verify collection and fix what breaks
- Monitoring many firewalls and HA pairs
- Bringing firewall data into one platform
- A starting checklist
- FAQ
- Sources
What to monitor on a Palo Alto firewall
Palo Alto Networks' monitoring documentation points to several built-in views. The Dashboard gives quick status: software version, interface state and resource use. The Application Command Center (ACC) offers filtered graphical analysis of logs, including a Compromised Hosts widget that aggregates correlated events to flag possibly infected systems. Scheduled reports cover longer-term behavior, and the Automated Correlation Engine highlights suspicious log patterns.
Those tools are useful on one box. For operations, organize what you watch into four groups.
Device health
These are the signals that tell you a firewall is about to cause an outage:
- Data-plane CPU and management-plane CPU and memory
- Session count and session utilization
- Throughput and connections per second
- Fan status, power supply status and temperature
- Interface up/down state and discarded packets
- Uptime, which reveals unexpected reboots
- Logging rate, which reveals log pipeline problems
Panorama's managed devices health page tracks many of these, including throughput, connections per second, data-plane CPU, management-plane CPU and memory, logging rate, fans and power supplies. It flags metrics in red when they deviate from a seven-day average plus standard deviation baseline.
Traffic and threat logs
Palo Alto's log types documentation explains that Traffic logs record the start and end of each session. Each entry includes source and destination zones, addresses and ports, the application, the security rule applied, the action, ingress and egress interfaces, byte count and the session end reason. One distinction saves time during triage: a drop means the rule blocked any application, while a deny means the firewall identified a specific application and blocked it.
When a user says an application is not working, the traffic log tells you which rule matched and what the firewall did. Threat and URL Filtering logs add the security side.
Event alerts
Traps notify you of system events such as hardware or software failures and of threats matching security rules. The supported trap list lives in the panCommonEventEventsV2 MIB, as described in Palo Alto's guide to forwarding traps. Each SNMP Trap server profile can define up to four SNMP managers.
Configuration and audit activity
System, Configuration, User-ID, HIP Match and Correlation logs can all be sent to external destinations. For an MSP, configuration logs answer the question every incident review starts with: what changed before this broke?
How to set up SNMP monitoring on a Palo Alto firewall
SNMP is the standard route for health metrics. Palo Alto's SNMP statistics documentation says it lets you gauge network health, spot resource limits and watch processing loads, including interface states, active and concurrent sessions, session utilization, temperature and uptime. SNMP managers can only read statistics with GET messages. They cannot change firewall settings with SET messages, which makes polling a low-risk integration.
The documented sequence is:
- Load the MIBs into your SNMP manager. The firewall supports standard MIBs such as MIB-II, IF-MIB, HOST-RESOURCES-MIB, ENTITY-MIB and ENTITY-SENSOR-MIB. Enterprise MIBs, including PAN-COMMON-MIB.my and PAN-TRAPS.my, are downloadable from Palo Alto's documentation portal. The supported MIBs page lists them all.
- Define the connection to each firewall. That means the management IP, UDP port 161 and the authentication details: a community string for v2c, or EngineID, username and password for v3.
- Choose the OIDs to poll. For example, session utilization is OID 1.3.6.1.4.1.25461.2.1.2.3.1.0 in PAN-COMMON-MIB.my.
- Allow SNMP on the interface. Enable it in a management profile on the MGT interface or on a Layer 3 Ethernet interface.
- Configure SNMP Setup on the firewall. In Device > Setup > Operations, open SNMP Setup, set v2c or v3, and commit.
The last step is where most teams stumble: the commit does nothing useful until the interface itself permits SNMP. Do both, then test.
SNMPv2c or SNMPv3
Firewalls, Panorama and WF-500 appliances support both versions. According to Palo Alto's SNMP overview, v2c uses a community string with cleartext messages and no integrity protection. SNMPv3 adds a username, SHA-hashed authentication, optional AES 128, 192 or 256 privacy encryption, message integrity and per-user view-based access control over OIDs.
For a security device, use v3. If you must use v2c, never keep the default "public" community string, and restrict which hosts can reach the management interface.
The field rules from Palo Alto's SNMPv3 knowledge base article are worth keeping in your runbook:
- View names and usernames can be up to 31 characters, using alphanumerics, periods, underscores or hyphens.
- The username must match the one configured on the SNMP manager.
- Authentication and privacy passwords run 8 to 256 characters.
- Use SHA for authentication and AES for privacy.
The separate SNMPv3 polling article adds two details: the view name cannot contain spaces, and the user must be a firewall administrator. The EngineID is not needed for polling but is required for sending traps.
Log forwarding and traps for faster detection
SNMP statistics tell you how the box is doing. Logs tell you what it is doing. Palo Alto's page on external monitoring services lists the channels:
| Channel | Best for |
|---|---|
| SNMP statistics and traps, email | Immediate notification of health and system events |
| HTTP(S) API forwarding | Workflow automation, such as creating an incident ticket from matching logs |
| Syslog | Long-term storage and integration with log analysis tools |
| NetFlow | IP traffic statistics on firewall interfaces |
To send traps, the PAN-OS procedure has you create a Log Forwarding profile that maps each log type and severity, or WildFire verdict, to an SNMP Trap server profile. You then assign the profile to policy rules and network zones, configure destinations for System, Configuration, User-ID, HIP Match and Correlation logs, and commit.
Forward less, and route it to the right team
Palo Alto's log forwarding guidance recommends attribute-based filters so each team receives only relevant logs. A security analyst chasing malware might receive Threat logs with the type attribute set to wildfire-virus, while the network team gets system and interface events. Sending everything everywhere creates the alert noise that makes people ignore the pager.
A practical split:
- Network operations: system logs, critical and high severity events, HA state changes, interface and hardware traps
- Security operations: threat, WildFire and correlation events
- Ticketing: only events that need a human action, forwarded through the HTTP API
- Archive: everything else to syslog for retention and audits
When you design the ticketing route, the principle in our guide to real-time network alerts for MSPs applies: alert on conditions that need action, not on every state change.
Verify collection and fix what breaks
A firewall that is configured for SNMP is not the same as a firewall being monitored. Verify each layer.
Test polling from the monitoring host
Palo Alto's polling article shows an snmpget request using v3 with authPriv, SHA authentication and AES privacy against OID .1.3.6.1.2.1.1.1.0. A correct setup returns the firewall's system description string. If that works, run an snmpwalk and confirm that the interface, session and temperature OIDs you care about return values.
Common causes of missing data
- SNMP not enabled on the interface you are polling. The global SNMP setting is not enough. The management profile on the interface must allow it.
- Username or view mismatch in v3. The username must match exactly, the view name cannot contain spaces, and the user must be a firewall administrator.
- Wrong version or credentials. A v2c manager polling a v3-only configuration returns nothing.
- Missing MIBs. Without PAN-COMMON-MIB.my loaded, the manager shows raw numbers or no values for enterprise OIDs.
- Traps with no EngineID. The EngineID is needed for sending traps even though polling works without it.
- Expecting real-time values. Palo Alto states that SNMP responses can lag a value change by up to one minute, and it does not recommend SNMP for real-time monitoring of rapidly changing counters. Event-triggered traps update the SNMP object immediately, while normal objects refresh on a periodic ten-second cycle, per the SNMP monitoring page.
That last point shapes alert design. Set CPU or session-utilization thresholds with a sustained window of several polls, and rely on traps or syslog for hardware failures and HA failover. A single poll threshold on a counter that updates every ten seconds produces false positives.
Check the log pipeline too
If the logging rate metric drops to zero while traffic is flowing, the problem is the log path, not the network. Look at the system logs under Monitor > Logs > System, check forwarding profiles and confirm the receiving server is reachable.
Monitoring many firewalls and HA pairs
Each firewall shows only its own logs, as the log forwarding documentation explains. In a distributed environment, you need forwarding to Panorama or an external service to get a global picture. The firewall converts logs into syslog messages, SNMP traps, email notifications or HTTP payloads, and forwarding filters can target any attribute such as threat type or source user.
Panorama for fleet health
According to Palo Alto's Device Monitoring on Panorama page, Panorama and managed firewalls must run PAN-OS 8.1 or later. Panorama keeps 90 days of health statistics with trend graphs for sessions, environmentals, interfaces, logging, resources and high availability. It calculates a baseline per metric from seven-day averages plus standard deviation and lists out-of-range firewalls on the Deviating Devices tab.
Palo Alto's management strategy guidance recommends Panorama once you deploy six or more firewalls, for device groups, templates and a single ACC across the fleet. Strata Cloud Manager is presented as another single interface for managing and monitoring NGFWs and SASE.
Size log storage before it fills
Palo Alto's Panorama log collector sizing guide notes that default storage quotas on Panorama 8.0 and later allocate 60% to detailed firewall logs, 30% to summary logs, 5% to infrastructure and audit logs and 0.1% each to platform and third-party logs. Enabling log redundancy writes each log to two collectors in a group, which halves available storage and can reduce ingestion rate by up to 50%. It also recommends under 10 ms latency between collectors in a group. If your collectors span regions, plan for this.

Where firewall monitoring fits in the wider network
A firewall rarely fails alone. A VPN tunnel drops, a WAN circuit degrades, a switch port flaps, and the first symptom is a firewall alert. Investigating that across separate tools costs time. Our guides on site-to-site VPN monitoring with SNMP and hybrid cloud path visibility cover the neighboring layers that firewall alerts usually point to.
Bringing firewall data into one platform
Panorama is built to manage and monitor Palo Alto devices. The harder problem for MSPs and multi-site IT teams is correlating those devices with everything else: switches, wireless, WAN links, cloud networks, documentation and tickets.
Netverge is a unified platform for network monitoring and management that combines real-time infrastructure monitoring, anomaly detection, automated troubleshooting, AI-powered ticket triage, network documentation and multi-tenant management with role-based access. It offers integrations with major network and cloud vendors, 28+ intelligent sensors, and Vergepoints, edge hardware that gives on-site visibility at each location. Our monitoring platform page describes the capabilities in detail.
Published pricing, as listed on our pricing page and pricing guide:
| Item | Price |
|---|---|
| Starter Package | $299 per month |
| Hardware Vergepoint | $49 per month per device |
| Software Vergepoint | $29 per month per Vergepoint |
| 100 additional monitoring sensors | $100 per month |
| 100 additional sites | $100 per month |
| 100 additional clients | $100 per month |
| 10 additional AI agents | $100 per month |
| 500GB storage | $100 per month |
You can estimate a monthly total for your own site and client count with the pricing calculator, and see how the Vergepoint hardware works at a location.
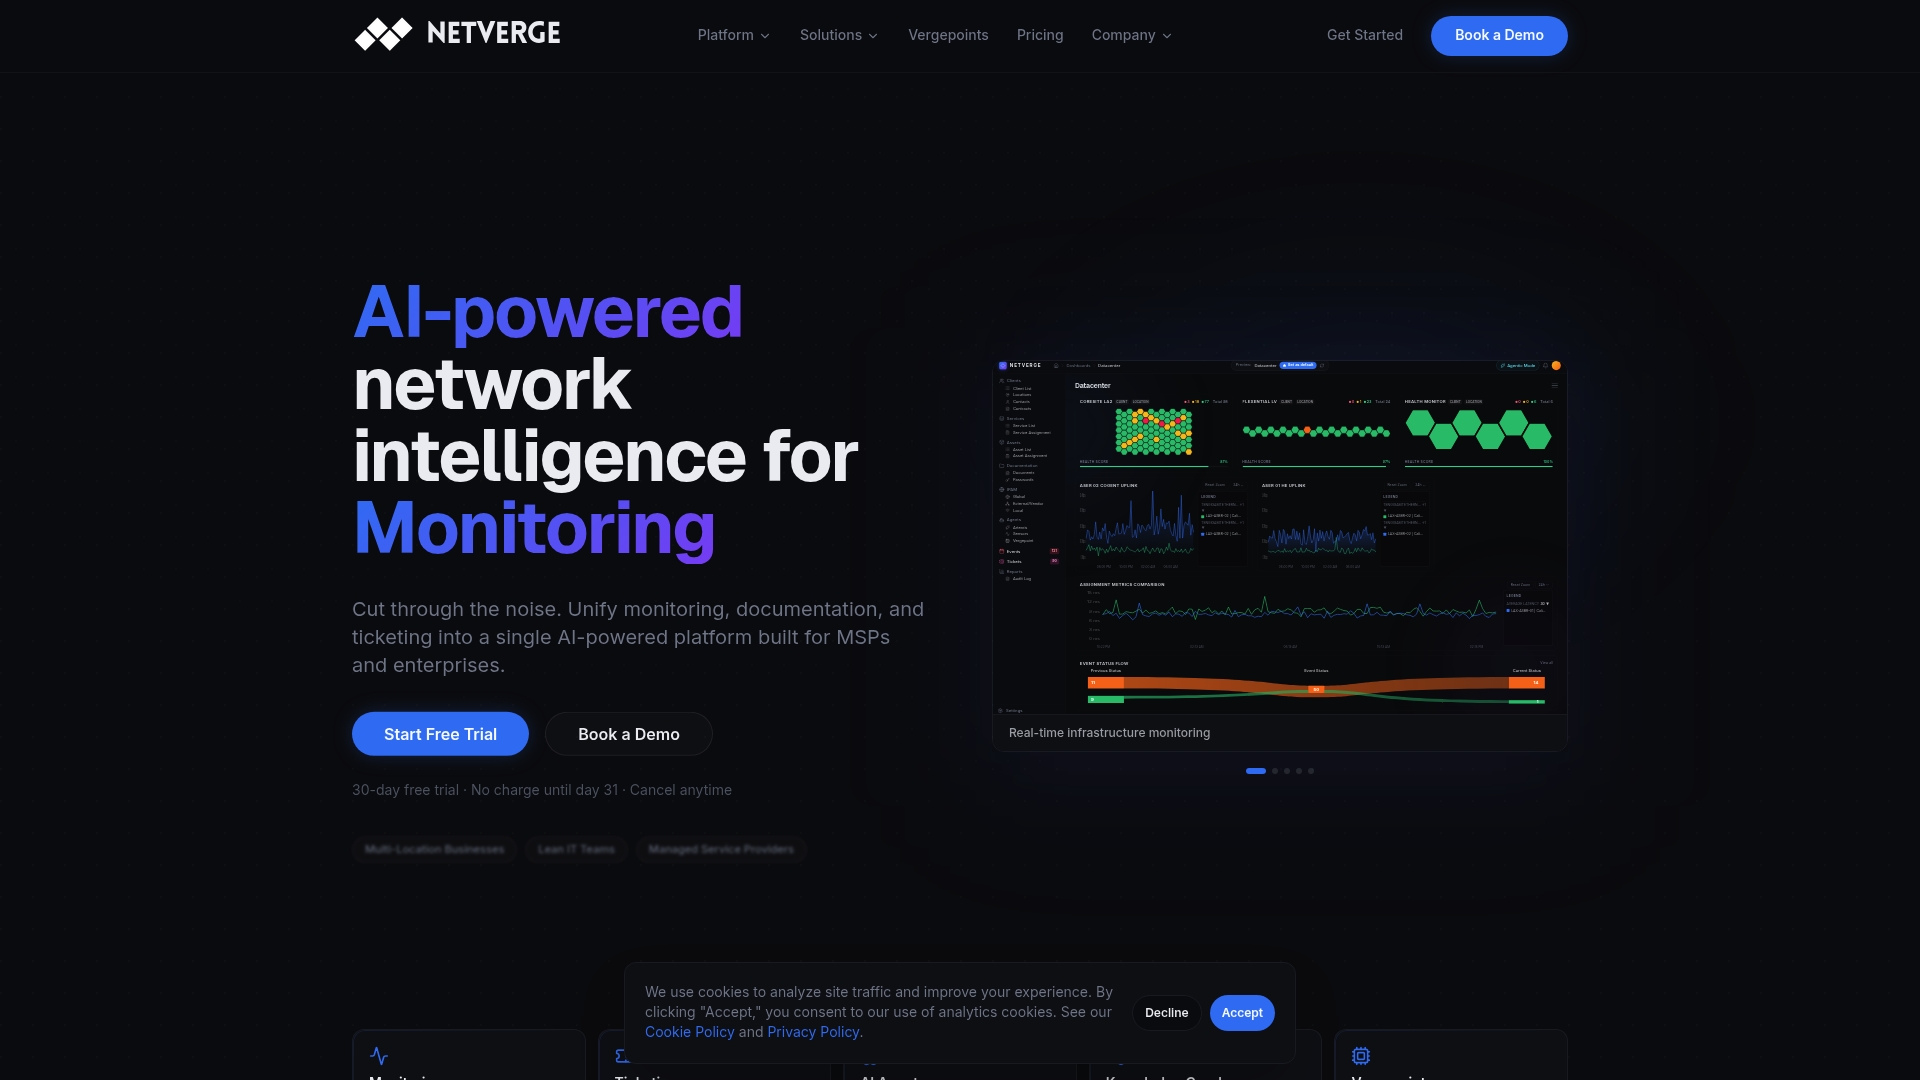
To check how your Palo Alto estate would fit into one view, start from the Netverge platform overview and use the existing trial or demo options on the site.
A starting checklist
- Inventory firewalls, PAN-OS versions and management paths for each site or customer.
- Enable SNMPv3 with SHA and AES, a dedicated read-only view and a unique user per monitoring system.
- Load the standard and enterprise MIBs and confirm with snmpget and snmpwalk.
- Poll health metrics, using sustained windows for CPU and session thresholds.
- Forward System, Configuration and Threat logs with attribute filters to the right teams.
- Send actionable events through the HTTP API to ticketing, and leave low-value events in the archive.
- Use Panorama or an equivalent central view once you pass a handful of firewalls, and size log storage in advance.
- Review thresholds after each incident so alerts match what actually mattered.
FAQ
Can SNMP change settings on a Palo Alto firewall?
No. Palo Alto states that SNMP managers can only collect statistics with GET messages and cannot control firewalls with SET messages. Polling is therefore a read-only integration, though you should still protect the credentials.
Should I use SNMPv2c or SNMPv3?
Use SNMPv3 whenever your monitoring system supports it. Version 2c sends the community string in cleartext and has no integrity protection, while v3 adds SHA authentication, optional AES encryption and per-user access to specific OIDs. If you must use v2c, replace the default "public" community string.
Why does my SNMP data lag behind what I see on the firewall?
SNMP responses can trail a change by up to a minute, and Palo Alto does not recommend SNMP for real-time monitoring of fast-changing counters. Use traps or log forwarding for events that need immediate notice, and set threshold alerts over several polling cycles.
When do I need Panorama?
Palo Alto recommends Panorama when you run six or more firewalls. It centralizes configuration, logs and health data, and keeps 90 days of health statistics with baselines for each metric.
Sources
- Palo Alto Networks: Monitoring
- Palo Alto Networks: Monitor Statistics Using SNMP
- Palo Alto Networks: SNMP Monitoring and Traps
- Palo Alto Networks: Supported MIBs
- Palo Alto Networks: How to configure SNMPv3
- Palo Alto Networks: How to Configure SNMPv3 Polling
- Palo Alto Networks: Forward Traps to an SNMP Manager
- Palo Alto Networks: Forward Traps (PAN-OS)
- Palo Alto Networks: Use External Services for Monitoring
- Palo Alto Networks: Configure Log Forwarding
- Palo Alto Networks: Log Types and Severity Levels
- Palo Alto Networks: Panorama Managed Devices Health
- Palo Alto Networks: Device Monitoring on Panorama
- Palo Alto Networks: Determine Your Management Strategy
- Palo Alto Networks: Panorama Log Collector Sizing