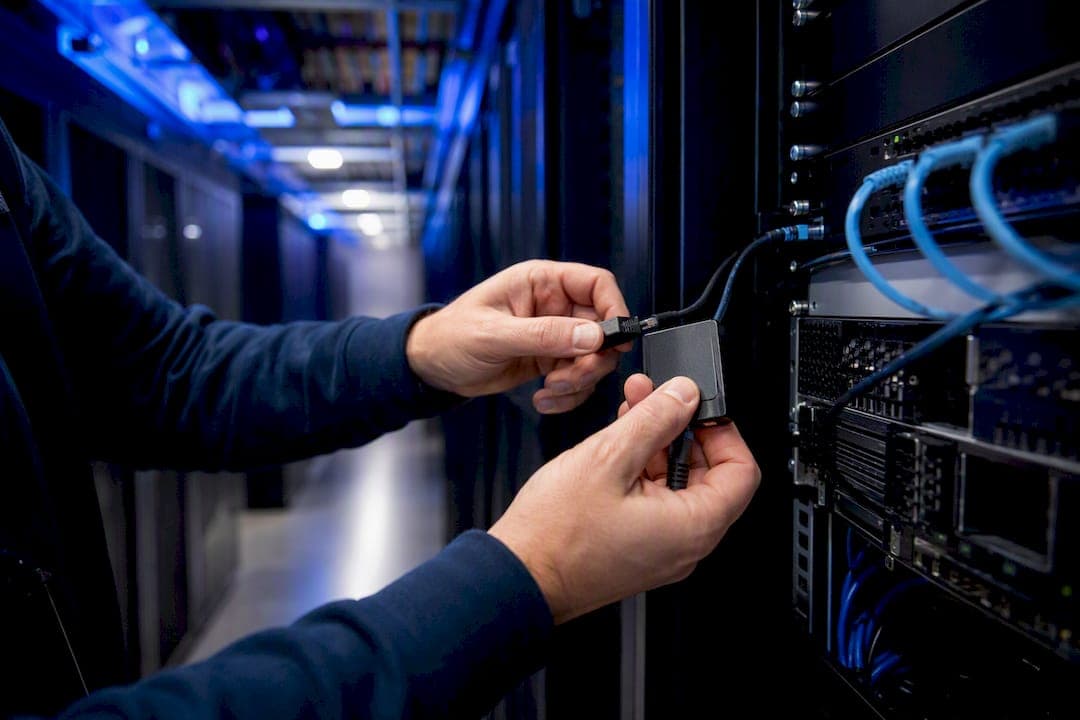
Network sensor types fall into five categories: SNMP and streaming telemetry for device health, flow telemetry (NetFlow, IPFIX, sFlow) for traffic attribution, packet capture for forensic depth, synthetic monitoring for outside-in service checks, and edge appliances that host all of them at the site level. Most MSPs should baseline device metrics, flow data, and synthetic tests across every managed site, then layer in streaming telemetry and targeted packet capture where SNMP's blind spots start costing them tickets.
TL;DR:
- Relying solely on SNMP for device health monitoring can cause missed spikes and short-lived issues due to its one-minute polling interval.
- Streaming telemetry provides real-time data with sub-second fidelity, making it essential for detecting microbursts and brief network glitches.
- Combining flow telemetry with targeted packet capture offers efficient traffic attribution and detailed security forensics, but flow sampling rates matter.
- On-site edge appliances unify multiple sensor types into one device, reducing management complexity and patching load for MSPs managing many client sites.
- A comprehensive platform incorporating all sensor types, full-fidelity flow data, and centralized management reduces incident resolution time and avoids tool-swiveling.
Table of Contents
- What Are the Core Network Sensor Types?
- How Should MSPs Deploy Sensors Across Sites?
- Which Sensor Fits Which Problem?
- What Should MSPs Require When Evaluating a Sensor Platform
- Netverge's Take: Why Sensor Fragmentation Is the Real Cost
- See How Netverge Consolidates Sensor Coverage
- Sources
What Are the Core Network Sensor Types?
Every sensor type answers a different question about the network, and confusing them is how MSPs end up with monitoring gaps they don't discover until a client escalates.
SNMP is the workhorse. It polls devices at set intervals, usually every 30- to 60-second, to pull CPU load, memory utilization, and interface counters. Nearly every switch, router, and firewall on the market supports it, which is why it remains the default for device health across mixed vendor fleets. Its weakness is temporal resolution: a 60 second poll averages out anything that spikes and resolves in between samples.
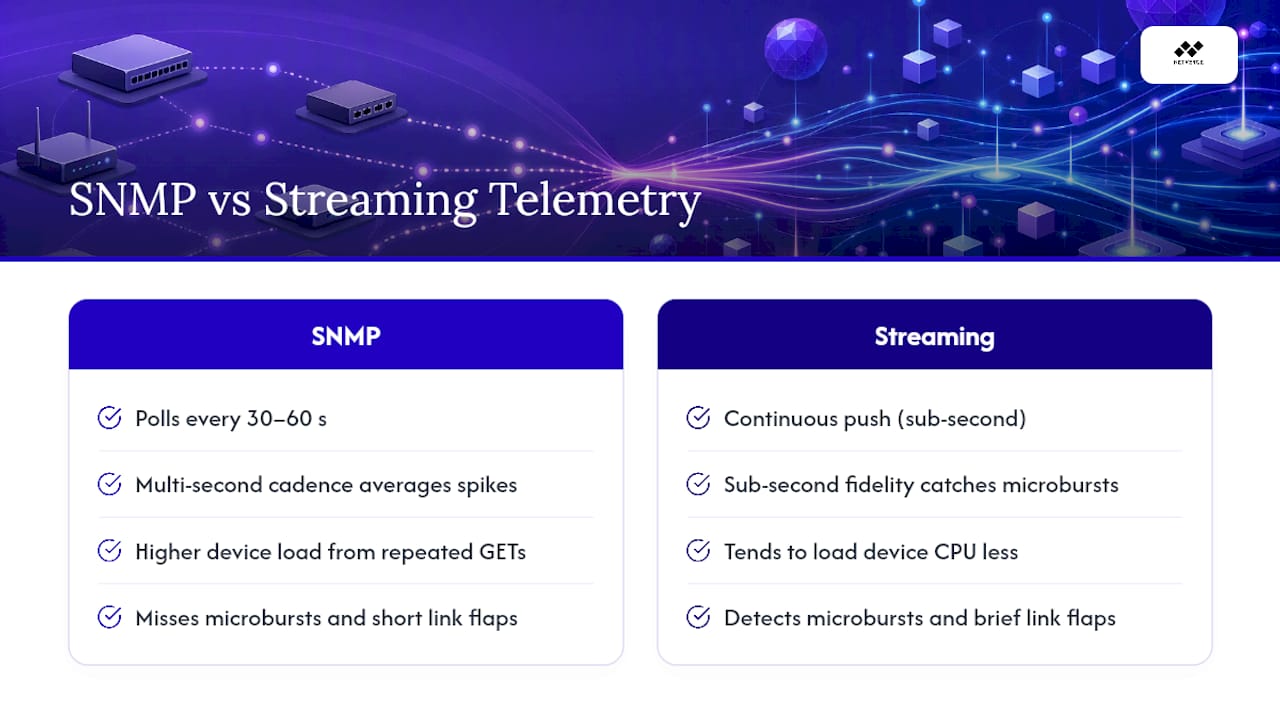
Streaming telemetry, typically delivered over gNMI and gRPC, flips the model. Instead of the collector asking the device for data, the device pushes it continuously, which delivers sub-second fidelity compared to SNMP's multi-second cadence. That granularity matters for catching microbursts, brief buffer overruns, and short link flaps that a polling interval simply erases from the record. Streaming telemetry also tends to load the device's CPU less than repeated SNMP queries, since the device controls the push rather than answering a barrage of GET requests.
Flow telemetry covers NetFlow, IPFIX, and sFlow, along with cloud-native equivalents like VPC flow logs. These protocols don't capture packet contents; they capture session metadata — source, destination, port, byte count, duration — which is exactly what you need to answer "who is consuming this link" without recording every payload that crosses it. Sampling rate becomes the tradeoff here: sample too aggressively on a high-throughput core and you lose the low-volume flows that sometimes matter most.
Packet capture (PCAP) is the deepest layer. It records full headers and payloads, giving you everything metadata leaves out when you need to reconstruct exactly what happened during an application error or security event. The cost is storage and processing overhead, so PCAP is almost always deployed as a targeted, short-window tool rather than an always-on sensor.
Synthetic monitoring rounds out the set with active tests: ICMP pings, HTTP/HTTPS checks, and multi-step transaction simulations. These run on a schedule from defined vantage points and detect degradation before end users report it, which makes synthetics the sensor type most directly tied to SLA proof.
How Should MSPs Deploy Sensors Across Sites?
Choosing a sensor type is only half the decision. The other half is picking the right form factor for each site, and getting that wrong creates as many operational headaches as skipping a sensor category entirely.
- Host and container agents. eBPF-based agents, the architecture behind tools like Cilium and Hubble, run inside the kernel and capture flow and service-map data at line rate without sidecars. They've become the standard approach for Kubernetes environments, where traditional network probes have no visibility into pod-to-pod traffic.
- Network probes. Software or virtual probes sit on a span or mirror port and observe traffic passively without touching the production path. They're the right call when you need packet-level or flow-level visibility but can't or don't want to install an agent on every host.
- On-site edge appliances. Hardware like Vergepoints consolidates multiple sensor types, SNMP polling, flow collection, synthetics, and packet capture, into a single device you drop at a remote site. For MSPs managing dozens of client locations, this beats provisioning and patching five separate tools per site.
Collector architecture matters just as much as the sensor itself. Centralized cloud ingestion simplifies management but consumes site bandwidth continuously; on-prem aggregation with periodic upload reduces that load but adds another device to patch and secure. Either way, multi-tenant environments need hard authentication boundaries and role-based access so one client's data never leaks into another's dashboard, and firmware updates need to roll out remotely, not by truck.
Pro Tip: Before adding a sensor at a new site, check the target device's CPU headroom first. Stacking SNMP polling on top of an already-strained branch router is a common way MSPs accidentally cause the outage they were trying to monitor for.
Which Sensor Fits Which Problem?
Matching the symptom to the sensor saves you from deploying everything everywhere, which is expensive, and from deploying nothing until you're firefighting blind.
- Interface or device health complaints (a switch running hot, a router dropping packets): start with SNMP for baseline coverage, and add streaming telemetry if the device supports gNMI and the issue is intermittent.
- "What's eating this link?" questions: flow telemetry answers this directly. If NetFlow or sFlow sampling is too coarse to name the culprit, raise the sample rate or enable a short PCAP window on the suspect interface.
- Microbursts and sub-second anomalies that SNMP graphs never show: streaming telemetry combined with unsampled or lightly sampled flow data is the only combination fine-grained enough to catch them.
- Security incidents or malformed application traffic: deploy targeted PCAP on a span or mirror port tied to the affected segment. Flow metadata tells you traffic moved; only packet capture tells you what was inside it.
- SLA disputes or third-party dependency failures: run synthetic tests from multiple vantage points, including outside the client's network, so you have independent proof of availability when a vendor claims otherwise.
The pattern across all five: start broad and cheap, then narrow to expensive and precise only where the first layer runs out of answers.
What Should MSPs Require When Evaluating a Sensor Platform
A procurement conversation that skips telemetry depth ends up as a platform swap eighteen months later. Before signing, confirm the platform covers this ground:
- Telemetry breadth: SNMP, streaming telemetry, NetFlow/IPFIX/sFlow, cloud flow logs, synthetics, and at least optional packet capture, not just two or three of the six.
- Sampling and retention policy: ask whether flow data is full-fidelity or sampled by default, and how long raw versus aggregated data stays queryable.
- Provisioning model: auto-provisioning for new sites, remote firmware updates, and clean multi-tenant isolation with role-based access are non-negotiable at scale.
- Transport security: encrypted transport (TLS), strong authentication, and clear data residency options, especially for regulated clients.
- Correlation across sources: the strongest platforms unify device metrics, flow, and synthetics into a single investigation workflow so an engineer can pivot from alert to traffic evidence without switching tools mid-ticket.
That last point is where most legacy stacks fail. A platform that stores SNMP data in one tool, flow in another, and synthetics in a third forces an engineer to manually stitch together a timeline during every incident, which is exactly the kind of tool-swivel that adds minutes to every resolution.
Netverge's Take: Why Sensor Fragmentation Is the Real Cost
Most MSPs already own the sensor types this article covers. What they don't own is a way to see them together. Netverge runs 24 specialized sensors across device metrics, flow, and synthetics inside one platform, with Vergepoints hardware handling on-site collection so field techs aren't juggling five agents per client. AI-driven anomaly detection and automated triage cut the time between an alert firing and an engineer having enough evidence to act. For a multi-tenant MSP, that consolidation is the difference between one login and one root-cause view, versus four dashboards and a guess.
— Jim
See How Netverge Consolidates Sensor Coverage
Netverge replaces the SNMP tool, the flow collector, and the synthetic checker you're running separately today with one platform that already covers all 24 sensor types, backed by Vergepoints hardware for plug-and-play edge visibility.

Instead of provisioning five point tools per client site, you deploy one Vergepoint and get device metrics, flow telemetry, and synthetic checks running immediately, with AI-assisted triage flagging the anomalies worth a ticket before a client even notices. Multi-tenant role-based access keeps every client's data cleanly separated, which matters the moment you're managing more than a handful of sites. If your current stack is forcing you to swivel between three dashboards during every incident, request a demo of Netverge's monitoring platform and see what one unified view of device health, traffic, and synthetics actually looks like in practice.