
Event Viewer is the built-in Windows tool for browsing the Windows Event Log, the record of everything your system, applications, and security processes report as they run. You use it to troubleshoot crashes, failed services, and login problems by tracing exact error codes and timestamps. Three fastest ways in: press Windows Key + R, type eventvwr.msc, and hit Enter; search "Event Viewer" from the Start menu; or right-click the Start button (Windows Key + X) and open it from there. These methods apply to Windows Vista and every version since, which runs on the current Event Log architecture.
Key Takeaways
Effective Event Viewer troubleshooting depends on narrowing logs by time and level, tracing Event IDs to their documented causes, and archiving logs before clearing them.
| Point | Details |
|---|---|
| Open it in seconds | Use Win+R and eventvwr.msc, Start search, or Win+X for the fastest access. |
| Filter before reading | Set Critical/Error/Warning levels and a time range instead of scrolling raw logs. |
| Event ID drives diagnosis | Look up the specific code against vendor reference tables to find the root cause. |
| Correlate across logs | Match timestamps across System, Application, and Security to build an incident timeline. |
| Archive before clearing | Save logs as .evtx to preserve full structure before wiping a full log. |
An Operator's Habit Worth Copying
I've never regretted saving a log to .evtx before clearing it. Build three or four reusable Custom Views for the errors you chase most, and once you're watching more than one machine, centralize the logs instead of repeating this manually everywhere.
Table of Contents
- How to Open Event Viewer on Any Windows PC
- What's Inside Event Viewer: Layout and Log Types
- How Do You Find Errors in Event Viewer Fast?
- Reading an Event: Fields, Event IDs, and Real Scenarios
- How to Export and Share Event Logs
- Automating Responses and Collecting Logs Remotely
- Best Practices and a Quick Troubleshooting Checklist
- Netverge's Take on Moving Beyond Local Event Viewer
- Sources
How to Open Event Viewer on Any Windows PC
Each method takes about ten seconds and lands you in the same console.
- Run dialog: Press Windows Key + R, type
eventvwr.msc, press Enter. Fastest option if your hands are already on the keyboard. - Start search: Click Start, type "Event Viewer," press Enter. Works identically on Windows 10 and 11.
- Power User menu: Press Windows Key + X, choose Computer Management, then expand Event Viewer in the left pane.
For a machine you can't sit in front of, open Computer Management, right-click "Computer Management (Local)," select "Connect to another computer," and enter the target hostname. You'll need administrator credentials on that machine, and viewing the Security log locally requires admin rights on your own device too. Remote connections also depend on network reachability and the Remote Registry service running on the target.
What's Inside Event Viewer: Layout and Log Types
The left pane organizes everything into four categories: Custom Views, Windows Logs, Applications and Services Logs, and Subscriptions. This structure exists because Event Viewer functions as an MMC snap-in built for browsing, filtering, and managing logs without needing separate tools.
Windows Logs holds the three logs most people check first. Application records events from installed software, both crashes and routine status messages. Security logs authentication attempts, marked as audit success or audit failure, plus access to protected resources. System captures events from Windows components and drivers, including service failures and hardware issues.
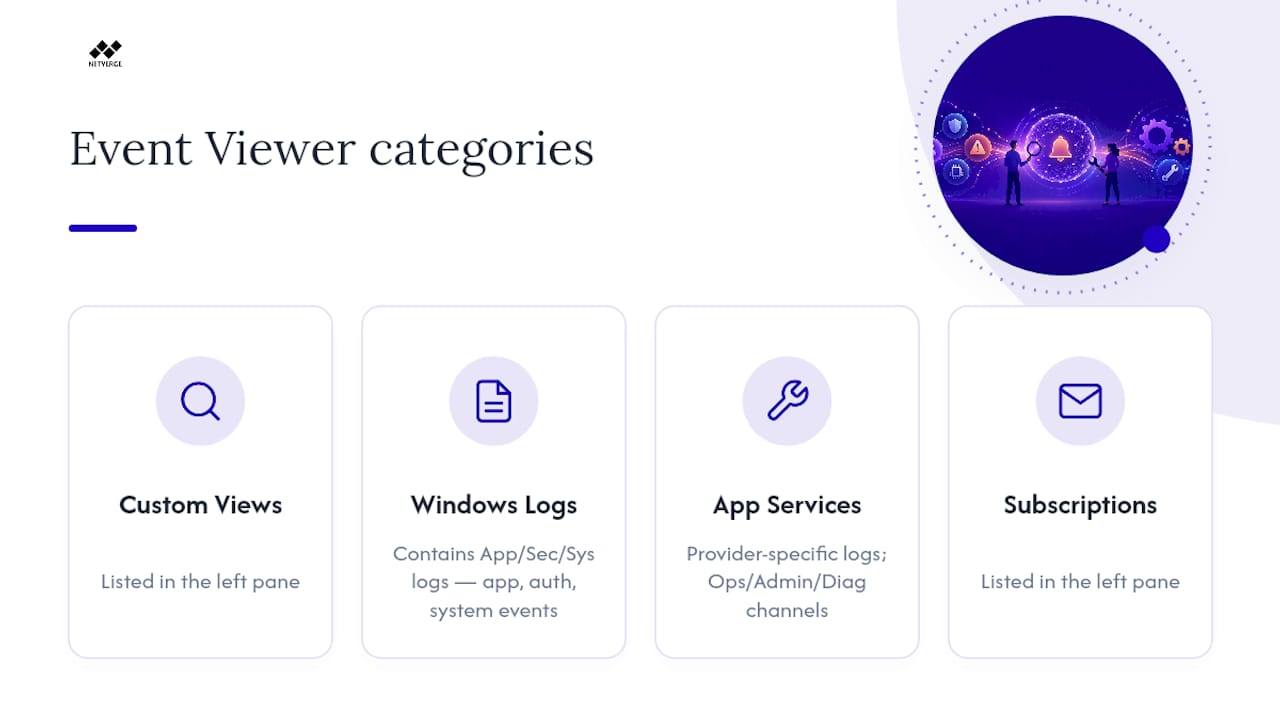
Applications and Services Logs goes deeper, storing provider-specific logs for individual Windows features and third-party applications. Expand Microsoft > Windows and you'll find dozens of subfolders, each often split into Operational, Admin, and Diagnostic channels. This is where you'd look for Task Scheduler execution history or Windows Defender activity rather than in the general System log. If you're chasing a print spooler crash or a specific driver fault, this section, not Windows Logs, usually has the detail you need.
How Do You Find Errors in Event Viewer Fast?
Start by narrowing the noise instead of scrolling.
- Right-click any log (System, Application, or a custom view) and select Filter Current Log.
- Set a time range that matches when the problem occurred. If you don't know it, start with "Last 24 hours" and widen from there.
- Check the boxes for Critical, Error, and Warning under Event Level. Skip Information and Verbose unless you're doing deep diagnostics.
- Narrow by Event Sources if you already suspect a driver or service.
- Click OK and scan the filtered list by timestamp.
For a quicker one-off search, use Find (Ctrl+F) within a single log to jump to a keyword or Event ID. When you need to search across multiple logs at once, build a Custom View instead. Custom Views let you save complex, multi-log queries so you're not rebuilding the same filter every time you troubleshoot a recurring issue. Advanced users can switch to the XML tab inside the filter dialog to write precise structured queries, useful for pulling a specific Event ID across several providers, though a malformed XML filter will silently return zero results rather than an error, so test it against a known event first.
Reading an Event: Fields, Event IDs, and Real Scenarios
Double-click any event and the General tab shows six things that matter: Level (Information, Warning, Error, or Critical), Date and Time, Source (which service or component logged it), Event ID (a numeric code specific to that source), Task Category, and a plain-language description. The Details tab shows the same event as XML, useful when you need to copy exact field names for a filter or a support ticket.

Event ID is your anchor for research. A vendor like Microsoft publishes event ID reference tables mapping specific codes to causes and fixes, and that pattern holds across most Windows components, so once you have the ID, you can usually find documented guidance for it.
Three scenarios show how this works in practice:
A service won't start. Check System log for Event ID 7000 or 7001 from Service Control Manager, which names the exact service and the failure reason.
An unexpected reboot or blue screen. Check System log around the crash timestamp for a Kernel-Power Event ID 41, then look for related Error or Critical entries in the minute before it.
Repeated authentication failures. Check Security log for Event ID 4625 (failed logon), noting the source IP and account name, then cross-reference the timestamp against Application log for related service errors.
The correlation move that matters most: line up timestamps across System, Application, and Security for the same window. One error rarely tells the whole story, and even healthy systems log routine warnings, so context and timing separate real problems from background noise.
How to Export and Share Event Logs
- Right-click the log or filtered view and choose Save All Events As.
- Pick .evtx to preserve full structure for reopening in Event Viewer on another machine, XML for scripting, or CSV for a quick spreadsheet review.
- Before clearing a log, always save it first. Raw .evtx files live at C:\Windows\System32\winevt\Logs\ and retain the structured detail that CSV strips out.
Scan exported logs for usernames, IP addresses, or hostnames before sending them to a vendor or forum.
Automating Responses and Collecting Logs Remotely
Right-click any event and select Attach Task To This Event to build an automatic response, such as sending an email or running a script the moment a specific Event ID recurs. This turns a log entry you'd otherwise catch after the fact into an active alert tied to Task Scheduler, useful for flagging a disk error or a failed backup job the moment it happens.
For visibility across several machines, Event Subscriptions let a central collector computer pull specified events from remote sources automatically, so you're not connecting to each machine one by one. Setup requires WinRM configured on both ends, admin rights, and open network reachability. Watch subscription load on the collector: pulling verbose events from dozens of machines can produce real disk and CPU pressure.
Pro Tip: Start subscriptions with just Critical and Error levels from a handful of machines. Expand scope once you've confirmed the collector can keep up.
Best Practices and a Quick Troubleshooting Checklist
Run through this sequence every time: identify the time window of the problem, check System, Application, and Security for that window, filter by Critical/Error/Warning and by source, note every relevant Event ID, then export and cross-reference with Reliability Monitor and Performance Monitor for a fuller diagnostic picture.
On retention: Windows Logs have a fixed size cap, and once full, older events get overwritten unless you archive first. Set logs to archive automatically before clearing, especially Security, which auditors often need preserved.
Manual Event Viewer use works well for a single machine. Once you're managing more than a handful of endpoints, correlating timestamps by hand across each one stops scaling, and that's the point to consider centralized log collection or a SIEM dashboard for ongoing visibility.
Netverge's Take on Moving Beyond Local Event Viewer
Local Event Viewer sessions solve today's incident but not tomorrow's pattern. Practitioners who rely on it alone for fleets of machines tend to rebuild the same filters repeatedly and lose historical context the moment a log rolls over, which is exactly why centralizing logs across a distributed network replaces one-off diagnosis with continuous, correlated visibility.
Netverge exists for the moment Event Viewer stops being enough. Once you're managing more than a few endpoints, chasing Event IDs machine by machine turns into a full-time job. Netverge unifies real-time monitoring, anomaly detection, and AI-driven ticket triage into a single dashboard, so instead of opening Event Viewer on twenty separate machines, you get correlated alerts the moment an anomaly appears. Explore Netverge's monitoring platform to see how centralized visibility replaces manual log hunting for MSPs and multi-location teams.