An event log is a chronological record of system and application activity that IT teams use for monitoring, troubleshooting, and security analysis. Tools like Windows Event Viewer, Linux syslog, and enterprise SIEM platforms all exist to capture and query this record.
Sysadmins rely on event logs for a short list of critical jobs:
- Spotting failed services, driver crashes, or hardware faults before users report them
- Reconstructing what happened during an outage or a failed deployment
- Detecting brute-force logons, lateral movement, or tampering during an incident
- Producing evidence for audits tied to standards like PCI DSS or HIPAA
Key Takeaways
Centralizing event logs with structured formats and a prioritized Event ID list turns raw noise into fast, reliable troubleshooting and security detection.
| Point | Details |
|---|---|
| Prioritize a short Event ID list | Watch 15 to 30 high-value IDs like 4624, 4625, 4688, and 1102 instead of alerting on everything. |
| Fix log size and rotation first | Raise the default Security log size before an attacker or disk overwrite erases your evidence. |
| Forward before you analyze | Use WEF or an agent so logs survive local tampering and reach a central store intact. |
| Normalize into structured formats | JSON or standardized schemas make cross-source correlation possible instead of manual guesswork. |
| Centralize with an integrated platform | Netverge combines log forwarding, AI-assisted correlation, and ticketing in one observability platform. |
Table of Contents
- What Does an Event Log Entry Actually Contain?
- What Types of Event Logs Exist in an Enterprise Network?
- What Are the Three Main Windows Event Logs?
- How Do You View and Query Event Logs Quickly?
- How Do Event Logs Support Troubleshooting and Security Investigations?
- How Should You Centralize and Protect Event Logs?
- What's the Fastest Way to Improve Log Visibility This Week?
- Where Can You Read the Primary Guidance?
- The Advice on Event Logs That Nobody Follows
- Turn Your Event Logs Into Real Visibility
- Frequently Asked Questions
- Sources
What Does an Event Log Entry Actually Contain?
Every entry, regardless of platform, shares a common skeleton: a timestamp, a source or provider, an identifier, a severity level, and a message payload. On Windows, that identifier is the Event ID; syslog uses a facility and severity code instead, and most cloud services wrap the same information in JSON.
Structured fields matter more than the message text itself. A Windows Security log entry carries a Logon ID that links related events together, plus metadata like the process name, account name, and source IP. Syslog entries carry a hostname, facility (like auth or daemon), and a free-text message that's harder to parse programmatically.
- Timestamp: when the event occurred, ideally in a consistent time zone across all sources
- Source/Provider: the service or application that generated the entry
- Event ID / Severity: a numeric code that lets you filter without reading prose
- Structured properties: JSON or XML fields that support automated correlation
Windows stores this in the binary EVTX format, while cloud platforms typically emit JSON. Structured formats are the reason automated correlation and alerting work at all. Free-text logs make analysts read; structured logs let machines do the reading first.
What Types of Event Logs Exist in an Enterprise Network?
Every enterprise environment generates logs from more sources than most teams actively watch. Knowing what each type covers helps you decide where to spend limited collection and storage budget.
- Operating system logs record boot events, service state changes, and authentication activity. Windows Security and System logs live here.
- Application logs capture errors, warnings, and custom events written by software, from database engines to line-of-business apps.
- Network device logs (syslog from firewalls, switches, and routers) show connection attempts, configuration changes, and traffic anomalies.
- Endpoint agent logs, especially Sysmon and EDR tools, track process creation, network connections, and file activity at a depth OS logs don't reach.
- Cloud service logs (Azure Activity Log, AWS CloudTrail) record API calls, resource changes, and identity events across your cloud footprint.
- Security device logs from IDS/IPS and web application firewalls flag blocked exploits and suspicious patterns.
Prioritize by exposure, not convenience. Domain controllers, internet-facing servers, and privileged-access workstations should be first in line for full log ingestion, since a compromise there does the most damage the fastest.
What Are the Three Main Windows Event Logs?
Windows organizes its core logging into three channels you'll open constantly: Application, which records events from installed software and services; System, which tracks OS-level activity like driver loads, service starts, and shutdowns; and Security, which logs authentication, authorization, and object access, and is the backbone of most incident investigations.
Beyond those three, Event Tracing for Windows (ETW) provides a lightweight, high-performance tracing framework that many Applications and Services Logs channels build on, including dedicated logs for PowerShell, Sysmon, and Task Scheduler. These channel-specific logs often carry more forensic value than the classic three, since they capture command-line activity and script execution that the Security log misses by default.
- Application: software errors, install/uninstall events, custom app logging
- System: driver failures, service state changes, unexpected reboots
- Security: logons, logoffs, privilege use, object access, policy changes
Pro Tip: The default Security log size fills up quickly on a busy domain controller and starts overwriting itself within a relatively short period. Increase the size and layer in command-line process auditing plus Sysmon before you need the evidence, not after.
How Do You View and Query Event Logs Quickly?
For ad-hoc inspection, open Event Viewer and drill into Windows Logs for Security, System, Application, and Forwarded Events, or Applications and Services Logs for Sysmon and PowerShell. Filtering by Event ID inside the GUI works fine for a single machine, but it doesn't scale past that.
PowerShell's Get-WinEvent with a FilterHashtable is faster and scriptable:
- Pull recent failed logons:
Get-WinEvent -FilterHashtable @{LogName='Security';ID=4625} - Check successful logons for correlation: filter on ID 4624 and match the Logon ID field
- Track process creation: filter on ID 4688 to see command lines if auditing is enabled
wevtutil handles exporting and sizing from the command line, useful for pulling a .evtx file for offline analysis in a different tool or on an isolated workstation. On Linux, journalctl -u servicename and grep-based syslog searches serve the same purpose as filtered Event Viewer queries.
A fast triage sequence looks the same across platforms:
- Find the anchor event (a lockout, a crash, an alert)
- Pivot using the Logon ID or Process ID to find related entries
- Pull surrounding context from Sysmon or your EDR tool for the full picture
How Do Event Logs Support Troubleshooting and Security Investigations?
A service that won't start leaves a trail in the System and Application logs, usually pointing to a missing dependency or a permissions error long before you'd find it by trial and error. Account lockouts and brute-force attempts show up as repeated Event ID 4625 entries clustered against one account or source IP, while a wave of 4740 events points to lockout policy triggering across multiple hosts.
Lateral movement investigations start with a 4624 logon and pivot through 4688 process creation events tied to the same Logon ID, tracing an attacker's path host to host. Persistence attempts often show up as new services (4697) or scheduled tasks (4698, 7045), and a 1102 event, the audit log was cleared. It is one of the strongest tampering signals you'll ever see.
- Start from a small set of high-value Event IDs instead of trying to alert on everything
- Pivot on Logon ID, Process ID, and timestamp to connect related activity
- Baseline normal behavior so anomalies actually stand out
- Alert immediately on audit policy changes and log-clearing events
Pro Tip: If you only automate alerts on one thing this quarter, make it Event ID 1102 across every domain controller. An attacker who can clear the audit log without triggering a page has already won.
How Should You Centralize and Protect Event Logs?
Local logs are convenient until a disk fills up or an attacker clears them, which is exactly why NIST SP 800-92 frames log management as a three-tier architecture: generation, collection, and storage/analysis, with centralization as the connective layer. Windows Event Forwarding (WEF) offers agentless collection built into Windows, while agents like Winlogbeat or NXLog give more control over filtering and normalization before data hits your SIEM or XDR platform.
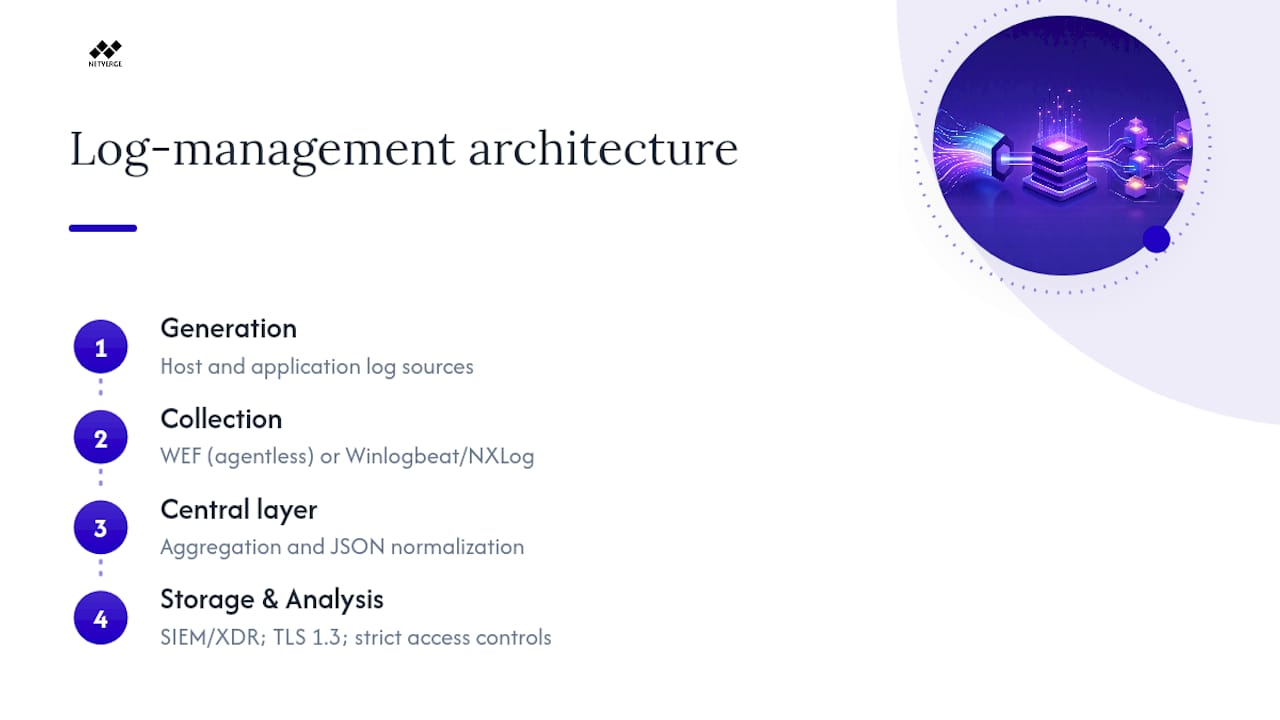
Normalizing everything into a structured format like JSON is what makes cross-source correlation possible instead of guesswork, a point IC3/CISA guidance makes explicitly when discussing Living Off the Land detection. Protect the pipeline itself with TLS 1.3 in transit, strict access controls on the log store, and integrity checks that flag any gap in the sequence.
Filter noisy, low-value events before they reach the SIEM. NXLog's guidance on WEF makes the case plainly: agentless forwarding plus a standardized schema is what lets a security team correlate ten thousand hosts instead of babysitting each one.
What's the Fastest Way to Improve Log Visibility This Week?
- Enable the critical categories in Advanced Audit Policy (logon, process creation, account management) and verify with a test logon.
- Raise Security log size on domain controllers and authentication servers to at least 1 GB, then confirm no overwrite warnings appear after 48 hours.
- Turn on command-line process auditing so 4688 events include the full command, and check one sample event to confirm the field populates.
- Deploy Sysmon with a curated, community-vetted config on your highest-value hosts, and confirm events land in the Sysmon operational channel.
- Stand up forwarding, WEF or an agent, for domain controllers and internet-facing hosts first, and verify events appear in your central store within minutes of generation.
Domain controllers and authentication infrastructure go first. Everything else can follow once the pipeline is proven.
Where Can You Read the Primary Guidance?
- Microsoft's Event Logging documentation covers the Event Logging API and Event Viewer mechanics directly from the source.
- NIST SP 800-92 lays out the log management architecture referenced throughout this guide.
- Cyber walks through GPO settings and subscription configuration in detail.
- Cyber covers retention, filtering, and prioritization.
The Advice on Event Logs That Nobody Follows
Most guidance on event logs stops at "turn on auditing and buy a SIEM." That's not wrong, but it skips the part that actually determines whether your logging program works: deciding, in advance, which fifteen or twenty Event IDs matter for your environment. Teams that try to log everything and alert on everything end up ignoring everything, because the noise floor drowns the signal within a week.
The conventional wisdom also underrates log size and rotation as a security control. A default 20 MB Security log on a busy domain controller isn't a minor inconvenience, it's an open door, because it can overwrite the exact evidence you'd need during a lateral movement investigation before anyone notices something's wrong. Fixing that takes five minutes and a GPO change, yet it's the step most environments skip.
If there's one place to start, it's forwarding before analysis. A perfectly tuned detection rule is worthless if the log it depends on got cleared locally and never left the host. Centralize first, then get sophisticated.
Turn Your Event Logs Into Real Visibility
Collecting logs is only half the job. The harder half is correlating Windows Security events, Sysmon telemetry, syslog from your network gear, and cloud audit trails into something you can act on in minutes instead of hours. Netverge unifies that pipeline: it forwards and normalizes event data from Windows hosts, network devices, and cloud services into one monitoring and observability platform, then uses AI-assisted correlation to flag the anomalies that matter and triage the tickets automatically.

For MSPs and multi-location IT teams juggling dozens of sites, that means no more jumping between Event Viewer sessions on twenty different servers. Vergepoints add local hardware visibility at the edge, while the full lifecycle event tracking module keeps every alert, ticket, and root cause connected in one knowledge graph. Start a trial and connect your first log source today.
Frequently Asked Questions
What is the difference between an event log and a log file? An event log follows a structured schema with defined fields like Event ID and severity, usually managed through a platform API such as Windows Event Logging. A generic log file can be unstructured free text with no enforced format.
How long should you retain Windows event logs? Retention should be based on risk and compliance requirements rather than a single fixed number. Many organizations forward logs to central storage and retain 90 days of hot storage for active investigation, with longer cold storage for standards like PCI DSS or HIPAA.
Which Event ID indicates a possible brute-force attack? Repeated Event ID 4625 (failed logon) entries against the same account or source IP in a short window is the classic signal, often followed by 4740 (account locked out) if a lockout policy is configured.
Do you need a SIEM to do effective event log analysis?
Not necessarily for a small environment, since Get-WinEvent and Event Viewer filtering can cover basic troubleshooting. Enterprise environments benefit from a SIEM or XDR platform because manual review does not scale past a handful of hosts.
What's the fastest way to detect log tampering? Alert on Event ID 1102, which fires when the Security audit log is cleared, and treat any unexplained gap in log sequence numbers as a red flag worth investigating immediately.
Sources
- Event Logging (Event Logging) - Win32 apps | Microsoft Learn
- NIST Special Publication 800-92: Guide to Computer Security Log Management
- Cyber
- Identifying and Mitigating Living Off the Land Techniques (IC3/CISA CSA 2024)
- Windows Event Forwarding (NXLog glossary)